© 2016 IJSRST | Volume 2 | Issue 3 | Print ISSN: 2395-6011 | Online ISSN: 2395-602X Themed Section: Science and Technology
Performance Optimization and Evaluation Algorithm
Manu Narsaria1, Dr. Debika Bhattacharya2, Himadri Nath Saha3
1Department of Computer Science & Engineering, Institute of Engineering & Management, Kolkata, West Bengal, India
Student member of ACM and IEEE
2Professor and Head of Department, Department of Computer Science & Engineering, Institute of Engineering & Management,
Kolkata, West Bengal, India
3Assisstant Professor, Department of Computer Science & Engineering, Institute of Engineering & Management, Kolkata, West
Bengal, India
ABSTRACT
Education sector in India has hardly seen changes in the way students are being taught. Few of the reasons for this are: Inefficient process of tracking students’ all round development and complex method to check the role of institutions in students’ all round development. Even today the progress of a student is measured in terms of their performance in academics, and no definite scale has been defined to evaluate the student performance with respect to their academics, and co-curricular performance combined. In the past, much of the data could not be stored due to space and cost limitations. However, rapid advancement of technologies encompassing analytical practices has opened up vast avenues of effective storage and analysis of student’s performance. In this paper, an algorithm has been proposed to analyze the student’s performance as a combination of all the activities performed by him/her and to predict the future performance of a student based on their past performances. Also the algorithm will attempt to conclude this at an institutional level to provide efficient tracking mechanisms for all its students.
Keywords: Education, Student Performance, Objective Assessment, Objective Evaluation, Predictive Analytics, Student Monitoring & Evaluation.
I.
INTRODUCTION
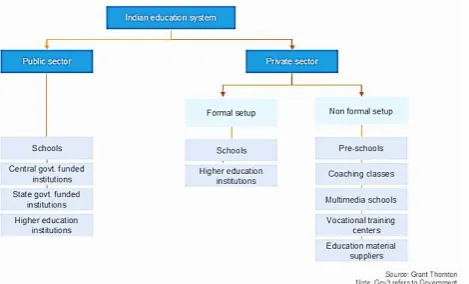
In India new methods to impart knowledge are being adopted by all the institutions. The education segment in India is estimated to reach USD144 billion by 2020 from USD100 billion in 2015 [1]. The present structure of Indian Education System is:
Figure 1: A flow chart showing the structure of Indian Education System
Digital educational programs are playing one of the most important roles in the transformation of Indian Educational Industry. Due to large scale adoption of these programs there is a huge amount of data available for analysis of students’ performance at an individual level and institutional level [5]. Every institution has a set of goals and objectives in terms of their student’s performance and for efficient working of an institution for the betterment of the society, the educational institutions tracks their students’ performance and takes necessary actions so that the performance of the students is aligned with the institution’s vision for its students.
development and have this incorporated in their vision and objectives for the students.
The students’ all-round activities data is quite complex. It can be broadly classified into following categories for each of the institutions:
Structured data
Internal: Student Assignments’ evaluation data, internal assessments.
External: Public Examinations at various levels, benchmark data
Unstructured data
Internal: Co-curricular activities performance.
External: social events, results of intellectual contests.
In the age of fast digitization, e-learning is becoming an important factor and is generating quite a large amount of data. Rather than relying on periodic test performances, institutions can analyse each students’ data and understand what methods need to be checked for improvement of students’ performance [2].
Educational Data Analysis is an emerging discipline, concerned with developing methods for exploring the unique and increasingly large-scale data that come from educational institutions, and using those methods to better understand students’ performance, and the settings which they learn in [3].
A. Related Works
Some of the mentionable reviews in this domain that has been conducted are mentioned below. Report [4], emphasizes on evaluating students’ performance in a particular subject. The focus has been more on data analysis, data mining and web dashboards. The report focuses primarily on online tools that enable evaluation of a much wider range of student actions, such as how long they devote to readings, where they get electronic resources, and how quickly they master key concepts. Paper [6] is similar work, where the authors have evaluated the performance of student in the end semester examinations. [6] Discusses some interesting aspects of data mining in evaluating students’ performance;
performance of a student. Paper [7], focuses mainly on analysis of social messages, communications related to a particular topic and help in decision making to the instructors. As example [8], focuses on analysing data to conclude the actions and methods to be adopted to impart education to the students.
The organization of this document is as follows. In Section 2 (Methods and Material), different entities in students’ performance and institutions objectives along with the algorithm has been explained in brief. In Section 3 (Result and Discussion), analysis of the results obtained by this algorithm in terms of type of data, data analysis etc. has been mentioned. Section 4(Conclusion) contains conclusion with direction for future work.
II.
METHODS AND MATERIAL
A. Entities in Students’ Performance Evaluation
Key entities in the students’ performance evaluation process are:
Programme Education Objectives (PEO) Programme Outcomes (PO)
Assessment of practical assignments (including Laboratory experiments, projects etc.)
Assessment of assignments, examinations, & co-curricular activities
Evaluation of the results obtained by assessments.
All these factors are also considered collectively at institutional level and help towards defining the Graduate Attributes of the students of a particular institution.
As defined [9] by National Board of Accreditation, India: Programme Educational Objectives are broad
statements that describe the career and professional accomplishments that the program is preparing students to achieve.
Assessment is one or more processes, carried out by the institution, that identify, collect, and prepare data to evaluate the achievement of programme educational objectives and programme outcomes.
Evaluation is one or more processes, done by the evaluation team, for interpreting the data and evidence accumulated through assessment practices. Evaluation determines the extent to which programme educational objectives or programme outcomes are being achieved, and results in decisions and actions to improve the programme.
Graduate Attributes are a set of individually assessable outcomes that the student is expected to acquire after performing optimally in all the activities (including academic & non-academic). Laboratory Educational Objectives (LEO) and
Laboratory Outcomes (LO) are also defined which are similar to the PEO and PO.
Each of the PEO and PO are mapped to a set of activities, & subjects. These subjects are taught throughout the curriculum to the students. The activities as mentioned here can be defined as any activity which contributes toward the all-round development of a student. These activities can be non-academic as well.
In next section, the algorithm is explained in brief.
B. Algorithm
Step 1. Start.
Step 2. Map the Academic Subjects to Programme Educational Objectives (PEO).
Step 3. Map the Co-Curricular activities to the PEO. Step 4. Map the Assignments corresponding to PEO
based on the subject to which the assignment corresponds to.
Step 5. Read the Students’ academic as well as co-curricular record. Every Co-Curricular activity is given a base point based on the values obtained by field experts. The marks in obtained in the assignments and academic exams are used as the input to academic metric & assignment metric respectively.
Step 6. For each student calculate the value of the Academic PEO Index (A), Assignment PEO Index (B), and Co-Curricular PEO Index(C). Step 7. Every Programme Educational Objectives (PEO)
Index is the value of the following heuristic function.
(A.x + B.y + C.z)/100.
Where:
- x = Weightage of Academic metric, y = Weightage of Assignment metric, z = Weightage of Co-Curricular metric. - x + y + z = 100
Step 8. For PEO to be attained the value of the Net PEO Index should be greater than 1.
Step 9. Repeat steps 5 – 8 until all the students’ records have not been evaluated
Step 10. At a departmental level, every PEO is expected to be completed by a minimum number of students. This desired level is given by the field experts for the initial phase.
Step 11. The Students’ PEO Index List is checked to whether desired number of students have the PEO Index greater than 1, if true then the PEO is attained by the department collectively, otherwise it is not.
Step 12. Similarly to find the Program Outcome (PO) that have been met by the students at an individual level, the metrics are defined based on the values obtained from the field experts. Step 13. For every individual student the PO is mapped
to predict the graduate attributes which are inculcated in the individual concerned.
Step 14. At a departmental level, every PO is expected to be completed by a desired percentage of the student. This desired level is obtained by the field experts.
Step 15. Map the Academic Subjects to Programme Outcome (PO).
Step 16. Map the Co-Curricular activities to the PO. Step 17. Map the Assignments corresponding to PO
based on the subject for which the assignment is given.
Step 19. Every Programme Outcome (PO) Index is the value of the following heuristic function: (A.x + B.y + C.z)/100.
Where:
- x = Weightage of Academic metric, y = Weightage of Assignment metric, z = Weightage of Co-Curricular metric.
- x + y + z = 100.
Step 20. For PO to be obtained the value of the Net PO Index should be greater than 1.
Step 21. The Students’ PO Index List is checked to whether desired number of students have the PO Index greater than 1, if true then the PO is attained by the department, otherwise it is not. Step 22. The Departmental PO List is used to map the
general graduate attributes which are possessed by the students of the department collectively. Step 23. The Laboratory Educational Objectives (LEO)
and Laboratory Outcomes (LO) are mapped against the Programme Outcome (PO) based on the value obtained by the field experts.
Step 24. The departmental PO list is used as input to the relation mentioned in step 23 to compute which LEO has been attained & which LO has been accomplished by the department collectively. Step 25. Finally a summary report is generated. Step 26. Stop.
III.
RESULT AND DISCUSSION
A. Sample Data
A sample database of 250 students was created. All the students were enrolled in 40-45 subjects, and had taken part in various non-academic activities as well. The data was similar to the real life assessments of students and consisted of real life non-academic events in which students had taken part.
B. Results Obtained
The results obtained after using the algorithm were in line with the results obtained by traditional evaluation method.
These results were obtained first on individual student level and then a summary, on an institutional level, was obtained. Also the algorithm was used to predict the outcome for the students who have not yet completed
The predicted outcome helped in deciding alternate course of actions in which activities should be conducted to help the students in performing better, thus improving the overall performance of students at an institutional level. The institutional level outcomes will depend on objectives and factor affecting the objectives as stated by the institution.
IV.
CONCLUSION
In this paper an algorithm is proposed to evaluate the performance of students, both at individual level and at institutional level. The algorithm is unique because it evaluates students not only based on their academic performance, but also based on a co-curricular metric which is as per the institutions’ preference. Additionally the paper also presents state of education system in India along with the perspective of National Board of Accreditation, India. This can help future researchers to take up a suitable area of research in an Indian context. Several papers have been studied and categorized in terms of problems they solved, data types they used and models that they chose. Also the focus has been mostly centred on benchmarks provided by the field experts. So there can be an add-on to the algorithm which changes the benchmarks based on the field experts’ value and the data on which it is working giving ample research opportunities. Even from a global scenario, areas like non-academic activities’ effect on students’ all round development are relatively uncharted. The algorithm needs to focus more on evaluating the non-academic activities of various forms which play an important role in students’ performance and all round development.
V.
REFERENCES
[1] Indian Brand Equity Foundation “Education & Training Report”, month of issue January 2016 [2] Felix Castro, Alfredo Vellido, Angela Nebot, and
Francisco Mugica, “Applying Data Mining Techniques to e-Learning Problems,” Studies in Computational Intelligence, Volume 62, 2007, pp. 183-221.
Governance Studies at Brookings, September 2012
[5] R. Darrell Bock, “Multilevel Analysis of Educational Data”, Academic Press, Inc.
[6] Brijesh Kumar Baradwaj, Saurabh Pal, " Mining Educational Data to Analyze Students’ Performance " International Journal of Advanced Computer Science and Applications, (IJACSA) Vol. 02, No. 6, 2011
[7] Alison Hramiak. "A Method for the Analysis of Data from Online Educational Research." Journal of Interactive Online Learning Vol. 04, No. 2, Fall 2005, ISSN: 1541-4914
[8] U.S. Department of Education Office of Educational Technology, “Enhancing Teaching and Learning Through Educational Data Mining and Learning Analytics,” October 2012.
[9] National Board of Accreditation, India “General Manual of Accreditation”, doi January 04, 2013 [10] Institute of Engineering & Management, Kolkata