I. INTRODUCTION
Air pollution will endanger human health and life in big cities, especially to the elderly and children. This is not an individual problem of one person but a global problem. Therefore, many countries in the world made air pollution monitoring and control stations in many cities to observe air pollutants such as NO2, CO, SO2, PM2.5, and PM10 and to alert the citizens about pollution index which exceeds the quality threshold. Particulate Matter PM 2.5 is a fine atmospheric pollutant that has a diameter of fewer than 2.5 micrometers. Particulate Matter PM10 is a coarse particulate that is 10 micrometers or less in diameter. Carbon Monoxide CO is a product of combustion of fuel such as coal, wood, or natural gas. Vehicular emission contributes to the majority of carbon monoxide let into our atmosphere. Nitrogen dioxide or nitrogen oxide expelled from high-temperature combustion: sulfur dioxide SO2 and Sulphur Oxides SO produced by volcanoes and in industrial processes. Petroleum and Coal often contain sulfur compounds, and their combustion generates sulfur dioxide. Air pollution is caused by the presence of poison gases and substances; therefore, it is impacted by the meteorological factors of a particular place, such as temperature, humidity, rain, and wind. To clear out this statement, weather data including air temperature, relative humidity, precipitation, wind speed, wind direction, which was also collected in real-time by sensors and analyzed them along with the air pollution values. In this project, the regression analysis technique is used to evaluate the relationship between these factors and predict carbon monoxide C.O. based on other parameters. This project supports environmentalists and the government to frame air quality standards and regulations based on issues of toxic and pathogenic air exposure and health-related hazards for human welfare.
It creates awareness among people about the air quality degradation and its health effects.
II. EXISTING SYSTEM
Aditya C R and et al., [1] performed two important tasks (i) Detected the levels of PM 2.5 based on given atmospheric values. (ii) Predicted the level of PM2.5 for a particular date. Logistic regression is used to detect whether a data sample was either polluted or not polluted. Autoregression was employed to predict future values of PM 2.5 based on the previous PM2.5 readings. This paper mainly predicts the air pollution level in the city with the ground data set.RuchiRaturi A and Dr. J.R Prasad [6] used the linear regression and artificial neural network (ANN) Protocol for prediction of the pollution of the next day. The system helped to predict next date pollution details based on basic parameters and analyzing pollution details and forecast future pollution. Time Series Analysis was also used for recognition of future data points and air pollution prediction.Zheng Y and et al. [7] tried to forecast the air pollution by reading an air quality monitoring station data over the next 24 hours, considers current meteorological data, weather forecasts, air quality data of the station within 100 km, and other stations within 150 km. They used machine learning and deep learning algorithms, including a linear regression-based temporal predictor along with a neural network-based spatial predictor. The prediction values were not good because PM2.5 value was increased, but they predicted decreasing. Baldasano J.M, Akita Y [2] has done modeling a framework based on the Bayesian Maximum Entropy method that integrated monitoring data and outputs from existing air quality models based on Regression and CTM (Chemical Transport Models). It was applied to estimate the yearly average of NO2 concentrations in Spain. It gave the output of Care Transition Measure CTM and the interurban scale variability through regression model output.McCollister G.M and Wilson K.R [4] described the development of an application to predict the peak ozone levels with the help of meteorological and air quality prediction variables Athens area. For this purpose, a number of regression models were considered, while the selection of the final model was based on extensive analysis and on literature. The model adapted includes variables that are available on a daily basis, so as daily operational maximum ozone concentration level forecast can be achieved.Rao S.T. and Zurbenko I.G [5] presented a statistical method for filtering or moderating the influence of meteorological fluctuations on ozone layer concentrations. The use of this statistical _________________________________________
A.Aarthi P.Gayathri N.R.Gomathi Mrs.S.Kalaiselvi Dr.V.Gomathi
[email protected]@nec.edu.in [email protected] [email protected] [email protected]
UG Scholar UG Scholar UG Scholar Asst. Prof (SG) Professor & Head
Department of Computer Science and Engineering National Engineering College, Kovilpatti
Air Quality Prediction Through Regression Model
A.Aarthi, P.Gayathri, N.R.Gomathi , S.Kalaiselvi , Dr.V.Gomathi
Abstract: Examining and protecting air quality in this world has become one of the essential activities for every human in many industrial and urban areas today. The meteorological and traffic factors, burning of fossil fuels, and industrial parameters play significant roles in air pollution. With this increasing air pollution, we need to implement models that will record information about concentrations of air pollutants. The deposition of these harmful gases in the air is affecting the quality of people's lives by altering their health, especially in urban areas. In this paper, regression techniques are used to predict the concentration of Carbon monoxide in the environment. Carbon monoxide causes headaches, dizziness, vomiting, nausea, and heart diseases. The dataset is downloaded and imported to the project. It contains data on average hourly responses of major air pollutants for nearly one year. This dataset is used to predict the amount of Carbon monoxide based on other parameters using regression analysis. It creates awareness among people about the air quality degradation, and it's health effects. Support environmentalists and government to frame air quality standards and regulations based on issues of toxic and pathogenic air exposure and health-related hazards for human welfare.
Keyword: Air pollution, health, Carbon monoxide, time-series data, Regression analysis
924 technique in examining trends in ambient ozone air quality
is demonstrated with ozone data from a monitoring location in Newyork. The results indicate that it can detect changes in the ozone layer due to changes in emissions in the presence of meteorological fluctuations.GnanaSoundari.A and et al. [3] developed a model to predict the air quality index based on historical data of previous years. It made the prediction using a multivariable regression model. It improved the efficiency of the model by applying cost Estimation for predictive Problems. This model had only 46% accuracy in predicting the available dataset on predicting the air quality index of India.
III. PROPOSED SYSTEM
In the proposed system, the air quality dataset is downloaded, which is available in CSV format. The comma-separated value data format can easily be processed and analyzed fast using a computer and the data utilized for various purposes. It is imported to the project by using a panda package available in anaconda software. The dataset contains 15 important attributes that help in air quality prediction. Initially, the dataset is preprocessed with suitable techniques to remove the inconsistent and missing valued data, and the needed features from the dataset are selected for better results. Then the dataset is split off into training and test dataset in order to evaluate the performance of the model. The processed data sets are analyzed through different regression analysis techniques for accurate results.Regression analysis is the form of a predictive modeling technique that investigates the relationship between a dependent and independent variable. This technique is used for forecasting or predicting, time series modeling, and finding the causal effect relationship between the variables. Regression analysis is a method of analyzing and modeling data. There are different kinds of regression techniques available to make predictions namely Linear regression, Support vector regression, Decision tree regression and Lasso regression
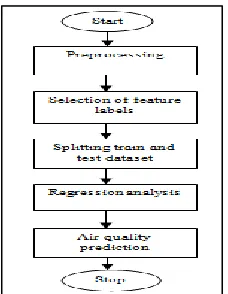
IV. FLOW DIAGRAM
Figure 1 represents the flow diagram of the system. The diagram represents the step by step process, from data preprocessing to air quality prediction.
Fig.1 Visualization of attributes
V. MODULES DESCRIPTION
A. Air quality dataset collectionThe air quality dataset for this project is collected from the UCI repository. The dataset is available in CSV format. It is downloaded and imported to the project by mentioning the location of a downloaded dataset using the panda package available in the Anaconda software. The dataset contains data of average hourly responses of different elements in the air for nearly one year from March 2018 to April 2019. Dataset consists of 9357 rows and 15 columns. The following tables 1 and 2 display the attributes used in the dataset and their standards in unpolluted air.
Table: 1 Air quality dataset attributes
S.N
o Attribute name
0 Date (DD/MM/YYYY)
1 Time (HH.MM.SS)
2 True hourly average concentration CO in mg/m^3
3 PT08.S1 (tin oxide) hourly averaged sensor response (nominally CO targeted)
4
True hourly averaged overall Non-Metanic Hydro Carbons concentration in microgram/m^3
(reference analyzer)
5
True hourly averaged Benzene(C6H6) concentration in microgram/m^3 (reference
analyzer)
6 PT08.S2 (titania) hourly averaged sensor response (nominally NMHC targeted)
7 True hourly averaged NOx concentration in ppb (reference analyzer)
8 PT08.S3 (tungsten oxide) hourly averaged sensor response (nominally NOx targeted)
9 True hourly averaged NO2 concentration in microgram/m^3 (reference analyzer)
10 PT08.S4 (tungsten oxide) hourly averaged sensor response (nominally NO2 targeted)
11 PT08.S5 (indium oxide) hourly averaged sensor response (nominally O3 targeted)
12 The temperature in °C
13 Relative Humidity (%)
14 AH Absolute Humidity
Table: 2 Air quality Standards
Attribute Standard range in air
CO 0.06 to 0.14 mg/m3
NO2 150 to 2055 mg/m3
Ozone 120 mg/m3
Benzene 975 to 9750 mg/m3
Tungsten oxide 0.14 to 6.8 mg/m3
Tin oxide 0.072 to 5.4 mg/m3
Indium oxide 0.018 to 9.8 and 0.072 to 5.4 mg/m3
B. Data preprocessing
It is a technique used in data mining that involves transforming raw data into an understandable format. The data is cleansed through processes such as filling in missing values, smoothing the noisy data, or resolving the inconsistencies in the data. As it contains some missing value, the dataset is cleaned, and decimal values are converted into proper float values.
C. Splitting training and test dataset
Separating dataset into training and testing datasets is an important part of evaluating data mining models. Typically, while separating a data set into a training dataset and testing dataset, most of the data is used for the training process, and a smaller portion of the data is used for testing. After a model has been made by using this training set, test the model by making predictions against the test Set. By using the same data for the training and testing process will minimize the data discrepancies effects of data and helps in a better understanding of the characteristics of the model. Table 3 shows the splitting of testing and training dataset for the air quality prediction.
Table: 3 Splitting testing and training dataset Whole
dataset
Data from March 2018 to April 2019
Training dataset
Data from March 2018 to December 2018
Test set Data from January 2019 to April 2019
D. Feature Selection
The data features that used to train machine learning models have a huge influence on the performance of the model. Irrelevant or partially relevant features can negatively impact model performance. In this project, the attributes such as date, time, C6H6 (benzene), PTO8.S4 tungsten oxide in the dataset are the selected features for better results. The importance of a feature is calculated as the total reduction of the criterion brought by that feature. It is also called as the Gini importance.
E. Regression analysis
The processed data sets are used to create a function to plot the training and validation data for the different models such as Linear regression, Support vector regression, Decision tree regression, and Lasso regression.Linear regression is a basic and best-used type of predictive analysis. Linear regression is used to examine two things; namely, it checks whether a set of predictor variables is doing a good job in predicting an outcome (dependent) variable And checks which variables, in particular, are the significant predictors of the outcome variable.
Y = c + b*x
Support Vector Regression uses the same principles of the Support Vector Machine for classification, with some differences. As the output is a real number, it becomes very difficult to predict the information at hand, which has infinite possibilities. The main idea is to minimize error, which maximizes the margin by individualizing the hyperplane, and part of the error is tolerated.
Y = f(x) + noise
Decision tree regression is a supervised data mining model used to predict a target by learning decision rules from features. A decision tree is constructed using recursive partitioning starting from the parent or root node. Each node can be split into the left and right child nodes. These nodes can be further split themselves to become parent nodes of their resulting children nodes.
Lasso regression is similar to linear regression but uses shrinkage. Shrinkage is where data values are shrunk toward a point as they mean. The lasso procedure encourages simple, sparse models. This regression is well-suited for models showing high levels of multicollinearity or if you want to automate certain parts of model selection, like variable selection/parameter elimination.
F. Air quality prediction
Air quality is predicted using the R squared value. R square determines the proportion of variance in the dependent variable of the system that can be explained by the independent variable. It is a statistical measure in a regression model. It is also called a coefficient of determination. The predicted R square values indicate how well a regression model predicts responses for the given observations. R square value generally lies between -1 to +1. In this project, R square value for training and test dataset is calculated using four different regression models. Here in this project R square value of the training dataset is always greater than the test data. If the R square value is near to 1, then the regression model is better for than dataset.
926 Where f = forecasts (unknown results) and o = observed
values (known results).
VI. RESULT
Figure 2 shows the dataset contains data of average hourly responses of different elements in the air for nearly one year from March 2018 to April 2019. Dataset consists of 9357 rows and 15 columns.
Fig.2 Air quality Dataset
Figure 3 represents how the dataset is cleaned, and decimal values are converted into proper float values. The data is cleansed through processes such as filling in missing values,
Fig.3 Data preprocessing
Figure 4 represents the visualization of four attributes, such as benzene, relative humidity, absolute humidity, and carbon monoxide.
Fig.4 Visualization of attributes
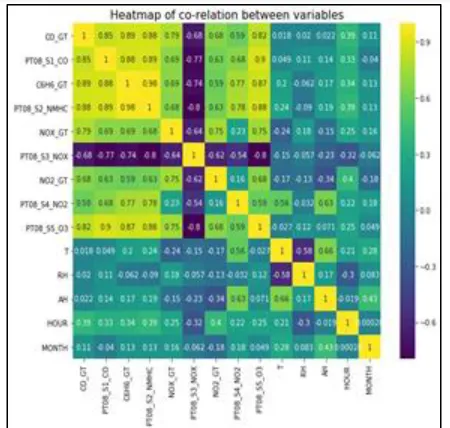
Figure 5 represents the heat map, which represents the co-relation of all attributes used in the air quality dataset in graphical representation.
Fig.5 Heat map of co-relation between variables
Fig.6 Splitting training and test dataset
Figure 7 represents the degree of linearity between Relative Humidity (RH) and carbon monoxide (CO)
Fig.7 Degree of linearity between RH and Carbon monoxide
Figure 8 represents the degree of linearity between Relative Humidity (RH) and Nitrogen dioxide (NO2)
Fig.8 Degree of linearity between RH and Nitrogen dioxide
Figure 9 represents the degree of linearity between Relative Humidity (RH) and ozone (O3)
Fig.9 Degree of linearity between RH and ozone
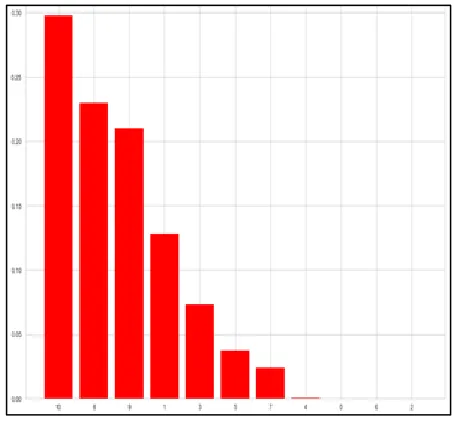
Figure 10 denotes the plot between features (X-axis) and feature importance (Y-axis). It shows how much an attribute is essential for air quality prediction.
Fig.10 Feature importance
Predicted values
The predicted values of Linear Regression are 0.54156493, 15.47186769, 5.53446644, and so on.
The predicted values of Support Vector Regression are 3.76897234, 3.76533472, 3.97684323, and so on.
The predicted values of Decision Tree Regression are 1.19529644, 15.011866, 5.83403208, and so on.
The predicted values of Lasso Regression are 1.52097529, 14.61994792, 5.26777782, and so on.
928 Table: 4 R Squared value of testing and training dataset
Regression
type Testing dataset Training dataset
Linear
regression 0.9991607196092717 0.9985467923321002 Support
vector regression
0.9999942179024977 0.9417227876811305
Decision tree regression
0.9999999999999601 1.0000492313964051
Lasso
regression 0.9991231803549476 0.9990732841217285
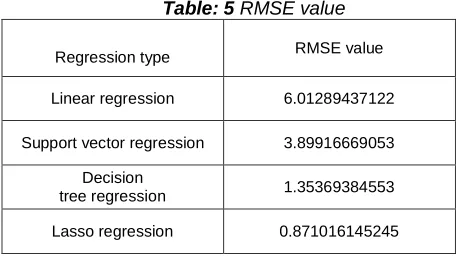
Table 5 shows the Root Mean Square Error (RMSE) value of four types of regression models.
Table: 5 RMSE value
Regression type RMSE value
Linear regression 6.01289437122
Support vector regression 3.89916669053 Decision
tree regression 1.35369384553 Lasso regression 0.871016145245
VI. CONCLUSION
Regression analysis techniques are used to predict the concentration of Carbon monoxide C.O. in the environment. The short term exposure of Carbon monoxide causes headaches, dizziness, vomiting, nausea, irritation of the airways, coughing, and difficulty in breathing and long term exposure causes irregular heartbeat, nonfatal heart attack, and even death due to lung disease. So the main sources of C.O. such as motor vehicles, power stations, cigarette smoking should be minimized. Thus this project is useful to know about the concentration of Carbon monoxide in the air. It creates awareness among people about the air quality degradation and its health effects. Support environmentalists and government to frame air quality standards and regulations based on issues of toxic and pathogenic air exposure and health-related hazards for human welfare.
REFERENCES
[1] Aditya C R, Chandana R Deshmukh, Nayana D K, Praveen Gandhi Vidyavastu "Detection and Prediction of Air Pollution using Machine Learning Models." (IJETT) – Volume 59 Issue 4 – May 2018 [2] Baldasano J.M, Akita Y "Large scale Air pollution
estimation method combining land use regression modeling in geostatistical framework," Environmental Science & Technology, vol. 48, no. 8, 2014
[3] GnanaSoundari.A Mtech, (Ph.D.), Mrs. J.GnanaJeslin M.E, (Ph.D.), Akshaya A.C. "Indian
Air Quality Prediction And Analysis Using Machine Learning." ISSN 0973-4562 Volume 14, Number 11, 2017
[4] McCollister G.M. and Wilson K.R. (2008), "Linear regression model for forecasting daily maxima and hourly concentrations of air pollutants," Atmospheric Environment.
[5] Rao, S.T., and Zurbenko, I.G.(2014)."Detecting and Tracking Changes in Air Quality using regression analysis". J. Air Waste Manage. Assoc. 44: 1089–1092.
[6] RuchiRaturi, Dr. J.R. Prasad "Recognition Of Future Air Quality Index Using Regression and Artificial Neural Network" IRJET .e-ISSN: 2395-0056 p-ISSN: 2395-0072 Volume: 05 Issue: 03 Mar-2018
[7] Y. Zheng and et al., "Predicting Fine-Grained Air Quality Based on Linear regression," KDD '15, May 2011 Proceeding of the 21st ACM SIGKDD International Conference on Knowledge Discovery and Data Mining
[8] https://en.wikipedia.org/wiki/Airpollution