3319
Human Behavior Patterns Based On Day-To-Day
Physical Activity Measurments
Waleed T. Al-Sit
Abstract: Research of human activity patterns has recently taken on increased attention. This paper presents an analyzing scheme to identify patterns of human behavior based on day-to-day physical activity in the body-worn accelerometer temporal data. Daily activities includes standing, sedentary and stepping are considered in this study. The proposed analyzing scheme is based on mapping data form from non-overlapping time interval into symbolic time series form as in DNA sequence. This mapping is considered to exploit data mining techniques in the similar manner to that used in the DNA analyzing to explore the (dis)similarity behavior in the group of 71 subjects. The obtained results show that the proposed analyzing strategy provides an effective approach to reveal (dis)similarities in the human behavior based on the individual‘s daily activity attributes.
Index Terms: Human activity, accelerometer, temporal data, spectrum kernel, feature extraction, agglomerative hierarchical clustering.
————————————————————
1
I
NTRODUCTIONHuman activity pattern analysis has been receiving increasing emphasis in recent years because of the significance of studying human behavior in many disciplines such as medicine, behavioral sciences, and physiotherapy[1]. Extracting activity information from temporal data has many applications in many domains such as, activity monitoring for healthcare and assistive living [2], [3]. As a result of the variety of domains and types of applications, several temporal data models have proven to be useful (numeric time series, symbolic time series, symbolic time sequences, symbolic interval sequence, itemset sequences) and different approaches for pattern mining based on various data models have been applied in order to retrieve different kinds of interesting patterns. Clustering is one of the most important tasks in data mining field for discovering groups and identifying interesting patterns in the underlying data [4]. The most common model of temporal data models is symbolic time series which is a set of unique time points with nominal (symbolic) values for each point such as DNA and protein sequences [5]. Generally, classification and clustering strategies used for DNA and protein sequences mostly fall into three categories: feature based, sequence distance based, and model based algorithms[6]. K-gram technique, which is representative method for the first category, was used to transform sequences into feature vectors then sequences was classified by conventional classification algorithms, such as SVM [7], [8] and decision trees [9]. Global and local alignment methods were used to compute an optimum global and local alignment scores between a pair of sequences through dynamic programming using algorithms such as Needleman Wunsch (NW) [10], Smith Waterman (SW) [11], and BLAST [12] where a distance function is defined to measure the similarity between sequences. Many researchers used the statistical models to classify sequences where they are based on generative models. Yakhnenko et al. [13] applied K order Markov model in protein and text sequence data classification .Srivastava et al. [14] used a profile HMM in order to classify biological sequences. All sequences are mapped into feature vectors and vector-based
clustering algorithms are applied to form clusters in [15]. A statistical model is created to describe the dynamics of each cluster of sequences using Hidden Markov Models (HMMs) in [16], [17]. In [18], [19], borrowing from the biological sciences, sequence alignment techniques were used by researchers to compare sequence of symbols for activity patterns. In this paper, we exploit data mining techniques used to analyze DNA and Protein sequences to analyze our dataset. Data mining approaches based on classification and clustering methods, are applied for discovering patterns in temporal data concerned with everyday activity of individuals where data is represented as symbolic time interval form. Furthermore, this work focuses on seeking efficient feature extraction strategy from symbolic time interval data by depending on symbolic time series data model.
Many application domains had considered the data in the form of sequence in the history of computer science. Using dynamic programming techniques, string kernels have been established to compute the inner product between strings (sequences) in high-dimensional feature spaces[20]. By depending on these inner products, it can be efficiently applying a variety of machine learning tasks such as classification, clustering, and regression. These kernels depend on features corresponding to existence of certain kinds of subsequences (substrings) in the string [21], [22]. One of the most widely used string kernel is k-spectrum kernel [23]. In this work, we use Support Vector Machine (SVM) classifier (as it is one the most widely used algorithm for pattern recognition) [24], in joint with spectrum kernel to validate the efficiency of the feature extraction technique used in clustering analysis by computing the recognition accuracy. This recognition step is necessary to calculate how the used features extraction technique is accurate in extracting the relevant information from a sequence. The extracted features are then used in the clustering analysis. The remainder of this paper is organised as follows. Section two provides an overview for the methodology of analyzing scheme. Section three describes how the behavior pattern has been explored. The obtained clustering results are discussed in Section four. Finally, the conclusion of work is presented in Section five.
2
M
ETHODOLOGYThe proposed analyzing scheme consists of four main phases: dataset collection, preprocessing, feature extraction technique, and then sequence exploration. These phases are described as follows.
————————————
2.1 Dataset
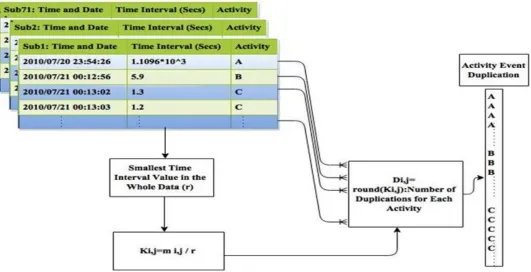
The dataset under study is provided by collaborators from University of Liverpool, UK .It comprises data for 71 subjects, 7 days continuous for each subject. The data collected from each subject is given in three fields. The first and second fields respectively provide a time stamp and duration for each activity. Durations of the activities are uneven (unequal) and non-overlapped with the previous or next interval. The third field provides unique alphabetical codes for the physical activities performed by the subjects under study. For example, A represents sedentary state, B represents standing state and C represents stepping state. Each subject can therefore represented by a sequence of activities (the successive transitions among these activities) in the form of ABC codes (e.g. ABCCCCBABACC ...) where each activity event continues for uneven time interval.
2.2 Preprocessing
Because the data is represented as symbolic time interval form and the intervals for each activity event is uneven (unequal) and non-overlapped, it must be satisfying the evenness of the intervals to convert it into symbolic time
series form. It is necessary to achieve the evenness for the intervals in order to map our data form into one of the typical temporal data models. Unequal time interval values are processed by depending on the proposed event duplicating strategy. In this strategy, the smallest time interval value in the whole dataset has been chosen and considered to achieve the equality of the intervals. The number of duplications for each activity (D ) is given by
D (1)
where m is the jth time interval value of the ith individual and is the time interval value that satisfies the evenness (smallest time interval value in the whole dataset).In addition, to the smallest time interval value, another value for has been examined to test the accuracy of the classifier when this value changes. By applying this method, the data is mapped into symbolic time series form as in DNA sequence as shown in Fig.1 and the length of each sequence increases from thousands of activity events into millions of events.
Fig. 1. Unification of events time intervals
2.3 Feature Extraction Technique
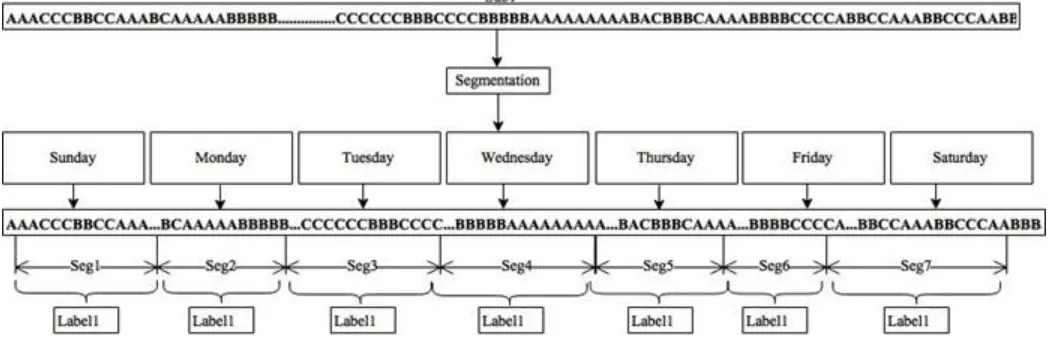
In this stage, each preprocessed sequence for each individual (subject) has been segmented into 7 subsequences depending on the day that a certain subsequence of activity events occurs. Labels are allocated for each subsequence of each individual (subject) based on the serial number of the subject, for instance, the sequence
label two ―2‖ and so on for the other subjects‘ sequences as shown in Fig.2. The main purpose of these segments of sequences is to be used in evaluating the efficiency of the techniqueused in extracting features in the feature space.
2.4Sequence Exploration
3321 Fig. 2. Example of sequence segmentation for subject1
3 Recognition of Behavior Patterns
In order to analyze the behavior for 71 individuals in the dataset, their sequences of daily activities have to be transformed into vectors of numerical values. These numerical values represent the features extracted from the sequence data. The critical step is to determine whether these features contain the relevant information from the input data. Here, we make a benefit from the classification accuracy results to evaluate how these features can represent the useful information from the sequences. The following two sections show how the extracted features are evaluated by classification accuracy results and how these feature vectors are then used in the clustering analysis.
3.1 Features Evaluation using SVM with Spectrum Kernel
In this stage the extracted features are evaluated. This evaluation is accomplished by analyzing the pattern for the group of 71 individuals, which is achieved by identifying their identity. This identification is realized by considering the sequence of activities in the individual‘s daily agenda. We use Support Vector Machine (SVM) classifier in joint with spectrum kernel to investigate the efficiency of the feature extraction technique in our dataset. In order to extract the features and map the resulted sequences after applying the evenness step described in Eq. (1) and the segmentation step described in section II into feature vectors, the set of all
k-length subsequences(k-mer occurrences) in each sequence has been considered. Inspiring from biological sciences, K-mer is a series of k contiguous symbols where k ≥ 1. Counting the occurrences of k-mer in a sequence is achieved by taking a sliding window of length k and shifting the window one base in each time from position 1 to L − K + 1 until the entire sequence is scanned [25],[26]. The feature map is indexed by all possible k-length subsequences (k-mer) a of length k from the alphabet Σ to map the input space X to ℝ as shown in the following Eq. [23]:
(2)
Where is frequency of a in and it is a mapping of the sequence into a |Σ| - dimensional feature space. The dimension of feature space is |∑| whe e |∑| 3 because the alphabet ∑ of each sequence includes A, B, and C symbols. For instance, let K=4, |∑| 3 and the dimension of feature space is 3 81 then X is N-by-M matrix where N is the number of segmented sequences and M=81. Each entry in the feature vector is the frequency of certain k-length subsequence in the sequence as described in Eq. (2). The spectrum kernel is an inner product in the feature space. Then, K -spectrum kernel of two given sequences a y over an alphabet Σ is given by the following Eq. [23]:
K y y
(3)
In order to apply SVM algorithm, eight values for k have been considered and spectrum kernel combined with polynomial kernel has been used. Since the spectrum kernel is a dot product in a feature space, then the inner product is applied on the feature vectors and the resulted kernel matrix is used by SVM classifier with polynomial kernel. The polynomial kernel is shown in the following equation, where is the degree of polynomial:
K y y +1 (4) Since the polynomial kernel is a function of the linear kernel, the spectrum kernel can be used in conjunction with the polynomial kernel to model more complex decision boundaries. Using the kernel function, the model can be mapped to higher dimensional space and non-separable data in lower space can be separated in higher dimensions. The polynomial kernel of degree combined with the k-spectrum kernel defined in Eq. (3) can be defined as follows [27]:
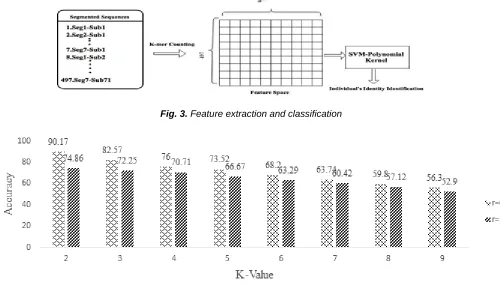
Fig. 3. Feature extraction and classification
Fig.4. Classification accuracy for different 𝑟 values using SVM
In our experiment, we use a publicly available SVM software implementation LIBSVM to apply Multiclass classification [28]. A repeated 50× 7- fold stratified cross validation has been applied and the degree of polynomial equaled to 3 gave the best performance results. Two different values (0.3, 1.5) have been adopted to check the effectiveness of this value on the classifier accuracy where represents the time interval value that achieves the evenness for the intervals shown in Eq. (1). Fig.4 shows the accuracy results when applying SVM with different values for a k , where eight values for k in k -spectrum kernel have been examined. The results show that the best classification accuracy is obtained when 0.3 (smallest time interval value in the whole dataset) with k 2 while the accuracy decreases whenever k value increases. From the results, we notice that combing polynomial kernel with spectrum kernel in SVM is an effective way to identify the individuals by considering their sequence of activities in their daily agenda. Furthermore, the recognition accuracy results prove that the feature extraction technique based on k-mer occurrences is an efficient technique to capture the relevant information from the input data.
3.2 Pattern (Dis)similarity Analysis by Clustering
In the last part of the analyzing scheme, we consider the feature space of kmer-based in order to discover (dis)similarity patterns and the individuals‘ behavior by depending on clustering strategy. The procedure used to achieve pattern comparison is as follows.
2. Dissimilarity Matrix Construction
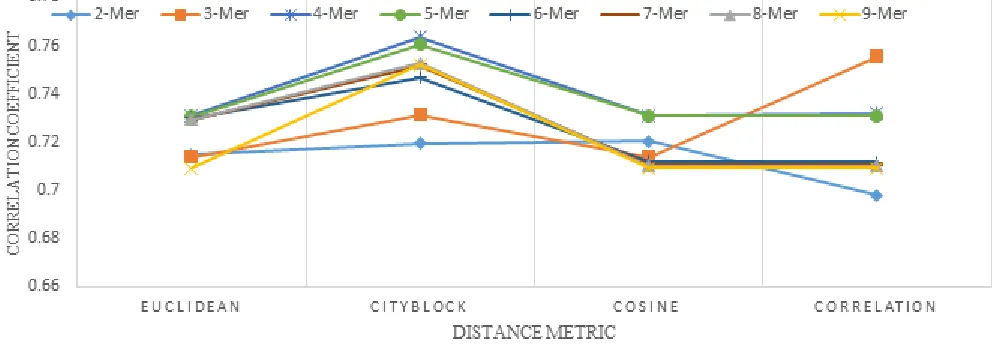
In the second stage of pattern (dis)similarity analysis, the vectors resulted from counting the occurrences of k-mer (k -subsequence) in each individual‘s (subject) sequence are used as feature vectors in calculating the pair-wise distance matrix (dissimilarity matrix) for these 71 individuals. In order to calculate the distance or matching among these 71 sequences, distance metrics such as Euclidean, Cityblock, Cosine, and Correlation are used between each pair of sequences and then dissimilarity matrix is created. In order to specify which distance metric is the best and which value of k is the optimal, four distance metrics and eight values of k have been considered to compute the dissimilarity matrices, where
k 2 3 … 9 respectively.
3. Agglomerative Hierarchical Clustering of Sequence Patterns
3323 clustering method can be calculated by many methods
depending on linkage criteria used to find the nearest clusters. Most common linkage criteria to compute distance between two clusters are single linkage, complete linkage, and average linkage. In this work, average linkage has been used where the distance between two clusters is the average distances over all points in two clusters .At each stage of hierarchical clustering, the clusters with minimum distance are merged together.
4 R
ESULTS ANDD
ISCUSSIONIn the analyzing scheme, hierarchical clustering is represented as Dendrogram diagram which is tree-like diagram that can be used to enable visual identification of patterns. In order to determine which the value of k is the optimal and which the distance metric is the best to show the behavior of the individuals, cophenetic correlation for a cluster tree is calculated. The cophenetic correlation can be defined as the linear correlation between original dissimilarity matrix, and the cophenetic distance obtained from the tree. The cophenetic distance between two subjects is the height of the link that joints the two clusters that contain those two subjects. The closer the value of the correlation is to 1, the more accurately the tree reflects and represents the dissimilarities between the individuals in the dataset. As shown in Fig.5, where the y-axis represents the correlation coefficients between dissimilarities and cophenetic distances, it can be noticed that the optimal value of k-subsequence (k-mer) is 4-mer and optimal type of distance metrics is ‗cityblock‘. This optimal value of k and ‗cityblock‘ distance metric are used to represent the
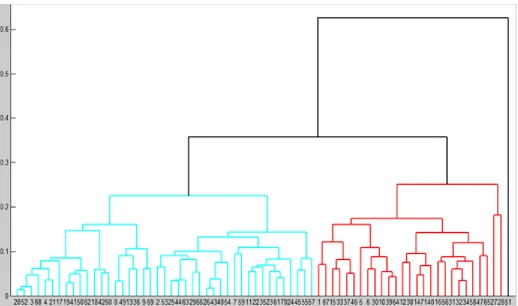
dissimilarities and similarities of the 71 subjects‘ behavior on Dendrogram as shown in Fig.6. The height of Dendrogram represents the distance between every pair of subjects and the numbers along the horizontal axis represent the indices of the subjects in the original dataset. From Dendrogram (Fig.6), it can be seen the relationships among those 71 subjects and how they are clustered closely or far away depending on the attributes that each subject has. If subjects have common behavior, they will be clustered under the same cluster or maybe clustered closely and vice versa. Furthermore, it can be notice that Dendrogram has the following characteristics:
1. Dendrogram is divided into three main clusters (red, blue, and black) and each cluster has its own subclusters.
2. The first and second clusters (red and blue) are almost clustered closely with each other by distance less than 0.4, while they are far away from the third cluster by distance greater than 0.6.
3. Cluster number three (black) has only one subject; subject 51; where this subject has abnormal behavior in his/her daily activities.
To find out the extent of similarity of behavior between any two individuals, it can be seen the distance between them within cluster in Dendrogram. Whenever the distance between them is small, there is a significant similarity of behavior and vice versa. For example, subjects 20 and 52 have a similar behavior in their daily activities because they have been clustered under the same cluster and the distance between them less than 0.1.
Fig. 6. Grouping of subjects’ behavior
5
C
ONCLUSIONSThe benefits of using data mining techniques to extract activity information from temporal data in the activity pattern analysis area have been investigated in this work. The classification accuracy results of the combined kernels in SVM demonstrate its efficiency in identifying the identity of each subjectand subsequently, validate the efficiency of the feature extraction technique used to map sequences into feature vectors. Furthermore, exploiting the concept of frequencies of k-mer in sequence used in the biological science and agglomerative hierarchical clustering method show an effective mechanism to investigate the behavior of individuals in their daily activities, where the subjects within a cluster are as similar in their behavior as possible to each other while they are dissimilar from the subjects in other clusters.
R
EFERENCES[1] Jalal, S. Kamal and D. Kim, "Detecting Complex 3D Human Motions with Body Model Low-Rank Representation for Real-Time Smart Activity Monitoring System," KSII Transactions on Internet and Information Systems, vol. 12, no. 3, pp. 1189-1204, 2018.
[2] Bussmann, J. B. J., et al. "Measuring daily behaviour using ambulatory accelerometry: the Activity Monitor." Behaviour Research Methods,
Data Engineering, IEEE Transactions on 11.1 (1999): 36-44.
[4] Guillame-Bert, Mathieu, and James L. Crowley. "Learning Temporal Association Rules on Symbolic Time Sequences." ACML. 2012. [5] Mörchen, Fabian. "Unsupervised pattern mining
from symbolic temporal data." ACM SIGKDD Explorations Newsletter 9.1 (2007): 41-55. [6] Calvo A.F., Holguin G.A., Medeiros H. (2019)
Human Activity Recognition Using Multi-modal Data Fusion. In: Vera-Rodriguez R., Fierrez J., Morales A. (eds) Progress in Pattern Recognition, Image Analysis, Computer Vision, and Applications. CIARP 2018. Lecture Notes in Computer Science, vol 11401. Springer, Cham [7] Leslie, Christina S., Eleazar Eskin, and William
Stafford Noble. "The spectrum kernel: A string kernel for SVM protein classification." Pacific symposium on biocomputing. Vol. 7. 2002. [8] Leslie, Christina, and Rui Kuang. "Fast string
kernels using inexact matching for protein sequences." The Journal of Machine Learning Research 5 (2004): 1435-1455.
3325 health records for computable patient
representation," 2018 IEEE International Conference on Bioinformatics and Biomedicine (BIBM), Madrid, Spain, 2018, pp. 1054-1061. [11]Nordin A., Yazid M., Aziz A. and Osman M. 2009
A guided dynamic programming approach for searching a set of similar DNA sequences. Applications of Digital Information and Web Technologies, 2009 ICADIWT‘09. Second International Conference on the, 2009 512-517 [12]W. Huangfu, S. Li, X. Hu and Y. Xie, "RADAR: A
3D-ReRAM based DNA Alignment Accelerator Architecture," 2018 55th ACM/ESDA/IEEE Design Automation Conference (DAC), San Francisco, CA, 2018, pp. 1-6.
[13]Yakhnenko, Oksana, Adrian Silvescu, and Vasant Honavar. "Discriminatively trained markov model for sequence classification." Data Mining, Fifth IEEE International Conference on. IEEE, 2005.
[14]Srivastava, Prashant K., et al. "HMM-ModE– Improved classification using profile hidden Markov models by optimising the discrimination threshold and modifying emission probabilities with negative training sequences." BMC bioinformatics 8.1 (2007): 104.
[15]Guralnik, Valerie, and George Karypis. "A scalable algorithm for clustering sequential data." Data Mining, 2001. ICDM 2001, Proceedings IEEE International Conference on. IEEE, 2001. [16]Oates, Tim, Laura Firoiu, and Paul R. Cohen.
"Using dynamic time warping to bootstrap HMM-based clustering of time series." Sequence Learning. Springer Berlin Heidelberg, 2001. 35-52.
[17]Smyth, Padhraic. "Clustering sequences with hidden Markov models." Advances in neural information processing systems (1997): 648-654. [18]Joh, Chang-Hyeon, et al. "Activity pattern similarity: a multidimensional sequence alignment method." Transportation Research Part B: Methodological 36.5 (2002): 385-403. [19]Shoval, Noam, and Michal Isaacson. "Sequence
alignment as a method for human activity analysis in space and time." Annals of the Association of American geographers 97.2 (2007): 282-297.
[20]Lingfei Wu, Ian En-Hsu Yen, Siyu Huo, Liang Zhao, Kun Xu, Liang Ma, Shouling Ji, and Charu Aggarwal. 2019. Efficient Global String Kernel with Random Features: Beyond Counting Substructures. In Proceedings of the 25th ACM SIGKDD International Conference on Knowledge Discovery & Data Mining (KDD '19). ACM, New York, NY, USA, 520-528. DOI:
[21]Shawe-Taylor, John, and Nello Cristianini. Kernel methods for pattern analysis. Cambridge university press, 2004.
[22]Rousu, Juho, and John Shawe-Taylor. "Efficient computation of gapped substring kernels on large alphabets." Journal of Machine Learning Research. 2005.
[23]Leslie, Christina S., Eleazar Eskin, and William Stafford Noble. "The spectrum kernel: A string kernel for SVM protein classification." Pacific symposium on biocomputing. Vol. 7. 2002. [24]J. Xu, C. Xu, B. Zou, Y. Y. Tang, J. Peng and X.
You, "New Incremental Learning Algorithm With Support Vector Machines," in IEEE Transactions on Systems, Man, and Cybernetics: Systems. doi:10.1109/TSMC.2018.2791511
[25]Serrano-Solís, V., Toscano Soares, P.E. & de Farías, S.T. J Mol Evol (2019) 87: 7. https://doi.org/10.1007/s00239-018-9877-1 [26]Vinga, Susana, and Jonas Almeida.
"Alignment-free sequence comparison—a review." Bioinformatics 19.4 (2003): 513-523.
[27]Ben-Hur, Asa, et al. "Support vector machines and kernels for computational biology." PLoS computational biology 4.10 (2008): e1000173. [28]Chang, Chih-Chung, and Chih-Jen Lin.