ISSN: 2250-3021 Volume 2, Issue 8 (August 2012), PP 18-22 www.iosrjen.org
Performance Evaluation of Text-Independent Speaker
Identification and Verification Using MFCC and GMM
Palivela Hema
1, E.Venkatanarayana
21
(M.tech-C&C),Department of ECE, Jawaharlal Nehru Technological University Kakinada(JNTUK) Kakinada,India)
2
(Asst.Professor,Department of ECE, Jawaharlal Nehru Technological University Kakinada(JNTUK), Kakinada,India)
Abstract : - This paper presents the performance of a text independent speaker identification and verification system using Gaussian Mixture Model(GMM).In this paper, we adapted Mel-Frequency Cepstral Coefficients(MFCC) as speaker speech feature parameters and the concept of Gaussian Mixture Model for classification with log-likelihood estimation. The Gaussian Mixture Modeling method with diagonal covariance is increasingly being used for both speaker identification and verification. We have used speakers in experiments, modeled with 13 mel-cepstral coefficients. Speaker verification performance was conducted using False Acceptance Rate (FAR), False Rejection Rate(FRR) and Equal Error Rate(ERR).
Keywords: - Equal Error Rate, Gaussian Mixture Model, Mel-Frequency Cepstral Coefficients, speaker identification, speaker verification.
I. Introduction
Speaker recognition can be classified into speaker identification and verification. Speaker identification is the process of determining which registered speaker provides a given utterance i.e. to identify the speaker without any prior knowledge to a claimed identity. Speaker verification refers to whether or not the speech samples belong to specific speaker. speaker recognition can be Text-Dependent or text-Independent. The verification is the number of decision alternatives. In Identification ,the number of decision alternatives is dependent to the size of population, whereas in verification there are only two choices, acceptance or rejection ,regardless of population size.
Feature extraction deals with extracting the features of speech from each frame and representing it as a vector. The feature here is the spectral envelope of the speech spectrum which is represented by the acoustic vectors. Mel Frequency Cepstral Coefficients(MFCC) is the most common technique for feature extraction which computed on a warped frequency scale based on human auditory perception.
GMM[1,2] has been being the most classical method for text-independent speaker recognition. Reynolds etc. introduced GMM to speaker identification and verification.GMM is trained from a large database of different people. The speeches of this database should be carefully selected from different people in order to get better results.
II. Speaker identification and verification system.
The process of speaker recognition is divided into enrolment phase and testing phase. During the enrolment, speech samples from the speaker are collected and used to train their models. The collection of enrolled models is saved in a speaker database. In the testing phase, a test sample from an unknown speaker is compared against the database.
The basic structure for a speaker identification and verification system is shown in Figure 1 (a) and (b) respectively [3].
In both systems, the speech signal is first processed to extract useful information called features. In the identification system these features are compared to a speaker database representing the speaker set from which we wish to identify the unknown voice. The speaker associated with the most likely, or highest scoring model is selected as the identified speaker. This is simply a maximum likelihood classifier [3].
Speech Signal
•
(a)
Speech signal
(b)
Figure1:Basic structure of (a) speaker identification and (b)Speaker Verification system.
The verification system essentially implements a likelihood ratio test to distinguish the test speech comes from the claimed speaker. Features extracted from the speech signal are compared to a model representing the claimed speaker, obtained from a previous enrolment. The ratio (or difference in the log domain) of speaker and imposter match scores is the likelihood ratio statistic (Λ), which is then compared to a threshold (θ) to decide whether to accept or reject the speaker [3].
III. Feature Extraction
Preprocessing mostly is necessary to facilitate further high performance recognition. A wide range of possibilities exist for parametrically representing the speech signal for the voice recognition task.
Mel Frequency Cepstral Coefficients (MFCC):
Mel Frequency Cepstral Coefficients (MFCC) are derived from the Fourier Transform (FFT) of the audio clip. The basic difference between the FFT and the MFCC is that in the MFCC, the frequency bands are positioned logarithmically (on the Mel scale) which approximates the human auditory system's response more closely than the linearly spaced frequency bands of FFT. This allows for better processing of data. The main purpose of the MFCC processor is to mimic the behaviour of the human ears. Overall the MFCC process has 5 steps that show in figure2.
At the Frame Blocking Step a continuous speech signal is divided into frames of N samples. Adjacent frames are being separated by M (M<N). The values used are M = 128 and N =256. The next step in the processing is to window each individual frame so as to minimize the signal discontinuities at the beginning and end of each frame. The concept here is to minimize the spectral distortion by using the window to taper the signal to zero at the beginning and end of each frame. If we define the window as w(n), 0 ≤ n ≤ N −1, where N is the number of samples in each frame, then the result of windowing is the signal
Front-end Processing
Speaker model
Imposter model
Σ
+
-
Λ>θ Accept
Λ<θ Reject Front-end
Processing
Speaker 1
Speaker 2
Speaker N
M
A
X
•
•
Speaker #
y (n) = x (n)w(n) , 0 ≤ n ≤ N −1 (1) Typically the Hamming window is used, which has the form:
W(n) = 0.54 - 0.46 cos 𝑵−𝟏𝟐𝝅𝒏 , 0 ≤ n ≤ N −1 (2)
Use of speech spectrum for modifying work domain on signals from time to frequency is made possible using Fourier coefficients. At such applications the rapid and practical way of estimating the spectrum is use of rapid Fourier changes.
Xk= 𝑵−𝟏 𝒏=𝟎 𝑿𝟏 𝒆
−𝒋𝟐𝝅𝒌𝒏
𝑵 , k = 0,1,2,….., N-1 (3)
Psychophysical studies have shown that human perception of the frequency contents of sounds for speech signals does not follow a linear scale. Thus for each tone with an actual frequency, f, measured in Hz, a subjective pitch is measured on a scale called the „mel‟ scale [3],[4]. The mel-frequency scale is a linear frequency spacing below 1000 Hz and a logarithmic spacing above 1000 Hz. Therefore we can use the following approximate formula to compute the mels for a given frequency f in Hz:
mel(f) = 2595*log10(1+f/700) (4)
The final procedure for the Mel Frequency cepstral coefficients (MFCC) computation is to convert the log mel spectrum back to time domain where we get the so called the mel frequency cepstral coefficients (MFCC). Because the mel spectrum coefficients are real numbers, we can convert them to the time domain using the Discrete Cosine Transform (DCT) and get a featured vector. The DCT compresses these coefficients to 13 in number.
IV. The Gaussian Mixture Speaker Model.
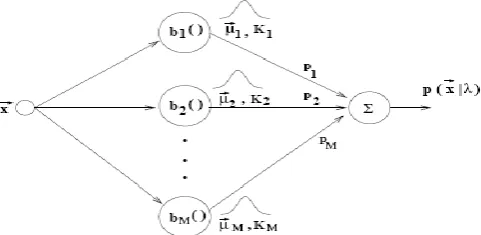
A mixture of Gaussian probability densities is a weighted sum of M densities, as depicted in Fig.3 and is given by:
p 𝒙 𝝀 = 𝑴𝒊=𝟏𝒑𝒊𝒃𝒊 𝒙 (5)
where 𝒙 is a random vector of dimension D,𝒃𝒊 𝒙 ,i=1,…,M, are the density components ,and
𝒑𝒊,i=1,..M, are the mixture weights. Each component density is a D variate Gaussian function of the form:
𝒃𝒊 𝒙 = 𝒆 −
𝟏
𝟐 𝒙 −µ ′ 𝑲𝒊−𝟏 𝒙 −µ
(𝟐𝝅)
𝑫 𝟐 |𝑲𝒊|
(6)
With mean vector µ and covariance matrix 𝐾𝑖 𝑖.
Note that the weighting of the mixtures satisfy 𝑀𝑖=1𝑝𝑖=1.The complete Gaussian mixture density is
parameterized by a vector of means, covariance matrix, and a weighted mixture of all component densities(𝜆 model).These parameters are jointly represented by the following notation.
λ = {𝒑𝒊, µ 𝒊, 𝑲𝒊} i=1,…,M. (7)
The GMM can have different forms on the choice of the covariance matrix. The model can have a covariance matrix per Gaussian component as indicated in (nodal covariance),a covariance matrix for all Gaussian components for a given model (grand covariance ),or only one covariance matrix shared by all models(global covariance).A covariance matrix can also be complete or diagonal[4].
Since Gaussian components jointly act to model the probability density function, the complete covariance matrix is usually not necessary. Even being the input vectors not statistically independent, the linear combination of the diagonal covariance matrices in the GMM is able to model the correlation between the given vectors. The effect of using a set of M complete covariance matrices can be equally obtained by using a larger set of diagonal covariance matrices[5].
For a set of training data the Estimation of maximum Likelihood is necessary. In other words this estimation tries to find the model parameters that maximize the likelihood of GMM. The algorithm presented in [6] is widely used for this task. For a sequence of independent T vectors for
training X = {𝒙 𝟏 ,…..,𝒙 𝑻 },the likelihood of the GMM is given by:
𝒑 𝑿 𝝀 = 𝑻𝒕=𝟏𝒑 𝒙 𝝀 𝒕 (8)
The likelihood for modeling a true speaker (model ) is directly calculated through
log 𝒑 𝑿 𝝀 = 𝟏
𝑻 𝐥𝐨𝐠 𝒑 𝒙 𝝀 𝒕 𝑻
𝒕=𝟏 (9)
The scale factor 𝟏
𝑻 is used in order to normalize the likelihood according to the duration of the
elocution(number of feature vectors).The last equation corresponds to the normalized logarithmic likelihood which is the λ model‟s response.
The speaker verification system requires a binary decision, accepting or rejecting a speaker. The system uses two models which provide the normalized logarithmic likelihood with input vectors 𝒙 𝟏 ,…..,𝒙 one from 𝑻
pretense speaker and another one trying to minimize the variation not related to the speaker providing a more stable decision threshold. If the system output value (difference between two likelihood) is higher than a given threshold θ the speaker is accepted otherwise it is rejected as shown in figure1(b). the background (imposter model) is built with a hypothetical set of false speakers and modeled via GMM. The threshold is calculated on the basis of experimental results.
V. Experimental Evaluation.
This section presents the experimental evaluation of the Gaussian mixture speaker model for text-independent speaker identification and verification. The evaluation of a speaker identification experiment was conducted in the following manner. The test speech was first processed by the front end analysis to produce the sequence of feature vectors { 𝑥 ,…..,𝑥1 }.To evaluate different test utterance lengths, the sequence of feature 𝑇
vectors was divided into overlapping segments of T feature vectors. The first two segments from a sequence would be:
Segment1
𝐱𝟏
, 𝐱 , … … , 𝐱𝟐 , 𝒙𝐓 , 𝒙𝑻+𝟏 ,…… 𝑻+𝟐
Segment2
𝐱𝟏
, 𝐱 , … … , 𝐱𝟐 , 𝒙𝐓 , 𝒙𝑻+𝟏 𝑻+𝟐…….
A test segment length of 5 seconds corresponds to T=500 feature vectors at a 10ms frame rate. Each segment of T vectors was treated as a separate test utterance.
The identified speaker of each segment was compared to the actual speaker of the test utterance and the number of segments which were correctly identified was tabulated. The above steps were repeated for test utterances from each speaker in the population. The final performance evaluation was then computed as the percent of correctly identified T-length segments over all test utterances
%correct identification
= # 𝒄𝒐𝒓𝒓𝒆𝒄𝒕𝒍𝒚 𝒊𝒅𝒆𝒏𝒕𝒊𝒇𝒊𝒆𝒅 𝒔𝒆𝒈𝒎𝒆𝒏𝒕𝒔
𝒕𝒐𝒕𝒂𝒍 # 𝒐𝒇 𝒔𝒆𝒈𝒎𝒆𝒏𝒕𝒔 X 100.
The evaluation was repeated for different values of T to evaluate performance with respect to test utterance length.
Speaker verification:
The acceptance or rejection of an unknown speaker depends on the determination of the threshold value from the training speaker model.
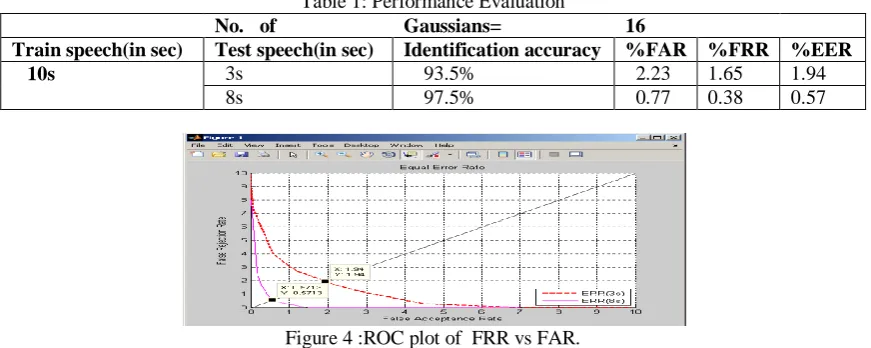
If the system accepts an impostor, it makes a false acceptance (FA) error. If the system rejects a valid user, it makes a false reject (FR) error. The FA and FR errors can be traded off by adjusting the decision threshold, (as shown by a Receiver Operating Characteristic (ROC) curve.)
The ROC curve is obtained by assigning false rejection rate (FRR) and false acceptance rate (FAR), to the vertical and horizontal axes respectively, and varying the decision threshold. The FAR and FRR are obtained by equation (10) and (11) respectively.
FAR= EI / I * 100% (10)
where EI is the number of impostor acceptance, I is the number of impostor claims. FRR = ES / S * 100% (11)
The operating point where the FAR and FRR are equal corresponds to the equal error rate (EER). The equal‐error rate (EER) is a commonly accepted overall measure of system performance. It also corresponds to the threshold at which the false acceptance rate is equal to the false rejection rate.
VI. Simulation Results
The system has been implemented in Matlab7 on windows XP platform. The result of the study has been presented in Table 1. We have used coefficient order of 13 for all experiments. We have trained the model using Gaussian mixture components as 16 for training speech lengths as 10sec.Testing is performed using different test speech lengths such as 3 sec, and 8sec.. Here, recognition rate is defined as the ratio of the number of speaker identified to the total number of speakers tested. FAR and FRR are estimated using the expressions (10) and (11). Figure 4.shows a ROC plot of FRR vs FAR.The EER obtained is indicated in Figure(4).
Table 1: Performance Evaluation
No. of Gaussians= 16
Train speech(in sec) Test speech(in sec) Identification accuracy %FAR %FRR %EER
10s 3s 93.5% 2.23 1.65 1.94
8s 97.5% 0.77 0.38 0.57
Figure 4 :ROC plot of FRR vs FAR.
VII .Conclusion
In this work we have demonstrated the importance of test speech length duration for speaker recognition task. Speaker discrimination information is effectively captured for coefficient order 13 by using GMM. The recognition performance depends on the training speech length selected for training to capture the speaker-discrimination information. Larger the test length ,the better is the performance, although smaller number reduces computational complexity.
The objective of this paper was mainly to demonstrate the significance of speaker-discrimination information present in the speech signal for speaker recognition. We have not made any attempt to optimize the parameters of the model used for feature extraction, and also the decision making stage. Therefore the performance of speaker recognition may be improved by optimizing the various design parameters.
References
[1] D. A. Reynolds,“Speaker Identification and Verification using Gaussian Mixture Speaker Models, ”Speech
Communication, Vol. 17, pp. 91- 108, 1995.
[2] Douglas A. Reynolds, Thomas F. Quatieri and Robert B. Dunn. “Speaker verification using adapted Gaussian mixture models.” Digital Signal Processing, Academic Press, 2000.
[3] Douglas A.Reynolds,“AutomaticSpeaker Recognition: Current Approaches and Future Trends”,
MIT Lincoln Laboratory, Lexington, MA USA.
[4] Reynolds, Douglas A.Speaker Identification and verification Using Gaussian Mixture Speaker Models. Speech Communication.vol.17,pp.91-108,1995.
[5] Reynolds, Douglas A. Robust Text-Independent Speaker Identification Using Gaussian Mixture Speaker Model. IEEE Transactions on Speech and Audio Processing. Vol. 3, n. 1, pp. 72-83, January, 1995.
[6] Reynolds, Douglas A. Gaussian Mixture Modeling Approach to Text-Independent Speaker Identification. PhD Thesis. Georgia Institute of Technology, August 1992.
[7] Z.J.Wu and Z.G.Cao, “Improved MFCC-Based Feature for Robust Speaker Identification”, TSINGHUA Science and Technology, vol.10, pp. 158-161, Apr. 2005.
[8] Wei HAN,Cheong-Fat CHAN, Chiu-Sing CHOY and Kong-Pang PUN,(2006) “An Efficient MFCC Extraction Method in Speech Recognition”,Circuits and Systems, ISCAS 2006. Proceedings. IEEE InternationalSymposium on 21-24 May 2006, pp.4
[9] Tomi Kinnunen., and Haizhou Li., An overview of Text-Independent Speaker Recognition: from Features to