© 2019 Abramov et al. This is an Open Access article distributed under the terms of the Creative Commons Attribution License (http://creativecommons.org/licenses/by/2.0), which permits unrestricted use, distribution, and reproduction in any medium, provided the original work is properly cited.
THEMED ISSUE
OPEN ACCESS
Providing Innovative Processes in the Economic Development of the Russian
Regions
Olim T. Astanakulov,†*Natalia V. Kuchkovskaya,¥Patimat S. Bataeva, ÌNatalia I. Khokhlova, Î and
Mauricio Calesciί
Abstract
One of the most important demonstrations of the modern economy is the growing importance of innovation. The innovative process or the process of technological change is a complex concept encompassing the improvement of products, production processes, raw materials as well as management methods. Therefore, the central aim of the research is to analyse the innovative processes that contribute to the development of the state economy. To accomplish the objectives, we carried out the calculations to examine the relations between the cost indicators, modelling, correlation and regression analyses. The particularities of business processes in innovative activities of organisations lead to uneven distribution, specific cost structure in the crisis and the traditional situation of an insignificant share of innovation in the financing process. The study presents a mathematic model of innovation activities of an enterprise, based on economic indicators of current operations. The object of the research is industrial enterprises. Since an important segment of business processes in innovation is small innovative companies, our task is to develop a methodology for forecasting the number that would be suitable for them. From the findings of our research, we concluded that the models that had been previously developed were more effective at the micro-level. Based on the analysis of the distribution of costs between technological, marketing, organisational innovations by types of innovation and economic activities by building an adequate set of statistical models, we have identified the following particularities: the basic internal (directly dependent) and external (indirectly affecting) factors that affect the selected performance characteristics.
Keywords: Development, Innovation, Structure, Enterprise, Economy, the Republic of Tatarstan
† Tashkent Institute of Finance, 100000, 60 A st. A.Temur, Tashkent, Uzbekistan, *Corresponding Author, Email: [email protected]
¥ Department of Corporate Finance and Corporate Governance; Financial University under the Government of the
Russian Federation, 125993, 49 Leningradskiy Ave., Moscow, Russian Federation
ÌDepartment of Finance and Credit, Chechen State University, 366007, Boulevard Dudayev, Grozny, Russian
Federation
ÎDepartment of Clinical Psychology; Surgut State University,, 628403, 1 Lenina Ave., Surgut, Russian Federation ίDepartment of World Economics; Universidad de Buenos Aires, Av. Córdoba 2122, 1113 Caba Ciudad de Buenos
Introduction
Business processes go through a cycle of transition. Usually, it is a smooth transition from traditional to innovative business processes, and, on the contrary, from innovative to traditional process due to time influence. It follows that the process is cyclical in time and space. The ratio of innovative and traditional business processes in industrial enterprises can be represented as 2/3: 1/3 due to the progressive development of these organisations. This ratio acts as a catalyst for the economic development of organisations (Karlik, 2013).
The mechanisms consist of innovative business processes, traditional business processes, funds, funds of funds, financial markets, methods of implementation, levers of impact, informational and normative-legal support of individual and public interests (Tucker, 2008; Watts, 1995). As a rule, the development of innovation is characterised by high complexity and requires different views and public recognition. Consequently, the term "innovation" includes new technological, economic, organisational and social solutions which are not necessarily economically relevant with direct monetary dependence but are applicable and used. Therefore, knowledge and ideas are the most critical components of innovation (Juran, 1994; Howlett, 2018).
The innovative product can be considered from two sides: internal where there is a dependence on knowledge, capabilities, resources and technology used as well as external where the interest is focused on the consumer needs and user expectations (Trist & Bamforth, 1951). Taking into account the above factors, we can make the following assumption: the effectiveness and efficiency of the entire company depend on the effectiveness and efficiency of the business processes of the company (Mishchenko, 2009; Mishchenko & Mishchenko, 2015; Mishchenko & Mishchenko, 2016; Mishchenko et al., 2016). This, in its turn, is the achievement of targets that are determined by the requirements of subsequent business processes (Silagadze, 2017; Silagadze,
2018; Atanelishvili & Silagadze, 2018). The achievement of excellent efficiency of business processes in the innovation environment is a tool for improving the competitiveness of the organisation due to the quality increase of all processes and cost reduction ( Kolesnikov et al., 2018; Usenko et al., 2018). In light of these arguments, the key objectives of this research are as follows:
to reveal the particularities of business process modelling;
to reveal the factors that are important in the methodology of correlation and regression analysis;
to choose a linear model based on the importance of regression coefficients, significance of the equations as a whole and coefficient of correlation and autocorrelation of remainings;
to develop an economic-mathematical model of the factors of innovative-active organisations activities; economic-mathematical model of the network of innovative-active organisations based on the resource centre.
The research begins with a brief review of the literature. Following this, it discusses the materials and methods deployed. Moreover, the final sections discuss the findings of the research.
Literature Review
& Jain, 2006). Due to the increased interest in a systematic approach to business process management, many organisations spend significant investment in process modelling, which, in its turn, implement significant research (Grishin, 2019). For example, the Sarbanes-Oxley Act has contributed to the increase of interest in business process modelling as a way of documenting the organisational processes.
The increasing interest in business process modelling and management has led to the creation of a wide range of modelling methods – from simple flowchart methods to methods originally used as a part of software development (such as UML), to highlighting business-oriented modelling approaches (such as event-driven process chains), to formalised and learned methods such as Petri nets and their description languages (Petri, 1962: 386-390). Consequently, a wide range of methods and tools for process modelling is offered in the competitive market. Significant demand for funds was created to evaluate and compare available methods (Scheer, 2000).
Given the interest in the modelling process as a way to cover all the processes of organisations in different areas, and given the many available methods to solve this problem, our interest is to explore different methods of modelling business processes to facilitate the modelling of real-world processes (Burov, 2019). Currently, there is a variety of approaches to the definition of the term "business process" (Kline & Rosenberg, 1986). M. Howlett defines a business process as an organised set of actions included in the activities of the organisation to create a result of value to the client (Howlett, 2018). John Champi characterises a business process as a set of actions that require one or more types of resources and create a result or effect that is of particular value to the buyer (Khamzina, 2017). In these definitions, the predominance of the marketing component in the characteristics of business processes is traced. However, the creation of consumer value directly affects such issues as the acquisition of value-added, the hierarchy of management relations, the specifics of the flows and resources of the organisation
(Standard Flowchart Symbols and their Use in Information Processing, 1970).
Harrison says that the business process consists of procedures, steps, technology and the people needed for conducting essential operations within the company. As a rule, the process intersects with many organisational boundaries within the production activity and requires adjustment of these boundaries. In the definition of Harrison, there dominates the emphasis in the understanding of the organisation as a closed system since the emphasis is only on the "operations within the company (Baboshkina, 2018)." However, in the modern economy of the organisation, it is open systems and reorganisation of business processes of companies that should be focused on the ultimate goal and tied to specific target segments. The noted limitation in the interpretation of the concept of "business process" is overcome in the works of Evstratova and Buribayev (Evstratova et al., 2016; Buribayev et al., 2016). Shorts that indicate that a business process is a mixture of logically related tasks whose purpose is to achieve business results (Juran, 1994). They add that the process has two essential properties(Juran, 1994). The first process includes a buyer; the second business process goes beyond the organisational structures and does not depend on the formal organisational structure of the organization (Apakhayev et al., 2017).
the business process that is called the reproduction process in the company (Abikenov et al., 2019). In the production company, the latter consists of three phases: purchase of all business elements, production and sale (Ibraev et al., 2017). In the market economy, it is impossible to perform all three phases of a business process if these partial processes are not constantly funded (Ibraev et al., 2017). Thus, the financing process is also an integral part of the company's process indicators (Nielsen & Main, 2004).
Business processes are interrelated, consistent, structured outside the functional activities of the organisation with clearly defined start and end points as well as entry and exit (Abramov, 2018). However, the ultimate goal of these transformations remains beyond the vision of scientists and limited only by its phases (Atanelishvili & Silagadze, 2018).
S. V. Rubtsov believes that a business process is a unit of logically related procedures for the implementation and control of a planned product or service. The efficiency of the process can be determined and evaluated as a result of the consumption of resources used to convert the input to the output (Rothwell, 1994).
Thus, foreign and some Russian specialists use in their work the concept of "business process" to a greater extent as a business process (Kolesnikov et al., 2018). Moreover, in their works, they share the concept of "business" and "process"(Karlik, 2013). The second word is used only to separate the processes that are related to the creation of the economic value of the final product (service) from all other processes which operate in the organisation (Howlett, 2013). Any business process can be considered as a system of the interrelated business task, the solution of which is a specific sequence that leads to the output product. The set of tasks of business processes should satisfy the property of completeness, normalisation and connectivity (Narvekar & Jain, 2006).
One has to note, however, that there is no subject (change manager) in the definitions. Nonetheless, we further define the owner of the business process as the Central Administration
that has the resources necessary for the implementation of the business process, who is finally responsible for the final product of the process. It is indicated that the process owner manages the process and is an integral part of the process (Khamzin et al., 2015; Buribayev et al., 2016; Apakhayev et al., 2017; Ibraev et al., 2017; Mukhamadiyeva et al., 2017a; Mukhamadiyeva et al., 2017b; Zhetpisbayev et al., 2017; Bidaishiyeva et al., 2018; Abikenov et al., 2019). Thus, we animate the subject of management, which is included in the set of activities (functions) (Khorin, 2018). In our view, this statement is confusing to some extent. It follows that our manager is identical to a certain technologically fixed management function, which in, its turn, is not so (Kline & Rosenberg, 1986). In turn, we attempt to classify the processes which link them to the organisational structure of the organisation. In our opinion, the way business processes should be organised already determined by those who should implement them (organisational units and divisions) (Abramov, 2016).
Materials and Methods
The theoretical and methodological basis of the research work is the theory of innovation, the theory of organisation management, the theory of innovative development modelling, the theory of process management and related concepts of business processes as well as reengineering. An essential role in understanding the theme of the research was played by modern methods of forecasting economic phenomena and processes and current models of state regulation of the economy (Abramov, 2017).
innovation). The research is based on the application of a set of scientific methods, laws, economic and mathematical analysis, modelling and static and comparative analysis. The interdisciplinary approach takes into account the critical challenges faced by organisations and innovative managers in any economic system. The following sections critically discuss the findings of the research.
Results and Discussion
Modelling of innovation cost parameters is feasible by the methodology of correlation and
regression analysis. First, we will select and analyse the factor particularities included in the multiple regression model. Second, we will check for the presence of multicollinearity.
To check the presence of multicollinearity between the dependent factorial particularities, pair correlation coefficients were calculated. Dependent variables are multicollinear if the pair correlation coefficient between them is greater than or equal to 0.75.
The following formula determines the pair correlation coefficient:
(1)
On Y2 (number of innovative organisations) has a
strong impact X1
(ry2x1/x2,x3,х4,х5,х6,х7,х8=0,873556723753235),
moderate effect is X2
(ry2x2/x1,x3,х4,х5,х6,х7,х8=0,624706858109684), and
the relations between X1 and X2 are weak
(rx1x2/y,x1,x2,х3,х5,х6,х7,х8 = 0,321554072722828).
Therefore, as a pair of factors for the construction of multiple regression, we choose
the process cost-pair Х1 Х2. X1 – technological
product costs of innovation in 2017; X2 –
technological process costs of innovation in 2017. Multiple regression differs from pair regression in the dependent random variable (the resulting variable) y effect at the same time
n independent factor x1,x2,...,xn (Porter & Millar,
1985). The multiple regression equation looks like:
(2)
The correlation coefficient of the relations between y resulting indicator. The correlation coefficient of the ratio between the resulting
indicator j -th ( ) xj factor should be
non-zero: . When testing/hypothesis it
should not be confirmed with P=0,9 probability. Factors x1,x2,...,xn must be pairwise independent.
Multiple regressions were constructed for variables: linear and nonlinear.
Multiple linear regression is the simplest form of multiple dependence. Its equation is written as:
(3)
y is the resulting indicator (dependent variable), – where the independent factor.
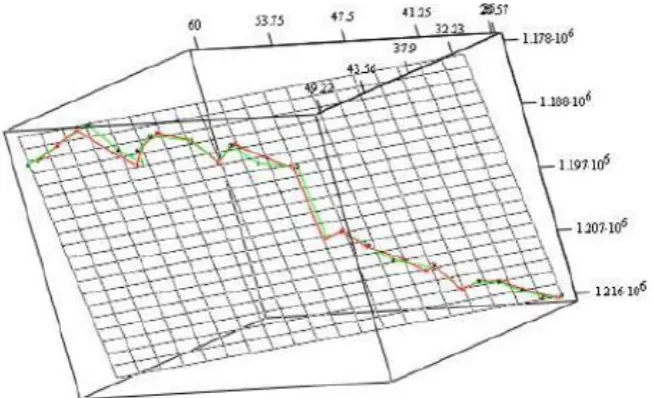
With the help of MS Excel analysis package, multiple linear regression for Y type was built: Y = 305,54+0,012Х1+ 0,001Х2. Coefficient b0=
305,54 the constructed model is not significant, the coefficient of determination R2= 0.98, this
means that the correlation between Y2 resulting
indicator and X1 and X2 factors equals 0.98, and
the average relative error of the approximation is 0.02. When checking the model for autocorrelation, DW=1.654 coefficient was obtained, which indicates the absence of
autocorrelation. Parameter b0= 305,54 shows
the average number of organisations when x1=x2=0. Parameter b1= 0,012 shows that the
number of organisations increases to 0.012 units when the increase of the cost of technological product innovation in 2017 at RUB 1 grocery costs, provided that costs for other types of innovation remain the same. Parameter b2=0.001 shows that the number of
innovation in 2017, 1 RUB is processed costs. This can mean that the size of enterprises is currently suboptimal, and innovation makes them highly productive. The graph of the constructed model is shown in Figure 1.
The Brandon Method was used to construct the multiple nonlinear regression equation.
1. The average value was calculated:
(4)
2. Every I-th observation of yi was transformed by the formula:
(5)
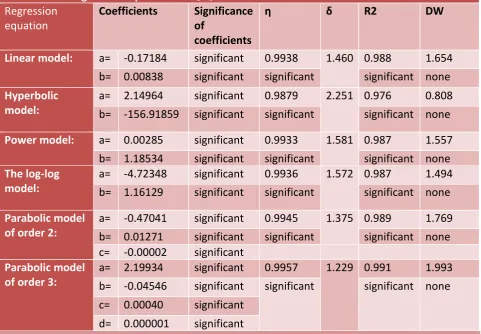
3. For a pair of y0i and xi1 variables as with the pair regression, the type of dependence with the
maximum specification level according to the Durbin-Watson Criterion and the value of the correlation ratio was chosen (Table 1)
(6)
Figure 1: Three-Dimensional Graph of Linear Dependence Y2 from X1 X2
Table 1: Pair Regression Equation for Y2 X1
Regression equation
Coefficients Significance of
coefficients
η δ R2 DW
Linear model: a= -0.17184 significant 0.9938 1.460 0.988 1.654
b= 0.00838 significant significant significant none Hyperbolic
model:
а= 2.14964 significant 0.9879 2.251 0.976 0.808 b= -156.91859 significant significant significant none
Power model: а= 0.00285 significant 0.9933 1.581 0.987 1.557
b= 1.18534 significant significant significant none The log-log
model:
а= -4.72348 significant 0.9936 1.572 0.987 1.494 b= 1.16129 significant significant significant none
Parabolic model of order 2:
а= -0.47041 significant 0.9945 1.375 0.989 1.769 b= 0.01271 significant significant significant none с= -0.00002 significant
Parabolic model of order 3:
а= 2.19934 significant 0.9957 1.229 0.991 1.993 b= -0.04546 significant significant significant none с= 0.00040 significant
d= 0.000001 significant Source: Compiled by the Authors
Taking into account the significance of regression coefficients, the significance of the equation as a whole, the value of correlation
ratio and correlation coefficient (for the linear model) and autocorrelation of residues, we choose a linear model for 2014-15
(7)
Given the importance of the regression coefficients, the significance of the equation as a whole, the correlation coefficient and the correlation coefficient (for the linear model) and
the autocorrelation of the residues, we choose
the linear model for 2014-15 and
(8)
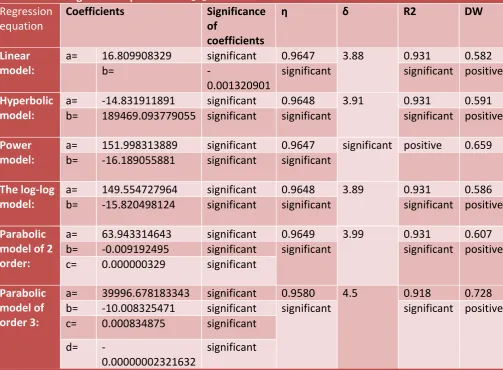
For a pair of y1i and xi1 variables the type of dependence with the maximum specification level was
selected (Table 2):
Table 2: Pair Regression Equation for Y2X2
Regression equation
Coefficients Significance
of
coefficients
η δ R2 DW
Linear model:
a= 16.809908329 significant 0.9647 3.88 0.931 0.582
b=
-0.001320901
significant significant positive
Hyperbolic model:
а= -14.831911891 significant 0.9648 3.91 0.931 0.591 b= 189469.093779055 significant significant significant positive
Power model:
а= 151.998313889 significant 0.9647 significant positive 0.659 b= -16.189055881 significant significant
The log-log model:
а= 149.554727964 significant 0.9648 3.89 0.931 0.586 b= -15.820498124 significant significant significant positive
Parabolic model of 2 order:
а= 63.943314643 significant 0.9649 3.99 0.931 0.607 b= -0.009192495 significant significant significant positive с= 0.000000329 significant
Parabolic model of order 3:
а= 39996.678183343 significant 0.9580 4.5 0.918 0.728 b= -10.008325471 significant significant significant positive с= 0.000834875 significant
d=
-0.00000002321632
significant
Source: Compiled by the Authors
Taking into account the significance of
regression coefficients, the significance of the equation in general, the value of correlation
ratio and correlation coefficient (for the linear model) and autocorrelation of residues, we choose a linear model for 2016-17
(10)
After determining
(11)
a general multiple regression formula is constructed (Table 3):
(12)
Table 3: Multiple Nonlinear Regression Equation for Y2 X1X2
Regression equation
Characteristic Significance of parameters
n Importance δ (%) Importance DW Autocorrela tion
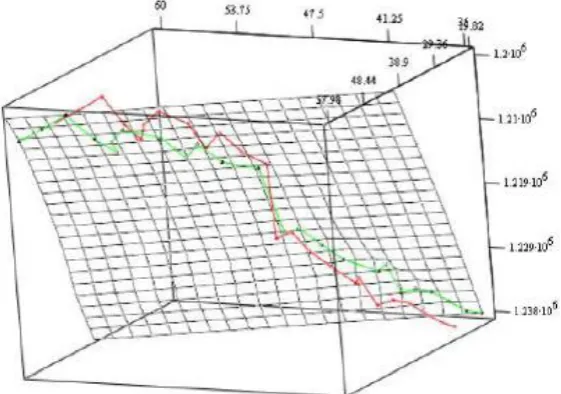
Multiple nonlinear model
-0.17184 Significant 0.23 insignificant 16.8
4%
minor 0.368 positive 0.00838 Significant
The graph of the constructed model is shown in Figure 2.
Figure 2: Three-Dimensional Graph of Nonlinear Dependence Y2 on X1 X2 Source: Built by the Authors using Statistica 6 Software Package
Given the importance of regression coefficients, the significance of the equation as a whole, the value of the correlation ratio and correlation
coefficient (for the linear model) and autocorrelation of residues, we choose a linear model
(13)
Calculate the values and
(14)
For a pair of y1i and xi1 variables, the type of dependence with the maximum specification level was selected:
(15)
Given the importance of regression coefficients, the significance of the equation as a whole, the value of the correlation ratio and the
correlation coefficient (for the linear model) and autocorrelation of residues, we choose a logarithmic model.
~ (16)
After determining
(17)
a general multiple regression formula is constructed:
(18)
Based on the constructed models (linear and nonlinear), the dependence with the highest
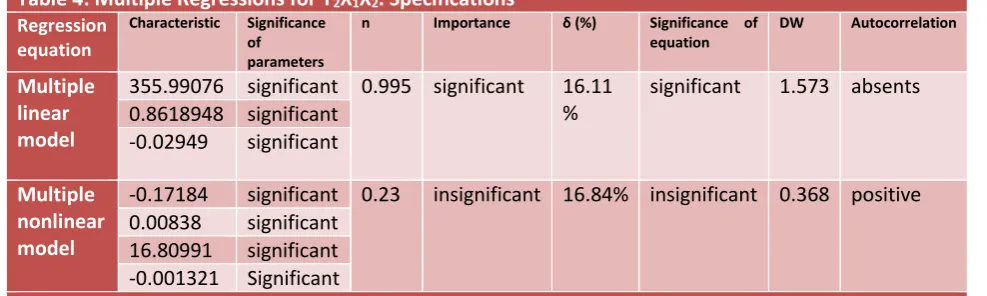
Table 4: Multiple Regressions for Y2X1X2. Specifications
Regression equation
Characteristic Significance of parameters
n Importance δ (%) Significance of equation
DW Autocorrelation
Multiple linear model
355.99076 significant 0.995 significant 16.11 %
significant 1.573 absents 0.8618948 significant
-0.02949 significant
Multiple nonlinear model
-0.17184 significant 0.23 insignificant 16.84% insignificant 0.368 positive 0.00838 significant
16.80991 significant -0.001321 Significant Source: Compiled by the Authors
Based on the constructed models, we can conclude that the linear model is more adequate. This model shows what should be the minimum number of enterprises, namely, the critical mass of industry innovation activity which is necessary to create synergy (common innovation field) and there were cooperative network relations between enterprises based on innovation institutions. Conclusions based on the results of the paragraph are that the key trends in the number of organisations are revealed; it is shown that the trends are multidirectional for the stages of the crisis and the rise as well for the conditions of restrictions of sanctions and import substitution; the conclusion is made about the main trends in the distribution of costs for product innovation and the predominance of technological costs and small costs for marketing and organisational innovation and the cost proportions themselves have not changed in the conditions of increasing crisis.
In the future, the results of the described methodology will be used to predict the parameters of industry innovation development, in particular, to predict the number of innovation-active enterprises and their average value as well as the productivity of activities and to verify the resulting coefficients of the regression equation. However, due to the lack of factual material, we use the same methodology as for large companies because the behaviour of large companies reflects the basic statistical laws.
The following is the allocation of cyclical components to small enterprises to study a cyclical number of small innovation organisations. After identification of the periodic component in the time series and its smoothing, simulation of cyclic oscillations is carried out. There are several approaches to modelling cyclic oscillations. One of them is the calculation of the cyclic component values and the construction of an additive or multiplicative time series model.
The trend-cyclic time series is considered
(19)
for which an additive model of the form is constructed:
(20)
or multiplicative model of the form:
(21)
On ut, it is assumed that this is some smooth function, but the degree of smoothness is unknown in advance. Cyclic component st has a period T0: T0=12 for monthly data and T0=4 for
with time. Otherwise, a multiplicative model is used. Absolute deviations are used as a cyclic component for Sai additive model, for the
multiplicative model is Isi index of cyclicity. In this case, the cyclic component should meet certain requirements:
(22)
(23)
Table 5: Cyclic Component for Additive Model
T 0 m Sai Sai c
1 1.750 0.056
2 2.119 0.425
3 0.060 -1.635
4 2.881 1.187
5 2.190 0.496
6 1.667 -0.028
7 1.976 0.282
8 -0.714 -2.409
T 0 m Sai Sai c
9 2.952 1.258
10 2.143 0.448
11 1.976 0.282
12 1.333 -0.361
∑ 20.333 0.000
Source: Compiled by the Authors
(24)
(25)
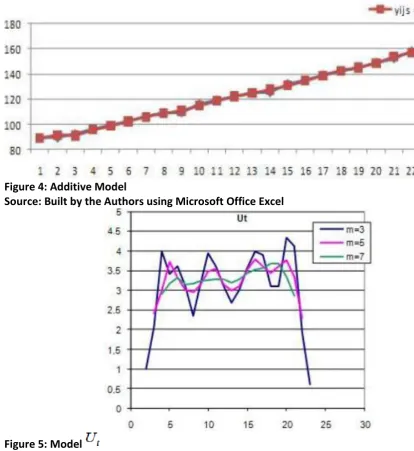
By the nature of changes in the increments, we select the approximating function (Figure 5-7). The amplitude of the cyclic oscillations is constant, so an additive model is chosen. For the
Figure 3: Cyclic Wave for Additive Model
Source: Built by the Authors using Microsoft Office Excel
Figure 4: Additive Model
Source: Built by the Authors using Microsoft Office Excel
Figure 5: Model
Figure 6: Model
Source: Built by the Authors using Microsoft Office Excel
Figure 7: Model
Source: Built by the Authors using Microsoft Office Excel
Since Ut approximately the same, we build a linear model, Ut(2) linearly changes - we
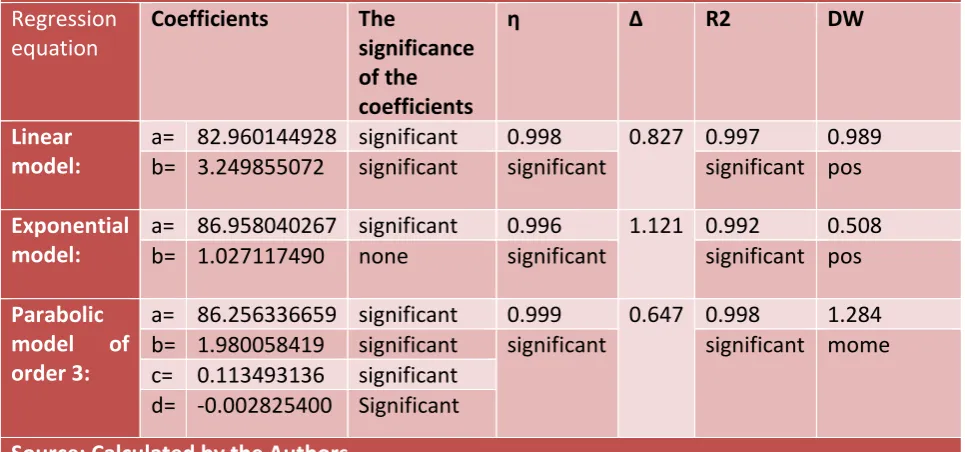
construct a parabola of the third order, approximately the same-we build the exponent. As an approximating function of the trend equation for the construction of an additive model, we choose a parabolic model of the 3rd order according to the specification (Table 6).
Based on monthly data based on the additive model, the linear equation is constructed: y=82.96 + 3.249 t, describing the dependence of change of a number of the organisations in time.
Let us give an interpretation of the trend parameters, b=3,249 is an increase in the number of organisations per unit of time, the parameter a = 82.96 does not make any economic sense.
Table 6. Specification-Based on Additive Trend Model
Regression equation
Coefficients The
significance of the coefficients
η Δ R2 DW
Linear model:
a= 82.960144928 significant 0.998 0.827 0.997 0.989 b= 3.249855072 significant significant significant pos
Exponential model:
а= 86.958040267 significant 0.996 1.121 0.992 0.508 b= 1.027117490 none significant significant pos
Parabolic
model of
order 3:
а= 86.256336659 significant 0.999 0.647 0.998 1.284 b= 1.980058419 significant significant significant mome с= 0.113493136 significant
d= -0.002825400 Significant
Source: Calculated by the Authors
(26)
However, this point forecast estimate is insufficient because f (t) approximating function selected by a limited number of levels of the dynamic series and therefore, contains some randomness and the conditions under which the predicted process develops can change over time.
The features of business processes in the innovative activity of organisations of manufacturing industries (weak identification in the development strategy of domestic corporations of the innovative business process, especially, the distribution of costs for the innovative business process revealed uneven distribution, the specifics of the cost structure in the crisis and the traditional situation, small proportions of financing process innovation.). This allows to determine the parameters of future models of innovation and verify the results of forecasts based on them; a balanced approach to the recommendations (Kryukova et al., 2016; Evstratova et al., 2016).
Conclusion
The central aim of this research had been to provide innovative processes in the economic development of the Republic of Tatarstan. To accomplish this, the research developed an
economic and mathematical model of factors of activity of innovative-active organisations; model of forecasting the number of innovation-active organisations of manufacturing industries of the Republic of Tatarstan; economic and mathematical model of the network of innovative-active organisations based on the resource centre. Based on the analysis of the distribution of costs between technological, marketing and organisational innovation by types of innovation and economic activities by building an adequate set of statistical models, we have identified the following particularities: the basic internal (directly dependent) and external (indirectly affecting) factors that affect the selected performance characteristics. In order to identify the relations between the cost indicators, modelling and correlation and regression analyses were carried out.
checked. We analysed the relations between the resulting and independent variables (autocorrelation, cyclical and trend) indicating the dependencies in the business processes of innovation.
After analysing the main parameters of innovative organisations and identifying the factors of their mutual impact, the next step was to consider the model of the number of innovative-active organisations as a necessary condition for improving the efficiency of innovation. As a result of modelling the number of innovative-active organisations of the Republic of Tatarstan, there were found significant variables, and the presence of cyclicity was determined. Based on the time series, the number of innovative organisations is predicted.
In order to implement the information support of decision-making management, we have developed an economic and mathematical model of the network of innovative-active organisations based on the industry resource centre. Besides, in the development of the theory of innovation management, we proposed to improve the model of an innovative business process by taking into account the actual phenomenon of the resource centre for the Russian industry, namely, a new model of the Institute of Innovative Development. The existing models are focused mainly on the micro-level, for the Russian conditions, it is somewhat risky and does not always allow to implement the principle of convergence in interaction with the external environment. An economic and mathematical model of factors of activity of innovative-active organisations was developed; model of forecasting the number of innovative-active organisations of manufacturing industries of the Republic of Tatarstan; economic and mathematical model of the network of innovative-active organisations based on the resource centre.
References
Abikenov, A., Idrysheva, S. K., Zharbolova, A. Z., Apakhayev, N., Buribayev, Y. A., & Khamzina, Z. A. (2019). The problems of effectiveness and implementation of the international
legal norms of the states of the Eurasian Economic Union (EAEU). Bulletin of the
Georgian National Academy of Sciences, 13(1), 175-181.
Abramov, R. A., Sokolov, M. S. (2017). Current challenges and competitive advantages of national innovation systems (NIS) of the countries-participants of the union state up to 2030. Journal of Advanced Research in
Law and Economics, 8(4), 1031-1039.
Abramov, R. A., Tronin, S. A., Brovkin, A. V., Pak, K. C. (2018). Regional features of energy resources extraction in Eastern Siberia and the Far East. International Journal of Energy
Economics and Policy, 8(4), pp. 280-287.
Apakhayev, N., Koishybaiuly, K., Khudaiberdina, G., Urisbayeva, A., Khamzina, Z. A., &
Buribayev, Y. A. (2017). Legal basis for ensuring freedom of access to information on the operation of state administration bodies in Kazakhstan. Journal of Advanced
Research in Law and Economics, 8(3),
722-729.
Atanelishvili, T., & Silagadze, A. (2018).
Formation of economic views in the ancient era. Bulletin of the Georgian National
Academy of Sciences, 2(1): 191-196.
Baboshkina, A. A., Savina, N. P., Morozov, I. V. (2018). Management processes in the development of the socio-economic environment of the region, Journal of
Advanced Research in Law and Economics, 9(2), 376-385.
Bidaishiyeva, A., Nadirova, K. K., Kuldinova, S., Apakhayev, N., Khamzina, Z. A., & Buribayev, Y. A. (2018). Improving quality of legal
regulation for social rights of family and child within new social course in the Republic of Kazakhstan. Journal of Legal, Ethical and
Regulatory Issues, 21(1),
1544-0044-21-1-165.
Boltochko, P. (2018). Customs code of the Eurasian Economic Union: The basis of customs relations. Intellectual Economics,
12(1), 5-15.
Buribayev, Y. A., Mukaldyeva, G., Nurahmetova, G. G., Uteyev, B., Nessipbekov, Y., &
Republic of Kazakhstan: Main directions, conditions for implementation and development prospects. International
Journal of Environmental and Science Education, 11(18), 11611-11619.
Burov, A. G., Agüero, D. (2019). Implementation of the principles of innovative
entrepreneurship in the field. Academy of
Entrepreneurship Journal, 25(1S), 1-5.
Evstratova, T., Shalashnikova, V., Starostenkov, N., Nakhratova, E., Zotova, A., & Ziroyan, M. (2016). Practical aspects of volunteer
movement development in Moscow.
Research Journal of Pharmaceutical,
Biological and Chemical Sciences, 7(3),
2073-2081.
Howlett, M. (2018, 25 May). Moving Policy Implementation Theory Forward: A Multiple Streams/Critical Juncture Approach. Public
Policy and Administration. Retrieved on 12
March 2019 from,
https://journals.sagepub.com/doi/full/10.11 77/0952076718775791
Grishin, V. I., Abramov, A. R., Sokolov, M. S. (2019). Implementation of international experience in support of youth innovative entrepreneurship in the union state.
Academy of Entrepreneurship Journal, 25(1S), 1-5.
Ibraev, Z. G., Yerkebaeva, N. A., Mirzakulova, B. A., Nazarkulova, L. T., Buribayev, Y. A., & Khamzina, Z. A. (2017). Social rights, family and child guarantees in the context of the implementation of a new social course in the Republic of Kazakhstan. Journal of Legal,
Ethical and Regulatory Issues, 20(1),
1544-0044-20-1-128.
Jablonskis, A., Petersone, M., Ketners, K. (2018). Insights into the definition of customs
logistics. Intellectual Economics, 12(1), 16-33. Juran, J. (1994). Managerial Breakthrough: The
Classic Book on Improving Management Performance, 30th Anniversary Edition.
Canada: Published by McGraw-Hill Ryerson: Whitby.
Karlik, M. (2013). Managing Innovation in
Enterprise. Exploration and Implementation of Innovative projects. Poland: Poltext.
Khamzin, A. Sh., Khamzina, Zh. A., & Buribayev, Y. A. (2015). The decent work programme of Kazakhstan: Social and labor rights
protection from an institutional aspect of international law. Journal of East Asia and
International Law, 8(2), 539-540.
Khorin, A. N., Potanina, Y. M., Brovkin, A. V. (2018). Management Economic Environment of Non-profit Organizations. Journal of
Advanced Research in Law and Economics, 9(2), 522-532.
Kline, S., & Rosenberg, N. (1986). An Overview of Innovation. The Positive Sum Strategy.
Harnessing Technology for Economic Growth, 21(4), 275-305.
Kolesnikov, Yu. A., Pavlyuk, A. V., Radachinsky, Yu. N., & Rodionova, N. D. (2018). Problems of implementation of public-private
partnership in Russia. European Research
Studies Journal, 21, 187-197.
Koshkin, A.P , Abramov, R. A., Rozhina, E. Y., Novikov, A. V. (2018). Role of social representations in student motivation for acquiring further education. Interchange, 49(3), 313–341.
Kryukova, E., Vinichenko, M., Makushkin, S., Melnichuk, A., Bondaletov, V., & Potekhina, E. (2016). On sustainable economic
development of the mono town of Baikalsk.
International Journal of Economic Research, 13(6), 2409-2424.
Laurinavičius, A. (2018). Administrative discretion assumptions in developing customs logistics. Intellectual Economics,
12(1), 34-46.
Mishchenko, S. V. (2009). Financial crisis influence upon realization of monetary policy by central banks. Actual Problems of
Economics, 9(99), 209-218.
central banking. Actual Problems of
Economics, 176(2), 266-272.
Mishchenko, S. V., Naumenkova, S. V., & Lon, I. M. (2016). Monetary cycles in the economy of Ukraine. Actual Problems of Economics,
185(11), 363-372.
Mishchenko, V. I., & Mishchenko, S. V. (2015). Enhancing the effect of transmission channels in monetary policy of Ukraine under the transition to inflation targeting.
Actual Problems of Economics, 163(1),
421-428.
Morozov, I. V., Potanina, Y. M., Voronin, S. A., Kuchkovskaya, N. V., Siliush, M. D. (2018). Prospects for the development of the oil and gas industry in the regional and global economy. International Journal of Energy
Economics and Policy, 8(4), 55-62.
Mukhamadiyeva, G. N., Kussainova, A. K., Baisalova, G. T., Apakhayev, N., Khamzina, Z. A., & Buribayev, Y. A. (2017a). Labour law of the modern Kazakhstan. Journal of Legal,
Ethical and Regulatory Issues, 20(1),
1544-0044-20-1-129.
Mukhamadiyeva, G. N., Mukaldyeva, G.,
Karasheva, Z. T., Khamzin, A. S., Buribayev, Y. A., & Khamzina, Z. A. (2017b). Modernization of social security system legal regulation in Kazakhstan: Experience and standards of the OECD members implementation. Journal of
Advanced Research in Law and Economics, 8(8), 2498-2503.
Narvekar, R. S., & Jain, K. A. (2006). New
Framework to Understand the Technological Innovation Process. Journal of Intellectual
Capital, 7(2), 174-186.
Nielsen, P., & Main, C. (2004). Company Liability after the Sarbanes-Oxley Act. Insights,
10(18), 2-12.
Petri, C. A. (1962). Fundamentals of a Theory of Asynchronous Information Flow. In IFIP
Congress 62: Information Processing (pp.
386-390). Munich. Germany: North Holland.
Porter, M., & Millar, V. (1985). How Information Gives You Competitive Advantage. Harvard
Business Review, 63(4), 149-160.
Rothwell, R. (1994). Towards the Fifth
Generation Innovation Process. International
Marketing Review, 11(1), 7-31.
Scheer, A. W. (2000). ARIS - Business Process
Modeling, 3rd edition. Germany: Springer.
Silagadze, A. (2017). History of Georgian economic thought: Relation between the center and the region. Bulletin of the
Georgian National Academy of Sciences, 11(4), 138-144.
Silagadze, A. (2018). Some aspects of economic ideas in Shota Rustaveli’s “the knight in the panther skin”. Bulletin of the Georgian
National Academy of Sciences, 12(1),
161-167.
Standard Flowchart Symbols and their Use in Information Processing. (1970). American National Standards Institute. New York. Retrieved on 15 March 2019 from, http://www.conceptdraw.com/How-To-Guide/flowchartsymbols.
Trist, E., & Bamforth, K. (1951). Some Social and Psychological Consequences of the Longwall Method of Coal-Getting: An Examination of the Psychological Situation and Defences of a Work Group in Relation to the Social
Structure and Technological Content of the Work System. Human Relations, 4(1), 3-38.
Tucker, R. (2008). Transforming Their Futures
(Business). USA: Berrett-Koehler Publishers.
Usenko, L. N., Bogataya, I. N., Bukhov, N. V., Kuvaldina, T. B., & Pavlyuk A. V. (2018). Formation of an integrated accounting and analytical management system for value analysis purposes. European Research
Studies Journal, 21, 63-71.
VoLodzkienė, L. (2018). The diversity of material living conditions (housing inequality):
Lithuanian case. Intellectual Economics,
12(1), 59-72.
Watts, J. (1995). An Introduction to Holistic BP.
Zhetpisbayev, B. A., Baisalova, G. T., Shadiyev, K. K., Khamzin, A. S., Buribayev, Y. A., & Khamzina, Z. A. (2017). Legal support of the process of Kazakhstan accession to the OECD: Potential for improving quality of
individual’s labour rights regulation. Journal