R E S E A R C H
Open Access
Image segmentation based on fuzzy
clustering with cellular automata and
features weighting
Chengfan Li
1,2*, Lan Liu
3, Xiankun Sun
1,3, Junjuan Zhao
1and Jingyuan Yin
4Abstract
Aiming at the sensitivity of fuzzy C-means (FCM) method to the initial clustering center and noise data, and the single feature being not able to segment the image effectively, this paper proposes a new image segmentation method based on fuzzy clustering with cellular automata (CA) and features weighting. Taking the gray level as the object and combining fully the image feature and the spatial feature weighting and FCM, this paper quickly realizes the fuzzy clustering of the images segmentation by the CA’s self-iteration function and finally discusses the effectiveness and feasibility of the proposed method in long-term sequences satellite remote sensing image segmentation. Our experiments show that the proposed method not only has fast convergence speed, strong anti-noise property, and robustness, but also can effectively segment common images and long-term sequence satellite remote sensing images and has good applicability.
Keywords:Cellular automata (CA), Features weighting, Fuzzy clustering, Image segmentation, Satellite remote sensing
1 Introduction
In recent years, as an important technology of pattern recognition and computer vision, image segmentation has been focused by researchers all over the world [1–3]. The image segmentation types can be divided into four categories from different angles, such as feature space clustering, edge-based, region-based, and model-driven [4, 5]. At present, the feature space clustering method (e.g., K-means clustering method) is the most popular image segmentation method due to the simple principle, easy calculation, and good segmentation effect.
The cellular automata (CA) are a dynamic model in which the object’s time, space, and state are discrete. It has powerful parallel computing ability and high dy-namic and space concept and can effectively simulate the spatiotemporal dynamic evolution process of com-plex system [6,7]. Since the introduction of CA concept in the late 1940s, it has been widely used in traffic prob-lems, population migration, environmental monitoring, etc. [8–11]. However, its application in the field of image
processing is still less, and the achievements are still in-adequate [12]. Feature weighting is completely different from the traditional idea of image classification [13]. In the conventional image classification methods, multiple image features are treated in the same way and have equal importance. However, the actual situation is that not every contribution of image feature is the same to the image classification, that is, feature weighting [14,15]. Fuzzy C-means (FCM) can realize image segmentation by maxi-mizing the similarity among objects divided into the same cluster and minimizing similarity among the different clus-ters. It has the characteristics of simple calculation and fast speed and is able to effectively overcome the uncertainty and ambiguity in image processing [16–19]. What is more, due to the similarity of the gray level among the image regions and the sensitivity of FCM to the sample data, when the im-ages is segmented only by a single FCM method, it is easy to get trapped in a local optimum, the boundary is blurred and it shows the untidy boundaries and the poor visual effect.
Work in this study is focused on the image segmentation algorithm based on fuzzy clustering with CA and features weighting. The rest of the paper is constructed as follows: Section2describes the proposed method. Section3presents the experiments of our study including resolutions, efficiency, and anti-noise property. Section 4devotes and explores the * Correspondence:[email protected]
1
School of Computer Engineering and Science, Shanghai University, 711 Computer Building, Shanghai 200444, People’s Republic of China
2Shanghai Institute of Advanced Communication and Data Science,
Shanghai University, Shanghai 200444, People’s Republic of China Full list of author information is available at the end of the article
satellite remote sensing image segmentation by the proposed method. Finally, conclusions are drawn in Section5.
2 Proposed method 2.1 Basic theory
(1) CA model
Corresponding to the digital image, each image pixel can be regarded as a cell in CA model, and then the entire image is a cell space. It often contains cell space, cell state, cellular neighbor, and evolutionary rule. Cellular neighbor can be defined as a cell adjacent to a cellular in space, and the re-gion composed of all neighboring cells is called its neighbor-hood. Evolutionary rule means the rules that determine the cell’s state at the next moment according to the current cell and its neighborhood and further update and evolve by the interaction among cells. Sometimes, it is also called state transfer function and is the key to the whole CA model.
(2) Feature weighting
Color features are less affected by image size, orientation, and viewing angle and have strong robustness and objectiv-ity. At present, it has been widely applied in image process-ing. And color features are usually represented by a color histogram.
The detail process could be described by the following:
qcb¼ XBc
b¼1
δðI xð ;yÞ−bÞ ð1Þ
where q is color histogram; I(x,y) is the pixel point of the coordinate(x,y); Bc is the interval number of the
color histogram; b is constant, b = 1, 2, …, n; and the similarity measure is Bhattacharyya distance.
Spatial histogram contains the mean value and covari-ance of each pixel in the regional space, which can ef-fectively supplement the spatial distribution information
of missing pixels in the color histogram. The similarity measure of spatial histogram can be calculated by:
ρ psb;qsb
¼XB b¼1
φbρn nb;nb 0
ð2Þ
where the weighted value φb is the spatial similarity,
φb¼ηexpf−12ðμb−μb‘Þ TP−1
b ðμb−μb‘Þg, nb is the total
number of pixels in the interval, si is the coordinate
of pixel point i, η is the normalized constant,ρn(nb,nb') is
the similarity of different intervals of the spatial histogram,
andρnðnb;nb 0
Þ ¼ ffiffiffiffiffiffiffiffinbnb0
p
ffiffiffiffiffiffiffiffiffiffiffiffiffiffiffiffiffiffiffiffiffiffiffiffiffiffiffiffiffiffiffiffi
ðX
Bc
j¼1 njÞð
XBc
j¼1 nj 0 Þ v u u t .
(3) FCM method
FCM is an unsupervised fuzzy clustering method based on objective function optimization [20, 21]. Sup-posed that the imageX= {x1,x2, …,xn} is a collection of
n pixels, xjis the eigenvalue of the image pixel, c is the
number of categories, and V= {v1,v2, …,vc} is the
clus-ter cenclus-ter collection. Let objective functionJmsatisfy the
constraintPCi¼1uij¼1ðuij∈½0;1Þ:
Jm¼ Xc
i¼1
Xn
j¼1
umijd2 xi;vj
ð3Þ
whereuijis the membership of thej-th sample and the i
-th category; m is the weighted index, and usually m= 2; andd2(xj,v) = ||xj−vi||2is the Euclidean distance from the
sample pointxjto the cluster centervi.
The objective function J is the sum of squares of the weighted distances from the image pixel points to the respective cluster centers. The smaller the value, the closer the pixel points are to cluster center, and the bet-ter the clusbet-tering effect is [22–26].
2.2 Proposed method based on fuzzy clustering with CA and features weighting
(1) Enhancement and extraction of subject area by CA model
Firstly, expand the binary image to a grayscale image. The grayscale value of the image pixel is extended from 0 to 255 (namelyL= 256), and correspondingly, the CA model is also extended from the binary state to the multi-value state.
Secondly, define the cell as the gray level of the image to be separated. The basic idea is to keep the pixel values of the boundary region constant, and the pixel value of the image’s uniform region gradually approaches 0 in-stead of being directly equal to 0.
Thirdly, continuously update the state of the central cell, improving the classification accuracy of the central cell and further enhancing the contrast of image. And the calculation process can be described as the follow-ing: whenθt(p)≤θmax−θmin, the resultθt(p) is regarded
as the result θt+ 1(p), that is, θt+ 1(p) =θt(p). Otherwise,
θt+ 1(p) =θmax−θmin, where θmaxand θmin are the
max-imum and minmax-imum values of cell morphology in its neighborhood at timet, respectively.
(2) Segmentation based on fuzzy clustering by feature weighting
The membership function in FCM only describes the similarity measure between the intensity feature and the cluster center and does not consider the spatial feature among the pixel points [27–29]. To overcome the limita-tion, according to the contribulimita-tion, the color features and
spatial features are assigned separately different weight values in this study, and further fused in terms of the cer-tain rules.
Let n features conditionally independent, then a uni-form distribution is added to the observed probability values of each feature and finally taken their product after the normalization. The detail calculation equation can be shown below:
p z 1⋯znjx¼Y
n
1
p zð ijxÞ þβiU xð Þ 1þβi
ð4Þ
where βi is the uncertainty of i, U(x)is the discrete uni-form distribution,nis the number of image features.
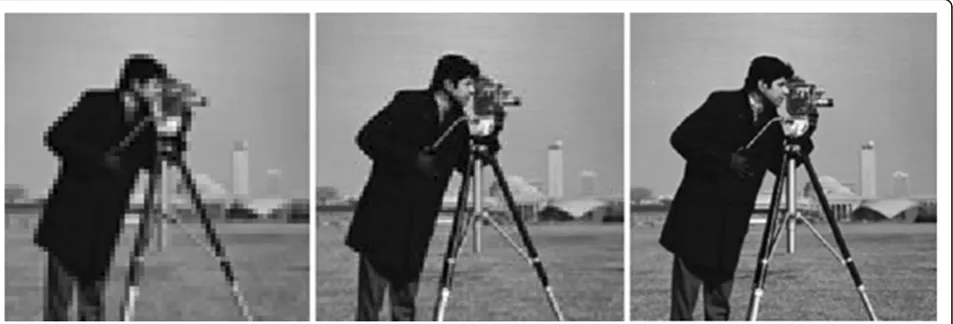
Fig. 2Segmentation results on Photographer images with resolutions (the left is the 64×64 image, the middle is the 128×128 image, and the
right is the 256×256 image)
Table 1Consuming time of different resolution images in Fig.1
Image resolution Consuming time (s)
Left 64 × 64 24.5
Middle 128 × 128 43.6
Next, the corresponding weight values are assigned to different features, and then the new comprehensive fea-ture of the image can be described according to the fol-lowing equation:
T¼½α•T1;β•T2 ð0≤α≤1;0≤β≤1Þ ð5Þ
whereTis the comprehensive feature of the image;T1and
T2represent color feature and spatial feature, respectively;
and α and β are the weight values of color features and
spatial local feature, respectively. In this experiment,αandβ represent the 10 decimals (0.1, 0.2,…, 1.0) between 0 and 1, respectively, and each image feature is described by the new comprehensive features obtained from weighted fusion.
Finally, the segmentation experiment based on fuzzy clus-tering is performed on the enhanced image. The member-ship function of fuzzy clustering and cluster center in FCM is continuously updating with the comprehensive weighting features, and finally, the high-precision image segmentation is realized.
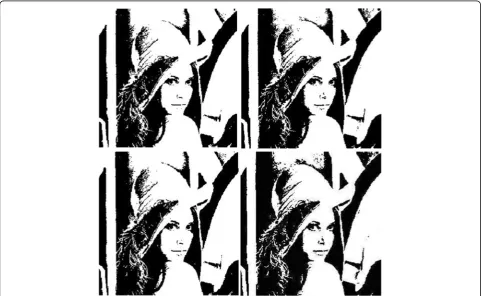
Fig. 4Convergence curves
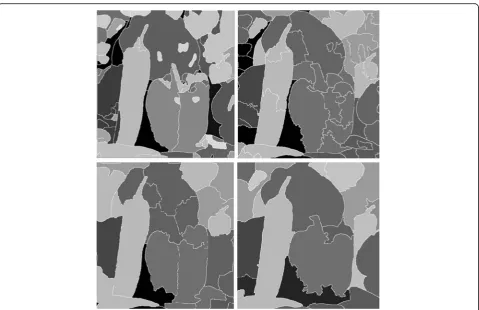
Fig. 5Lena image segmentation results (the upper left is the proposed method, the upper right is the FCM method, the lower left is K-means
3 Experiments
In this section, the validity and feasibility of the proposed algorithm is evaluated from the points of different resolu-tions image, segmentation results and efficiency of the dif-ferent algorithm, and anti-noise ability. The experimental data tested in the study are selected from the Berkeley image segmentation dataset. Test experiments are per-formed on PC with Intel (R) Core (TM) [email protected] GHz CPU and 4GB memory in MATLAB R2009a environment.
3.1 Segmentation experiments with different image resolution
Taking the three photographer images with different resolution as the test images, the image segmentation is performed by the proposed fuzzy clustering image seg-mentation method based on fuzzy clustering with CA and feature weighting and then further recorded the cor-responding segmented time. In this test, the specific pa-rameters of the setting environment include that the
number of clusters is 3, the fuzzy weighting index is 2, the gray level of the test image is from 0 (the darkest) to 255 (the brightest), and the iteration threshold is 10−5.
Figure 1 shows the photographer images with reso-lution 64 × 64, 128 × 128, and 256 × 256, respectively.
As can be seen from Fig.1, with the decrease of the image resolution, the image clarity gradually decreases. Meanwhile, the visual effect also gradually degraded. Figure2shows the detailed segmentation results of photographer images with different image resolutions. Table1shows the detailed con-suming time by the proposed method to segment the above three photographer images, respectively.
It can be clearly seen from Table1that the consuming time taken by the proposed method rapidly decreases with the decreases of the image resolution, and the seg-mentation speed is also gradually getting faster and the operation effect is better. This is mainly because the pro-posed method makes full use of image color features and spatial features. The method can enhance the image object’s brightness and greatly accelerate the calculation speed by weighting features and CA’s self-iteration and further sig-nificantly improve the image segmentation efficiency.
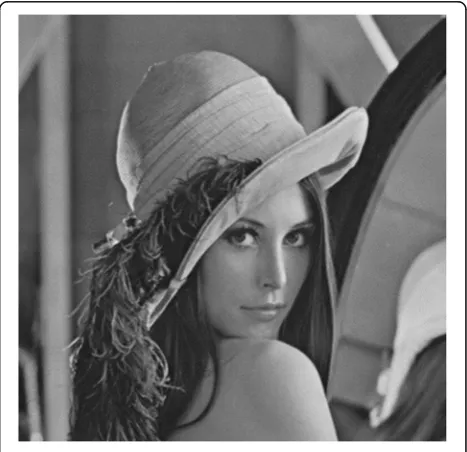
3.2 Segmentation results and efficiency of different algorithm
Taking Lena image (see Fig.3) as the data source, the FCM, K-means, and kernel fuzzy C-means (KFCM) [30–32]
Table 2Consuming time comparison of different methods
Methods Number of iterations Consuming time (s)
Proposed method 52 19.88
FCM 125 47.85
K-means 102 35.84
KFCM 74 26.98
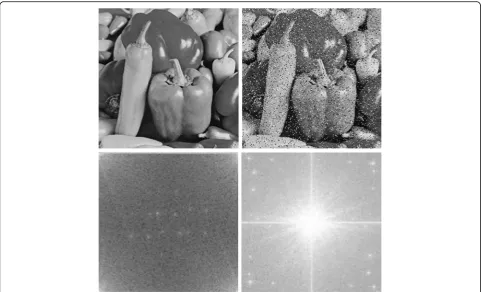
Fig. 6Peppers test images (the upper left is the original peppers’image, the upper right is the noisy image, the lower left is the frequency spectrogram of
methods were introduced in the experiment to discuss and analyze the segmentation performance. Figure4shows the convergence curve obtained by the above several methods in the experiment.
As can be seen from Fig.4, the above four methods can converge and get the global optimal solution after 15 times iterations. Among them, the segmentation effect of proposed method is stable, and the image quality is good. The function value of Lena is less than 0.12, which is lower than FCM, K-means, and KFCM methods. In order to save time and improve operating efficiency, the pro-posed method in this study can get good image segmenta-tion results when the number of iterasegmenta-tions is 15 times. The segmentation result of Lena image is shown in Fig.5.
As can be seen from Fig.5, the four methods basically implement the segmentation of Lena image. Whereinto, the proposed method not only effectively eliminates
some independent plaque information, but also signifi-cantly improves the segmentation image quality and has better robustness. The visual effect of segmentation image is obviously better than by other methods. In addition, the segmentation images by FCM, K-means, and KFCM methods have discontinuous edge points. That is, some independent plaque and points are regarded as edge information was extracted, and to blur the image edges, it cannot detect the complete edge in-formation due to the serious misclassification. In con-trast, the image enhancement can be performed by the proposed method with CA and feature weightings, and it can get better segmentation image.
Table 2shows the comparison of the consuming time between the proposed method and other three methods. In order to avoid contingency, the iteration number and consuming time in Table 2 have employed the average value of 20 times experiments in the test.
As can be seen from Table 2, the average consuming time of FCM, K-means, and KFCM reached 47.85 s, 35.84 s, and 26.98 s respectively. Compared to the above three methods, the average consuming time of the pro-posed method in this study is relatively small and is only with 19.88 s. This is mainly because the FCM, K-means, and KFCM methods have to run 125, 102, and 74 times
Fig. 7Peppers image segmentation results (the upper left is the propose method, the upper right is the FCM method, the lower left is K-means
method, and the lower right is the KFCM method)
Table 3Performance evaluation of different methods
Method PSNR CPU consuming time (s)
Proposed method 22.52 12.55
FCM 18.75 25.63
K-means 17.42 21.08
iterations to converge respectively and increase the com-putation time to some extent with the same cluster center number. However, the proposed method can realize con-vergence based on 52 times of iterations and greatly accel-erates the computation speed. Therefore, in the case of the same number of experiments, the proposed method in this paper can significantly reduce the number of iteration times and speed up the image segmentation.
3.3 Anti-noise property analysis
In the experiment, taking the Peppers image as the data source, the salt-pepper noise with density of 0.1 was added to the source image to analyze the anti-noise property of proposed method. Figure 6 shows original Peppers image, noisy image, and the corresponding frequency spectrogram.
It can be seen from Fig. 6, the coordinate origin is in the upper left corner of the window, the high frequency components are distributed in the middle of window, and the low frequency components are distributed on the four corners of the window. In contrast, in the fre-quency spectrogram of noisy image, the coordinate ori-gin moves to the central portion of the window, the low frequency component is distributed around the coordin-ate origin and high frequency component in the periph-eral region, and it is also shown in Fig.6.
Subsequently, the Peppers noisy image was tested by the segmentation methods and the results are shown in Fig.7.
It can be clearly seen from Fig. 7 that the traditional FCM and K-means methods were obviously interfered by the noise information. This is because the back-ground information in the images was mixed with noises, which affected the features of the obtained im-ages and led to the obvious misclassifications, and re-sulted in the poor segmentation effect. In contrast, KFCM method can reduce the influence of the noise by introducing the kernel function and improve the image segmentation effect. In this paper, the proposed method finally realizes the image segmentation based on fuzzy clustering by the CA and image color-spatial feature weighting, eliminates the influence of partial noise on image quality to some extent, and further enhances the anti-noise property and robustness.
In addition, to quantitatively evaluate the anti-noise property of proposed method, the peak signal to noise ratio (PSNR) and consuming time of CPU are intro-duced to evaluate the segmentation results. The results are shown in Table3. For PSNR, thresholds that are too large and too small are not suitable for de-noising. In our experiment, when the threshold finally was chosen as 0.5 after many tests, the image not only has less re-sidual noise but also the edge texture is well protected.
As can be seen from Table3:
(1) From the perspective of PSNR, the PSNR value of proposed method reached 22.52, which is followed by the
Fig. 8MODIS preprocessing image (the left is the April 19, 2010, image, and the right is the May 11, 2010, image)
Fig. 9Volcanic ash cloud segmentation results by the proposed method (the left is the April 19, 2010, image, and the right is the May 11,
KFCM method, and the FCM and K-means methods have the smallest ones. It indicates that the proposed means has the best anti-noise property and the best image seg-mentation quality, followed by the KFCM method, while the traditional FCM and K-means methods have the rela-tively poor anti-noise property.
(2) From the perspective of CPU consuming time, the overall change is consistent with the PSNR’s. The proposed method takes the least time and reached 12.55 s, which is followed by KFCM and reaching 18.4 s, while the FCM and K-means methods are time-consuming and relatively com-putationally inefficient.
(3) In terms of comprehensive PSNR and CPU con-suming time, the proposed method is superior to the other methods. It has not only high anti-noise property and image quality, but also less time-consuming and relatively higher segmentation efficiency, and can quickly realize high-precision image segmentation based on the fuzzy clustering by the CA and image color-spatial fea-ture weighting.
4 Results and discussion in satellite image segmentation
In this section, taking moderate resolution imaging spectro-radiometer (MODIS) satellite remote sensing image as the data source, we used the images on 19 April 2010 and 11 May 2010 to segment the volcanic ash cloud information by proposed image segmentation method which is based on fuzzy clustering by the CA and image color-spatial fea-ture weighting.
The MODIS sensor was mounted on the Terra/Aqua satellite and successfully launched on December 18, 1999. It has a total of 36 discrete bands, and the spatial resolution is 250 m, 500 m and 1000 m; the maximum scan width is 2330 km. The data preprocessing mainly includes geometric correction, striping processing, and cropping. The preprocessing is programmed and imple-mented on ENVI 4.6 software, and the preprocessing MODIS image of Eyjafjallajökull volcanic ash cloud is shown in Fig.8.
4.1 Image segmentation results of volcanic ash cloud
Next, the MODIS images of long-term sequence vol-canic ash cloud on 19 April 2010 and 11 May 2010 were implemented in this study by the proposed image seg-mentation method based on fuzzy clustering by the CA
Table 4Accuracy evaluation of MODIS image
Time Total precision (%) Kappa coefficient
April 19, 2010 87.50 0.8014
May 11, 2010 89.25 0.8154
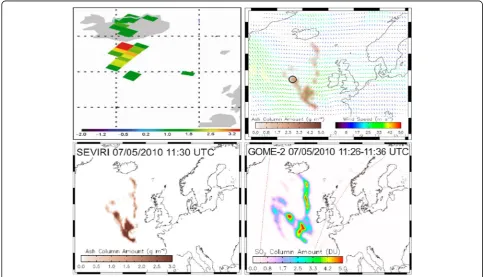
Fig. 10Related research results (the upper left is the AAI of Eyjafjallajökull volcanic ash cloud on 19 April 2010, the upper right is the
and image color-spatial feature weighting in this study, and the segmentation results are shown in Fig.9.
It can be clearly seen from Fig.9 that the Eyjafjallajö-kull volcanic ash cloud distribution of long-term se-quence on 19 April 2010 and 11 May 2010 was accurately identified by the proposed image segmenta-tion method. And what is more, the image quality and the visual effect of the segmented volcanic ash cloud are good; meanwhile, the broken spots are fewer. However, the proposed image segmentation method has certain disadvantage, such as the scope of identified volcanic ash cloud is very narrow; it is also shown in Fig.9. This is mostly because of the ignored weak information of volcanic ash cloud in the fuzzy clustering with CA and features weighting.
4.2 Discussions
(1) Thematic information extraction of volcanic ash cloud In this section, the 500 proofreading data points were randomly generated in the experiment and the perform-ance of volcanic ash cloud segmentation was evaluated by confusion matrix method. The accuracy evaluation of MODIS image segmentation is shown in Table4.
Table4depicts the accuracy evaluation of MODIS sat-ellite remote sensing images by proposed method in this study, and it clearly shows that the proposed image seg-mentation method based on fuzzy clustering by the CA and image color-spatial feature weighting has achieved a good identification of Eyjafjallajökull volcanic ash cloud from the long-term sequence satellite remote sensing images. The total accuracy of volcanic ash cloud seg-mentation on 19 April 2010 and 11 May 2010 reached 87.50% and 89.25% respectively, and the Kappa coeffi-cient reached 0.8014 and 0.8154, respectively. This is also consistent with the above volcanic ash cloud seg-mentation results (Fig. 9). The volcanic ash cloud from long-term sequence satellite images segmented by the proposed method does not show obvious fragmentation and misclassification, and the segmentation image qual-ity is good. That is, the proposed method in this study basically achieves better segmentation accuracy and vis-ual effects in different development stages of the typical Eyjafjallajökull volcanic ash cloud case.
(2) The existing research results
In view of the huge impact of the Eyjafjallajökull vol-canic ash cloud in April–May 2010, many researchers and institutes have tracked and predicted the eruption and diffusion of volcanic ash cloud [33,34] and achieved many meaningful results which contain aerosol absorp-tion index (AAI), 500 hpa height analysis data over the North Atlantic, spatial distribution, and SO2distribution
(Fig. 10). Especially, the AAI and SO2 distribution are
often referred to as the indicators of volcanic ash cloud identification.
It can be seen from Fig.10that volcanic ash cloud dis-tribution segmented by proposed method from long-term sequence satellite remote sensing images is basically con-sistent with the existing research results and the relevant information released by the Volcanic Ash Advisory Centre (VAAC). It partially indicates that the proposed image seg-mentation method based on fuzzy clustering by the CA and image color-spatial feature weighting is effective and feasible in satellite remote sensing image segmentation at various stages of volcanic ash cloud.
5 Conclusions
This paper has proposed a new image segmentation method based on fuzzy clustering by the CA and image spatial feature weighting. Combining image color-spatial feature weighting and the CA’s self-iteration, it speeds up the convergence of image segmentation and fur-ther improves the accuracy of initial clustering center and segmentation efficiency. Experiments show that the proposed method not only effectively achieves image seg-mentation, but also significantly improves the anti-noise property and robustness by CA and image color-spatial fea-ture weighting. Then the image segmentation of long-term sequence satellite remote sensing image has been imple-mented and discussed by the proposed method and has achieved good identification results of volcanic ash cloud.
Fuzzy clustering can effectively solve the general un-certainty in image segmentation because of the powerful fuzzy description ability and has great advantages in the field of image processing. However, in fact, the image has multiple features. Meanwhile, it may also have differ-ent combinations in accordance with the detail applica-tion. Meanwhile, the FCM method is sensitive to the initial clustering center and noisy data. Therefore, in the follow-up work, we will try to extract more image fea-tures, find out the optimal feature combination, improve the segmentation speed and efficiency, and further apply to the satellite remote sensing image classification.
Abbreviations
AAI:Aerosol absorption index; CA: Cellular automata; FCM: Fuzzy C-means; KFCM: Kernel fuzzy C-means; PSNR: Peak signal noise ratio
Acknowledgements
The authors thank the editor and anonymous reviewers for their helpful comments and valuable suggestions. I would like to acknowledge all our team members, especially Lan Liu. these authors contributed equally to this work.
About the authors
University, China, in 2018. Now she is currently an engineer in the Shanghai University of Engineering Science. Her major is computer application. Her main research interests are in the areas of clustering classification and spatial image processing.
Xiankun Sun was born in Jinan City, Shandong Province, China, in 1972. Now he is an associate professor in College of Electronic and Electrical
Engineering in Shanghai University of Engineering Science. He received the M.S. degree in computer science from the East China Normal University, China, in 2001. Now he is the Ph. D student of School of Computer Engineering and Science in Shanghai University, China. Her major is computer application. His main research interests are in the areas of data mining and satellite remote sensing image processing. He has hosted and participated in several national and provincial research projects, and published several articles at present.
Junjuan Zhao received the B.S. and M.S. degrees in solid earth physics from the East China Normal University, China, in 2001 and 2004, and Ph.D. degree in Communication and Information System from the Shanghai University, China, in 2013, respectively. Now she is currently an Engineer in Shanghai University. Her main research interests are in the areas of parallel computing and image processing.
Jingyuan Yin received the B.S. and M.S. degrees in physical geography from the Nankai University, China, in 1982 and 1987, and Ph.D. degrees in physical geography from the Louis Pasteur University of Strasbourg, France. Now he is currently a full professor in Shanghai University and Earthquake Administration of Shanghai Municipality. His main research interests are in the areas of computer application, disaster monitoring and spatial information processing.
Funding
This research was supported by the National Natural Science Foundation of China under Grant No. 41404024, Graduate Innovation and Entrepreneurship Program in Shanghai University in China under Grant No. 2019GY04, Science and Technology Development Foundation of Shanghai in China under Grant No. 16dz1206000 and 16142203000.
Availability of data and materials We can provide the data.
Authors’contributions
All authors take part in the discussion of the work described in this paper. These authors contributed equally to this work and should be considered co-first authors. All authors read and approved the final manuscript.
Competing interests
The authors declare that they have no competing interests.
Publisher’s Note
Springer Nature remains neutral with regard to jurisdictional claims in published maps and institutional affiliations.
Author details
1School of Computer Engineering and Science, Shanghai University, 711
Computer Building, Shanghai 200444, People’s Republic of China.2Shanghai Institute of Advanced Communication and Data Science, Shanghai University, Shanghai 200444, People’s Republic of China.3School of
Electronic and Electrical Engineering, Shanghai University of Engineering Science, Shanghai 201620, People’s Republic of China.4Earthquake Administration of Shanghai Municipality, Shanghai 200062, People’s Republic of China.
Received: 25 November 2018 Accepted: 28 January 2019
References
1. Y. Zhang, D. Huang, M. Ji, et al., Image segmentation using PSO and FCM with Mahalanobis distance. Exp. Syst. Appl.38(7), 9036–9040 (2011) 2. L. Yunlong, B. Lin, Fuzzy clustering image segmentation algorithm with
high validity optimized by artificial immune algorithm. Contr Decis.25(11), 1679–1683 (2010)
3. Z. Bin, G. Li, Z. Shengchao, Q. Min, H. Chongyang, Fuzzy clustering image segmentation based on improved genetic algorithm. J. Projectiles Rockets Missiles Guid.28(4), 190–−192 (2008)
4. M. Kumar, Y.H. Mao, Y.H. Wang, T.R. Qiu, C. Yang, W.P. Zhang, Fuzzy theoretic approach to signals and systems: Static systems. Inform. Sci.418, 668–702 (2017)
5. W.P. Zhang, J.Z. Yang, Y.L. Fang, H.Y. Chen, Y.H. Mao, M. Kumar, Analytical fuzzy approach to biological data analysis. Saudi J. Biol. Sci.24(3), 563–573 (2017) 6. H. Wang, Z. Wenting, S. He, Y. Deng, An image segmentation method
based on cellular automata and fuzzy C-means. Geomat. Inform. Sci. Wuhan Univ.35(11), 1288–1291 (2010)
7. Y. Quan, H. Liao, A software based on cellular automata used to simulate time and space dynamic change in geography. J. Nanjing Univ. (Natural Sciences)41(3), 857–861 (2005)
8. Z. Yihan, L. Xia, L. Xiaoping, Q. Jigang, H. Zhiqian, Urban expansion simulation by coupling remote sensing observations and cellular automata. J. Remote. Sens.17(4), 872–886 (2015)
9. Y. Guo, R. Xia, A. Sengür, K. Polat, A novel image segmentation approach based on neutrosophic c-means clustering and indeterminacy filtering. Neural Comput. Applic.28(10), 3009–3019 (2017)
10. L. Yuan, E. Yao, G. Tan, Automated and precise event detection method for big data in biomedical imaging with support vector machine. Comput. Syst. Sci. Eng.33(2) 105-114 (2018)
11. L. Zheyan, Z. Sulan, H. Lihua, Z. Jifu, A method flower image classification based on cellular automata and weighted feature fusion. J. Taiyuan Univ. Sci. Technol39(3), 203–209 (2018)
12. H. Zhiqiang, L. Wang, J. Guo, C. Peng, An object tracking algorithm based on color, space and texture information. Opt. Eng.45(4), 1–8 (2018) 13. X. Yu, L. Bin, C. Wufan, A new algorithm for magnetic resources image
segmentation based on fuzzy kernel clustering. J. South Med. Univ.28(4), 555–557 (2008)
14. T. Xiaolin, J. Lichen, G. Shuiping, SAR image segmentation using FCM with weighted spatial function. J. Xidian Univ.35(5), 846–851 (2008) 15. G. Xin, Wang Haitao, Wang Lingfeng, et al. Fusing multiple features for
objects tracking based on uncertainty measurement. Acta Autom. Siniaca 37(5), 550–−559 (2011)
16. S. Zhang, Z. Wei, Y. Wang, T. Liao, Sentiment analysis of Chinese micro-blog text based on extended sentiment dictionary. Futur. Gener. Comput. Syst. 81, 395–403 (2018)
17. H. Shen, S. Wang, X. Wu, Fuzzy kernel clustering with outliers. J. Softw.15(7), 1021–1029 (2004)
18. S. Tamra, Pattern classification based on fuzzy relations. IEEE Trans. Syst. Man Cybern.1(1), 217–225 (1971)
19. M. Ganesh, M. Naresh, C. Arvind, MRI brain image segmentation using enhanced adaptive fuzzy K-means algorithm. Intell. Autom. Soft Comput. 23(2), 325–330 (2017)
20. J.C. Bezdek,Pattern Recognition with Fuzzy Objective Function Algorithms (Plenum Press, New York, 1981)
21. K.L. Wu, M.S. Yang, Alternative C-means clustering algorithms. Pattern Recogn.35(10), 2267–2278 (2002)
22. X.Z. Wang, Y.D. Wang, L.J. Wang, Improving fuzzy C-means clustering based on feature-weight learning. Pattern Recogn. Lett.25(10), 1123–1132 (2004) 23. T. Duming, L. Chungchan, Fuzzy C-means based clustering for linearly and
nonlinearly separable data. Pattern Recogn.44, 1750–1760 (2011) 24. J. Gao, S.T. Wang, Clustering algorithm based on fuzzy maximum scatter
difference discriminant criterion. J. Softw.20(11), 2939–2949 (2009) 25. X.Y. Wang, J. Bu, A fast and robust image segmentation using FCM with
spatial information. Digital Signal Process.20(4), 1173–1182 (2010) 26. F. Zhao, L.C. Jiao, H.Q. Liu, Fuzzy C-means clustering with non-local spatial
information for noisy image segmentation. Front. Comput. Sci. China5(1), 45–46 (2011)
27. P.J.F. Groenen, K. Jajuga, Fuzzy clustering with squared Murkowski distance. Fuzzy Sets Syst.120(2), 227–237 (2001)
28. X.L. Xie, G. Beni, A validity measure for fuzzy clustering. IEEE Trans. Pattern Anal. Mach. Intell.13(4), 841–847 (1991)
29. F. Yufang, H. Lu, Y. Hong, Fuzzy C-means clustering image segmentation method based on multi-chain quantum bee colony algorithm. Comput. Eng. Appl.53(24), 8–14 (2017)
31. M. Caihong, H. Lili, L. Yi, L. Ruochen, J. Licheng, Change detection for remote sensing images based on wavelet fusion and PCA-kernel fuzzy clustering. Acta Electron. Sin.43(7), 1675–1381 (2015)
32. M. Luo, L. Dongbo, N. Wang, C. Xinhai, Clothing image segmentation based on improved kernel fuzzy C-means clustering algorithm. J. Hunan Inst. Eng. 28(2), 40–43 (2018)
33. F. Prata, N. Kristianesen, H.E. Thomas, A. Stohl, Ash metrics for European and trans-atltantic air routes during the Eyjafjallajoukull eruption 14 April to 23 may 2010. J. Geophys. Res.-Atmos.123(10), 5469–5483 (2018)