doi:10.1155/2010/842697
Research Article
Detailed Performance and Waiting-Time Predictability Analysis
of Scheduling Options in On-Demand Video Streaming
Mohammad A. Alsmirat and Nabil J. Sarhan
Electrical and Computer Engineering Department, Media Research Lab, Wayne State University, Detroit, MI 48202, USA
Correspondence should be addressed to Nabil J. Sarhan,[email protected]
Received 2 May 2009; Accepted 24 November 2009
Academic Editor: Benoit Huet
Copyright © 2010 M. A. Alsmirat and N. J. Sarhan. This is an open access article distributed under the Creative Commons Attribution License, which permits unrestricted use, distribution, and reproduction in any medium, provided the original work is properly cited.
The number of on-demand video streams that can be supported concurrently is highly constrained by the stringent requirements of real-time playback and high transfer rates. To address this problem, stream merging techniques utilize the multicast facility to increase resource sharing. The achieved resource sharing depends greatly on how the waiting requests are scheduled for service. We investigate the effectiveness of the recently proposed cost-based scheduling in detail and analyze opportunities for further tunings and enhancements. In particular, we analyze alternative ways to compute the delivery cost. In addition, we propose a new scheduling policy, calledPredictive Cost-Based Scheduling(PCS), which applies a prediction algorithm to predict future scheduling decisions and then uses the prediction results to potentially alter its current scheduling decisions. Moreover, we propose an enhancement technique, calledAdaptive Regular Stream Triggering(ART), which significantly enhances stream merging behavior by selectively delaying the initiation of full-length video streams. We analyze the effectiveness of the proposed strategies in terms of their performance effectiveness and impacts on waiting-time predictability through extensive simulation. The results show that significant performance benefits as well as better waiting-time predictability can be attained.
1. Introduction
The interest in video streaming has grown dramatically across the Internet and wireless networks and continues to evolve rapidly. Unfortunately, the number of on-demand video streams that can be supported concurrently is highly constrained by the stringent requirements of multimedia data, which require high transfer rates and must be presented continuously in time. Stream merging techniques [1–7] address this challenge by aggregating clients into successively larger groups that share the same multicast streams. These techniques includePatching[1,3],Transition Patching[8,9], andEarliest Reachable Merge Target(ERMT) [2,10]. Periodic broadcasting techniques [11–15] also address this challenge but can be used for only popular videos and require the requests to wait until the next broadcast times of the first corresponding segments. This paper considers the stream merging approach.
The achieved resource sharing by stream merging depends greatly on how the waiting requests are scheduled for service. Despite the many proposed stream merging
techniques and the numerous possible variations, there has been only a little work on the issue of scheduling in the context of these scalable techniques. The choice of a scheduling policy can be as important as or even more important than the choice of a stream merging technique, especially when the server is loaded. Minimum Cost First (MCF) [16] is a cost-based scheduling policy that has recently been proposed for use with stream merging. MCF captures the significant variation in stream lengths caused by stream merging through selecting the requests requiring the least cost (measured in bytes of the delivered video data).
0 50 100 150 200 250 300
V
ideo
p
la
ybac
k
p
oint
(sec
onds)
0 23 34 46 68 108 136 164 185 262 Time (seconds)
Regular stream Patch stream
Video length=600 seconds
Wr=97 seconds
Figure1: Patching.
important because the current scheduling decision can affect future scheduling decisions, especially when stream merging and cost-based scheduling are used.
Additionally, we analyze the effectiveness of incorporat-ing video prediction results into the schedulincorporat-ing decisions. The prediction of videos to be serviced and the prediction of waiting times for service have recently been proposed in [17]. These prediction results, however, were not used to alter the scheduling decisions. We propose a scheduling policy, called Predictive Cost-Based Scheduling (PCS). Like MCF, PCS is cost-based, but it predicts future system state and uses the prediction results to potentially alter the scheduling decisions. It delays servicing requests at the current scheduling time (even when resource are available) if it is expected that shorter streams will be required at the next scheduling time. We present two alternative implementations of PCS.
We also propose an enhancement technique, called Adap-tive Regular Stream Triggering(ART), which can be applied with any scheduling policy to enhance stream merging. The basic idea of ART is to selectively delay the initiation of full-length video streams.
We study the effectiveness of various strategies and design options through extensive simulation in terms of performance effectiveness as well as waiting-time predictabil-ity. The ability to inform users about how long they need to wait for service has become of great importance [17], especially considering the growing interest in human-centered multimedia systems. Today, even for short videos with medium quality, users of online video websites may experience significant delays. Providing users with waiting-time feedback enhances their perceived quality-of-service and encourages them to wait, thereby increasing throughput. The analyzed metrics include customer defection (i.e., turn-away) probability, average waiting time, unfairness against unpopular videos, average cost per request, waiting-time prediction accuracy, and percentage of clients receiving
expected waiting times. The waiting-time prediction accu-racy is determined by the average deviation between the expected and actual waiting times. We consider the impacts of customer waiting tolerance, server capacity, request arrival rate, number of videos, video length, and skew in video access. We also study the impacts of different request arrival processes and video workloads. Furthermore, in contrast with prior studies, we analyze the impact of flash crowds, whereby the arrival rate experiences sudden spikes.
The results demonstrate that the proposed PCS and ART strategies significantly enhance system throughput and reduce the average waiting time for service, while providing accurate predicted waiting times.
The rest of the paper is organized as follows.Section 2 provides background information on main performance metrics, stream merging, and request scheduling techniques. Section 3analyzes cost-based scheduling and explores alter-native ways to compute the cost. Sections4 and5 present the proposed PCS and ART strategies, respectively.Section 6 discusses the performance evaluation methodology and Section 7presents and analyzes the main results.
2. Background Information
In this section, we discuss the main performance metrics used to evaluate scheduling policies in streaming servers. We then discuss stream merging and request scheduling.
2.1. Main Performance Metrics of Video Streaming Servers. The main performance metrics of video streaming servers are user defection probability, average waiting time, and unfairness. The defection probability is the probability that a new user leaves the server without being serviced because of a waiting time exceeding the user’s tolerance. It is the most important metric, followed by the average waiting time, because it translates directly to the number of users that can be serviced concurrently and to server throughput. Unfairness measures the bias of a scheduling policy against unpopular videos and can be computed as the standard deviation of the defection probability among the videos:
Unfairness=
n
i=1
di−d
2
n−1 , (1)
where di is the defection probability for video i, d is the
mean defection probability across all videos, and n is the number of videos. In this paper, we also consider waiting-time predictability metrics as will be discussed inSection 7.
2.2. Scalable Delivery of Video Streams with Stream Merging. Stream merging techniques aggregate users into larger groups that share the same multicast streams. In this sub-section, we discuss three main stream merging techniques: Patching [1,3,18], Transition Patching [8,9], and ERMT [2,10].
0 50 100 150 200 250 300 350 400 450 500
V
ideo
p
la
ybac
k
p
oint
(sec
onds)
0 32 64 108 178 219 260 304 353 384 415 444 Time (seconds)
Regular stream Patch stream
Transition patch stream Video length=600 seconds
Wr=212 seconds
Wt=44 seconds
Figure2: Transition Patching.
missing portion as a patch using a unicast stream. A full-length multicast stream is called regular stream. Both the regular and patch streams are delivered at the video playback rate. The length of a patch stream and thus its delivery cost are proportional to the temporal skew from the latest regular stream. The playback starts using the data received from the patch stream, whereas the data received from the regular stream are buffered locally for use upon the completion of the patch stream. Because patch streams are not sharable with later requests and their cost increases with the temporal skew from the latest regular stream, it is cost-effective to start a new regular stream when the patch stream length exceeds a certain value, calledregular window(Wr).Figure 1further explains the concept. Initially, one regular stream (first solid line) is delivered, followed by two patch streams (next two dashed lines) to service new requests. Note that the length of the patch stream is the temporal skew to the regular stream. Subsequently, another regular stream (second solid line) is initiated followed by two other patch streams.
Transition Patching allows some patch streams to be sharable by extending their lengths. Specifically, it introduces another multicast stream, called transition stream. The threshold to start a regular stream isWras in Patching, and the threshold to start a transition stream is calledtransition window (Wt). Figure 2further illustrates the concept. For example, the client at time 219 seconds starts listening to its own patch stream (second dotted line) and the closest preceding transition patch stream (second dashed line), and when its patch is completed, it starts listening to the closest preceding regular stream (first solid line).
ERMT is a near optimal hierarchical stream merging technique. Whereas a stream can merge at most once in Patching and at most twice in Transition Patching, ERMT allows streams to merge multiple times, thereby leading to a dynamic merge tree. In particular, a new user or a newly
0 100 200 300 400 500 600
V
ideo
p
la
ybac
k
p
oint
(sec
onds)
0 51 102 151 202 253 302 339 404 439 539 600 Time (seconds)
Regular stream Stream extension Patch stream
Figure3: ERMT.
merged group of users snoops on the closest stream that it can merge with if no later arrivals preemptively catch them [2]. To satisfy the needs of the new user, the target stream may be extended, and thus its own merging target may change. Figure 3 illustrates the operation through a simple example. We can see that the third stream length got extended after the fourth stream had merged with it. Extensions are shown as dotted lines. ERMT performs better than other hierarchical stream merging alternatives and close to the optimal solution, which assumes that all request arrival times are known in advance [2,19,20].
Patching, Transition Patching, and ERMT differ in complexity and performance. Both the implementation complexity and performance increase from Patching to Transition Patching to ERMT. Selecting the most appropriate stream merging technique depends on a tradeoff between the required implementation complexity and the achieved performance.
2.3. Request Scheduling of Waiting Video Requests. A schedul-ing policy selectschedul-ing an appropriate video for service when-ever it has an availablechannel. A channel is a set of resources (network bandwidth, disk I/O bandwidth, etc.) needed to deliver a multimedia stream. All waiting requests for the selected video can be serviced using only one channel. The number of channels is referred to asserver capacity.
a queue is defined as its length divided by the square root of the relative access frequency of its corresponding video. MCF policy has been recently proposed to exploit the variations in stream lengths caused by stream merging techniques. It gives preference to the videos whose requests require the least cost in terms of the amount of video data (measured in bytes) to be delivered. The length of the stream (in time) is directly proportional to the cost of servicing that stream since the server allocates a channel for the entire time the stream is active. Please note the distinction between video lengths and required stream lengths. Due to stream merging, even the requests for the same video may require different stream lengths.MCF-P(P for “Per”), the preferred implementation of MCF, selects the video with the least cost per request. The objective function here is
F(i)=Li×Ri
Ni , (2)
where Li is the required stream length for the requests in
queuei,Riis the (average) data rate for the requested video,
and Ni is the number of waiting requests for video i. To
reduce the bias against videos with higher data rates,Rican
be removed from the objective function (as done in this paper). MCF-P has two variants:Regular as Full(RAF) and Regular as Patch (RAP). RAP treats regular and transition streams as if they where patches, whereas RAF uses their normal costs. MCF-P performs significantly better than all other scheduling policies when stream merging techniques are used. In this paper, we simply refer to MCF-P (RAP) as MCF-P unless the situation calls for specificity.
3. Analysis of Cost-Based Scheduling
We seek to understand the behavior of cost-based scheduling and its interaction with stream merging. Understanding this behavior helps in developing solutions that optimize the overall performance. One of the issues that we explore in this study is determining the duration over which the cost should be computed. In particular, we seek to determine whether the cost should be computed only at the current scheduling time (TNow) or over a future duration of time, calledprediction
window(Wp). In other words, should the system select the
video with the least cost per request at timeTNowor the least
cost per request duringWp. The latter requires prediction of
the future system state. We devise and explore two ways to analyze the effectiveness of computing the cost over a period of time:LookaheadandCombinationalscheduling.
3.1. Lookahead Scheduling. In Lookahead Scheduling, the service rate (which is the rate at which a video gets serviced) is computed dynamically for each video that has waiting requests. The total cost for servicing each one of these videos is computed during the time intervalWp. Lookahead
Scheduling selects the video j that minimizes the expected cost per request. Thus, the objective function to minimize is
Fj =
n
i=1Ci
n
i=1Ni
, (3)
wherenis the number of expected service times for video j duringWp,Ciis the cost required to service the requests for
video j at service timei, andNiis the number of requests
expected to be serviced at service time i. The number of requests at future service times is predicted by dynamically computing the arrival rate for each video. Figure 4further illustrates the idea. As discussed earlier, ERMT may extend streams to satisfy the needs of new requests. MCF-P, however, does not consider later extensions in computing the cost. In analyzing cost-based scheduling, we also need to consider whether it is worthwhile to predict and consider these later extensions. Hence, we consider a variant of Lookahead Scheduling that considers these extensions. (InFigure 4, the term “virtual time” means the future time imagined or simulated by Lookahead Scheduling, as opposed to the actual system time.)
3.2. Combinational Scheduling. In contrast with Lookahead Scheduling, Combinational Scheduling predicts the best sequence in which various videos should be serviced and per-forms scheduling based on this sequence. Thus, it considers any correlations on the cost among successive video selec-tions. Figure 5 illustrates the operation of Combinational Scheduling. The best sequence is found by generating all possible sequences for the nextn stream completion times duringWp, for only then-best videos according to the
MCF-P objective function. Note that stream completion times indicate when server channels become available for servicing new requests. The objective function of each sequence is then calculated. Consider the sequenceSj = {X1,X2,X3,. . .,Xn},
where Xi is the video selected to be serviced at the next ith stream completion time. The objective function for this sequence is
FSj
=
n
i=1CXi
n
i=1NXi
, (4)
whereCXi is the cost required to service videoXi, andNXiis the number of waiting requests for that video.CXi is deter-mined based on the used MCF-P variant. Combinational Scheduling chooses the sequence that is expected to lead to the least overall cost. Although many optimizations are possible to reduce the implementation complexity, we focus primarily on whether exploiting the correlations between successive video selections is indeed important in practical situations.
4. Proposed Predictive Cost-Based Scheduling
v1
v2
v3
v4
v5
. . .
vL
Waiting request Video waiting queues
Scheduler For each video
vjestimateF(vj)
Service the video
vjwith the smallestF(vj)
Determining objective function for videovj
Virtual time Current
scheduling time
T1 T2 T3 Tn
Wp Predict
ed
stre am
1
Predict ed
stre am
2
Predict ed
stre am
3
Predict ed
stre am
n
At timeT1:
initialize total request count (N) and total cost (C) to zero; add the number of waiting requests forvjtoN;
determine the required stream length and add it toC; estimate next service time:T2=T1+ inter-service-time [vj]; At timeTifori >1 andTi< T1+Wp:
estimate number of arrivals in[Ti−1,Ti]; add the estimated number of arrivals toN;
determine the required stream length and add it toC; estimate next service time:Ti+1=Ti+ inter-service-time [vj]; AfterWpis exceeded:
determine the objective functionF(vj)=C/N; Figure4: An Illustration of Lookahead Scheduling.
v1
v2
v3
v4
v5
. . .
. . .
. . .
. . .
vL
Waiting request Video waiting queues
Scheduler For each sequenceSj estimateF(Sj)
Service the sequence
Sjwith the smallestF(Sj)
Determining objective function for sequenceSj
Virtual time Find all possible
sequences
T1 T2 T3 Tn
Wp
V1
predict ed
stre am
V2 predict
ed
stre am
V3
predict ed
stre am
Vn predict
ed
stre am
Current scheduling
time
X1X2X3 Xn
S1 S2
S3
S4
Sm
At timeT1:
initialize total request count (N) and total cost (C) to zero; add the number of waiting requests forV1toN; determine the required stream length and add it toC; estimate next service time :T2=next stream completion time; At timeTifori > 1 andTi< T1+Wp:
estimate number of arrivals in [Ti−1,Ti]; add the estimated number of arrivals toN;
determine the required stream length and add it toC;
estimate next service time :Ti+1=next stream completion time; AfterWpis exceeded:
determine the sequence objective functionF(Sj)=C/N; Figure5: Illustration of Combinational Scheduling.
channel becomes available, PCS determines using the MCF-P objective function the videoVNowwhich is to be serviced
tentatively at the current scheduling time (TNow) and its
associated delivery cost. To avoid unfairness against videos with high data rates, we use the required stream length for the cost [16]. Before actually servicing that video, PCS predicts the system state at the next scheduling time (TNext) and
estimates the delivery cost at that time assuming that video VNowis not serviced at timeTNow. PCS does not service any
request at timeTNowand thus postpones the service of video
VNow if the delivery cost at timeTNextis lower than that at
timeTNow. Otherwise, videoVNowis serviced immediately.
currDefectionRate=defectedCustomers/servedCustomers;
if(currDefectionRate<lasDefectionRate){
if(last action was decrementandfreeChannelThresh>2) freeChannelThresh–;
else if(last action was increment)
freeChannelThresh++;
}else if(currDefectionRate>lastDefectionRate){
if(last action was incrementandfreeChannelThresh>2) freeChannelThresh–;
else if(last action was decrement)
f reeChannelThresh+ +;
}
lastDe f ectionRate=currDe f ectionRate;
Algorithm 1: Simplified algorithm for dynamically computing freeChannelThresh.
channels (freeChannels) is smaller than a certain thresh-old (freeChannelThresh). Algorithm 1 shows a proposed algorithm to dynamically find the best value of freeChan-nelThresh. The algorithm changes the value of the threshold and observes its impact on customer defection probability over a certain time interval. The value of the threshold is then updated based on the trend in defection probability (increase or decrease) and the last action (increase or decrease) performed on the threshold. The algorithm is to be executed periodically but not frequently to ensure stable system behavior.
We present two alternative implementations of PCS: PCS-V and PCS-L. These two implementations differ in how to compute the delivery cost or required stream length at the next scheduling time. PCS-V predicts the video to be serviced at the next scheduling time and simply uses its required stream length. The video prediction is done by utilizing detailed information about the current state of the server in a manner similar to that of the waiting-time prediction approach in [17]. This information includes the number of waiting requests for each video, the completion times of running streams, and statistics such as the average request arrival rate for each video (which is to be updated periodically).Algorithm 2shows a simplified algorithm for PCS-V.
In contrast with PCS-V, PCS-L computes the expected required stream length at the next scheduling time based on the lengths of all possible video streams that may be required and their probabilities. A simplified algorithm for PCS-L is shown inAlgorithm 3. The probability that a video is selected is equal to the probability that it has at least one waiting request at timeTNext times the probability that all
video streams with lower cost (i.e., shorter required streams) are not selected. The probability that videovhas at least one arrival during duration TNext−TNow can be found as one
minus the probability of exactly zero arrivals:
1−e−λv×(TNext−TNow), (5)
whereλiis the request arrival rate for videovand assuming
a Poisson arrival process. If the video has already one
waiting request, then this probability is 1. Sorting the videos according to the scheduling objective function is required to determine the probability that all videos with lower cost (or higher objective) are not selected.
As can be clearly seen from the algorithms, both PCS-V and PCS-L require a time overhead ofO(Nv), whereNvis the
number of videos, assuming that a priority queue structure is used to rank the videos according to the objective function.
5. Proposed Adaptive Regular Stream
Triggering (ART)
As will be shown later, our analysis reveals a significant interaction between stream merging and scheduling deci-sions. One of the pertaining issues is how to best handle regular (i.e., full) streams. MCF-P (RAP) considers the cost of a regular stream as a patch and thus treats it in a differentiated manner. The question arises as to whether it is worthwhile, however, to delay regular streams in certain situations. Guided by analysis, we propose a technique, called Adaptive Regular Stream Triggering(ART). A possible implementation is shown in Algorithm 4. The basic idea here is to delay regular streams as long as the number of free channels is below a certain threshold, which is to be computed dynamically based on the current workload and system state. ART uses the same algorithm (shown in Algorithm 1) to dynamically find the best value of free Channel Thresh as that of PCS.
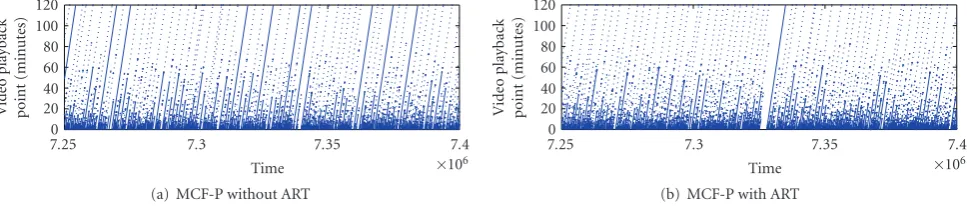
To further demonstrate the main idea of ART, Figure 6 plots the ERMT merge tree without and with ART, respec-tively. The solid lines show the initial stream lengths and the dotted lines show later extensions. The circles identify successive extensions. With ART, there is a gap before a regular stream is initiated because of the postponement. We also observe that ART enhances the stream merging decisions of ERMT. The number of initial regular streams (called I Streamsin this paper) in the merge tree is relatively much smaller with ART. For example, there is only oneI Streamin the merge tree with ART while there are many moreI Streams in the merge tree without ART.
As can be seen form the ART algorithm inAlgorithm 4, ART requires a time overhead ofO(1) in addition to the time overhead of the base scheduling policy used.
In principle, ART can be used with any scheduling policy, including PCS, although some negative interference happens when it is combined with PCS, as will be shown inSection 7.
6. Evaluation Methodology
We study the effectiveness of the proposed policies through simulation. The simulation, written inC, stops after a steady-state analysis with 95% confidence interval is reached.
VNow=find the video that will tentatively be serviced atTNow;
if(freeChannels≥freeChannelThresh) Service the requests forVNow;
else{
currStreamLen=find required stream length to serviceVNowatTNow;
VNext=find the video that is expected to be serviced atTNext; nextStreamLen=find required stream length to serviceVNextatTNext;
if(currSreamLen≤nextStreamLen) Service the requests forVNow;
}
Algorithm2: Simplified algorithm for PCS-V.
VNow=find the video that will tentatively be serviced atTNow;
if(freeChannels≥freeChannelThresh) Service the requests forVNow;
else{
currStreamLen=find required stream length to serviceVNowatTNow; Calculate objective function for each video atTNext;
Sort videos from best to worst according to objective function; expectedStreamLen=0; //initialization
//loop to find expected stream length atTNext
for(v=0;v < Nv;v+ +){// for each video
nextStreamLen=find required stream length to servicevatTNext;
Prob(videovis selected)=Prob(no other video with better objective is selected) ∗Prob(videovhas at least one arrival);
expectedStreamLen+=Prob(videovis selected)∗nextStreamLen;
}
if(currSreamLen≤expectedStreamLen) Service the requests forVNow;
}
Algorithm3: Simplified algorithm for PCS-L.
of the shape (k), while adjusting the scale so that the desired average request arrival rate is reached. Additionally, we assume that the access to videos is highly localized and follows a Zipf-like distribution. With this distribution, the probability of choosing thenth most popular video isC/n1−θ
with a parameter θ and a normalized constant C. The parameter θ controls the skew of video access. Note that the skew reaches its peak when θ = 0, and that the access becomes uniformly distributed whenθ =1. We analyze the impact of this parameter, but we generally assume a value of 0.271 [24,25].
We characterize the waiting tolerance of customers by three models. In Model A, the waiting tolerance follows an exponential distribution with meanμtol[24,25]. InModel B,
users with expected waiting times less thanμtolwill wait and
the others will have the same waiting tolerance as Model A [24,25]. We useModel Cto capture situations in which users either wait or defect immediately depending on the expected waiting times. The user waits if the expected waiting time is less thanμtol and defects immediately if the waiting time
is greater than 2μtol. Otherwise, the defection probability
increases linearly from 0 to 1 for the expected waiting times betweenμtoland 2μtol[17].
As in most previous studies, we generally study a server with 120 videos, each of which is 120 minutes long. We examine the server at different loads by fixing the request arrival rate at 40 requests per minute and varying the number of channels (server capacity) generally from 200 to 750. In addition to the fixed-length video workload (in which all videos have the same length), we experiment with a variable-length video workload. Moreover, we study the impacts of arrival rate, user’s waiting tolerance, number of videos, and video length (in the fixed-length workload).
Flash crowds workload characteristics were adopted from [26].
VNow=find the video that will be serviced atTNow;
if(f reeChannels≥f reeChannelThresh) Service the requests forVNow;
else{
currStreamLen=find the required stream length to serveVNowatTNow;
if(currStreamLen < movieLen) //not a full stream Service the requests forVNow;
else//full stream
Postpone the requests forVNow;
}
Algorithm4: Simplified implementation of ART.
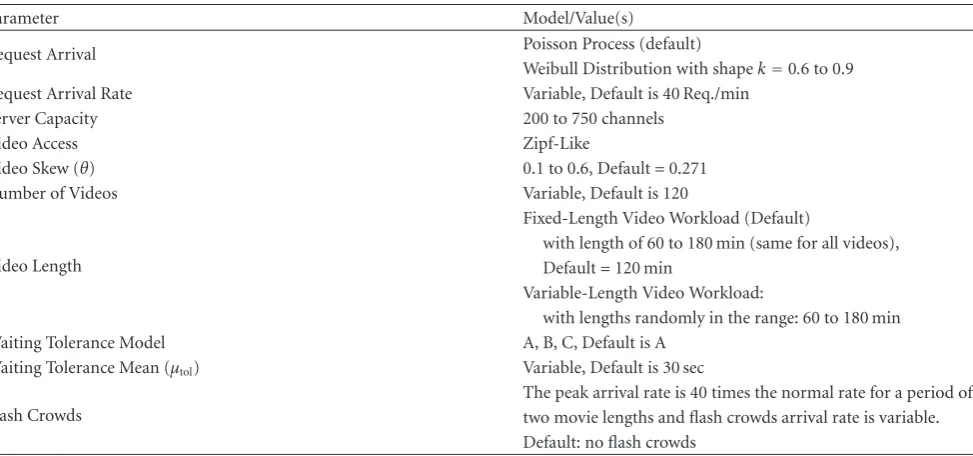
Table1: Summary of Workload Characteristics.
Parameter Model/Value(s)
Request Arrival Poisson Process (default)
Weibull Distribution with shapek=0.6 to 0.9
Request Arrival Rate Variable, Default is 40 Req./min
Server Capacity 200 to 750 channels
Video Access Zipf-Like
Video Skew (θ) 0.1 to 0.6, Default=0.271
Number of Videos Variable, Default is 120
Video Length
Fixed-Length Video Workload (Default)
with length of 60 to 180 min (same for all videos), Default=120 min
Variable-Length Video Workload:
with lengths randomly in the range: 60 to 180 min
Waiting Tolerance Model A, B, C, Default is A
Waiting Tolerance Mean (μtol) Variable, Default is 30 sec
Flash Crowds
The peak arrival rate is 40 times the normal rate for a period of two movie lengths and flash crowds arrival rate is variable. Default: no flash crowds
client because the prediction may not always be performed accurately.
7. Result Presentation and Analysis
7.1. Comparing the Effectiveness of Different Cost-Computa-tion Alternatives. Let us start by studying the effectiveness of Lookahead and Combinational Scheduling. Interestingly, there is no clear benefit for computing the cost over a future period of time. In some cases, as shown in Figure 7, the performance in terms of customer defection and average waiting time may be worse than those when computing the cost at the current scheduling time with MCF-P. The results of Lookahead Scheduling are shown for two different prediction window values. Only the results with future stream extensions are shown. The results without extensions are almost the same.
Although computing the cost over a time interval seems intuitively to be an excellent choice, it interferes negatively with stream merging. Later in this paper, we discuss how the interaction between stream merging and scheduling can be
utilized by using the proposed ART technique, which can be used with any scheduling policy. Based on these results, we only consider next computing the cost at the current scheduling time.
7.2. Effectiveness of the Proposed PCS Policy. Figures8,9, and 10demonstrate the effectiveness of the two implementations of PCS when applied with ERMT, Transition Patching, and Patching, respectively, in terms of the customer defection probability, average waiting time, and unfairness. The figures show that PCS outperforms MCF-P and MQL in terms of both the two most important performance metrics (defec-tion probability and average waiting time), whereas MCF-P is fairer towards unpopular videos. The two implementations of PCS perform nearly the same and thus PCS-V is preferred because of its simplicity. From this point on, we consider only the PCS-V implementation.
0 20 40 60 80 100 120
Vi
d
eo
p
la
yb
ac
k
point
(min
ut
es)
7.4
7.25 7.3 7.35
Time ×106
(a) MCF-P without ART
0 20 40 60 80 100 120
Vi
d
eo
p
la
yb
ac
k
point
(min
ut
es)
7.4
7.25 7.3 7.35
Time ×106
(b) MCF-P with ART
Figure6: Impact of ART on ERMT Stream Merge Tree (Video 11, MCF-P, Server Capacity =450).
Cu
st
o
m
er
d
ef
ec
ti
o
n
(%
)
300 350 400 450 500 550 600 0
10 20 30 40 50 60 70 80
Server capacity MCF-P
Lookahead,Wp=50 Lookahead,Wp=150 Combinational,n=4 (a) Defection rate
A
ver
age
w
aiting
time
(sec
onds)
300 350 400 450 500 550 600 0
2 4 6 8 10 12 14 16
Server capacity MCF-P
Lookahead,Wp=50 Lookahead,Wp=150 Combinational,n=4 (b) Average waiting time
0 0.005 0.01 0.015 0.02 0.025
U
n
fair
ness
300 350 400 450 500 550 600 Server capacity
MCF-P
Lookahead,Wp=50 Lookahead,Wp=150 Combinational,n=4
(c) Unfairness
Figure7: Effectiveness of Lookahead and Combinational Scheduling (ERMT).
Cu
st
o
m
er
d
ef
ec
ti
o
n
(%
)
300 400 500 600 700
0 10 20 30 40 50 60 70
Server capacity MQL
MCF-P
PCS-V PCS-L (a) Defection rate
A
ver
age
w
aiting
time
(sec
onds)
300 400 500 600 700
0 5 10 15 20
Server capacity MQL
MCF-P
PCS-V PCS-L (b) Average waiting time
U
n
fair
ness
300 400 500 600 700
0 0.005 0.01 0.015 0.02 0.025
Server capacity MQL
MCF-P
PCS-V PCS-L (c) Unfairness
Figure8: Effectiveness of PCS (ERMT).
the customer defection probability and average waiting time by up to 25% and 80%, respectively. It also yields significant improvements when used with MQL. Unfairness, the least important metric, is a little larger with ART because of its nature in favoring videos with shorter streams, but it is still acceptable compared with MQL.
Figure 12depicts the impact of ART on regular streams in ERMT. We observe that when ART postpones regular streams, it forces ERMT to make more merges, which, in
Cu
st
o
m
er
d
ef
ec
ti
o
n
(%
)
300 400 500 600 700 0
20 40 60 80
Server capacity MQL
MCF-P
PCS-V PCS-L (a) Defection rate
A
ver
age
w
aiting
time
(sec
onds)
300 400 500 600 700 0
5 10 15 20
Server capacity MQL
MCF-P
PCS-V PCS-L (b) Average waiting time
U
n
fair
ness
300 400 500 600 700 0
0.005 0.01 0.015 0.02 0.025 0.03
Server capacity MQL
MCF-P
PCS-V PCS-L (c) Unfairness
Figure9: Effectiveness of PCS (Transition Patching).
Cu
st
o
m
er
d
ef
ec
ti
o
n
(%
)
300 400 500 600 700 10
20 30 40 50 60 70 80
Server capacity MQL
MCF-P
PCS-V PCS-L (a) Defection rate
A
ver
age
w
aiting
time
(sec
onds)
300 400 500 600 700 0
5 10 15 20
Server capacity MQL
MCF-P
PCS-V PCS-L (b) Average waiting time
U
n
fair
ness
300 400 500 600 700 0.005
0.01 0.015 0.02 0.025 0.03
Server capacity MQL
MCF-P
PCS-V PCS-L (c) Unfairness
Figure10: Effectiveness of PCS (Patching).
Cu
st
o
m
er
d
ef
ec
ti
o
n
(%
)
300 350 400 450 500 550 600 0
10 20 30 40 50 60 70
Server capacity MQL
MCF-P
MQL with ART MCF-P with ART (a) Defection rate
A
ver
age
w
aiting
time
(sec
onds)
300 350 400 450 500 550 600 0
5 10 15 20
Server capacity MQL
MCF-P
MQL with ART MCF-P with ART (b) Average waiting time
0 0.005 0.01 0.015 0.02 0.025 0.03
U
n
fair
ness
300 400 500 600
Server capacity MQL
MCF-P
MQL with ART MCF-P with ART (c) Unfairness
Figure11: Effectiveness of ART (ERMT).
(E Streams) without and with ART, respectively. We can see that the percentage of extended regular streams with ART is much higher. This supports the fact that the number of regular streams is not reduced by postponing. In summary,
we can say that ART improves ERMT by replacing many I Streamswith E Streams.
are presented inFigure 13and Patching results are presented inFigure 14. As with ERMT, ART reduces significantly the customer defection probability and the average waiting time when it is combined with MCF-P and MQL. Unfairness with ART is a little larger but still acceptable compared with that of MQL for medium and high server capacities.
Interestingly, ART improves Transition Patching and Patching despite that their best scheduling policy, MCF-P (RAP), depends on a conflicting principle. As discussed ear-lier, MCF-P (RAP) gives preference to regular streams while ART postpones them in certain situations. As illustrated in Figure 15, the main impact of ART is dynamically optimizing Wr, which is larger than that of MCF-P (RAP) and smaller than that of MCF-P (RAF) for popular videos, and even greater than that of MCF-P (RAF) for unpopular videos. The horizontal line in the figure marks the equation-based value of Wr [27]. (Note that the equation does not yield optimum values because it is based on important simplifying assumptions.)
7.4. Comparing the Effectiveness of PCS and ART. Although ART can be applied with any scheduling policy, including PCS, for the time being, we consider it as an alternative to PCS because of negative interference between the two, as will be shown in Section 7.8. In this subsection, we compare the effectiveness of PCS-V and ART in terms of customer defection probability, average waiting time, unfairness against unpopular videos, and cost per request. Figures16,17, and18show the results of ERMT, Transition Patching, and Patching respectively.
With ERMT, MCF-P when combined with ART performs better than PCS-V in terms of the customer defection probability and average waiting time. The results when Transition Patching and Patching are used exhibit different behavior than those with ERMT. MCF-P combined with ART gives almost the same results as PCS-V in terms of customer defection probability, but it reduces the average waiting time significantly. Unfairness of PCS-V is less than that with ART in all stream merging techniques because ART favors videos with shorter streams more than PCS-V. These results indicate that MCF-P when combined with ART is the best overall performer.
To further support the fact that more customers are served with only one stream when using ART, Figure 19 demonstrates the impact of ART on the cost per request. We can see that the cost per request with ART is the lowest for different server capacities.
7.5. Impact of Workload Parameters on the Effectiveness of PCS and ART. Figures20,21,22, and23illustrate the impact of the request arrival rate, customer waiting tolerance, number of videos, and video length on the effectiveness of PCS-V and ART. The results for both Patching and ERMT are shown. The results demonstrate that ART always achieves smaller customer defection probability and average waiting time than PCS-V in the case of ERMT. In Patching, the same trend is observed for the average waiting time, but PCS-V and “MCF-P combined with ART” perform nearly the same
in terms of customer defection probability, especially when the server is highly loaded.
Figure 24shows that the skew in video access has signif-icant impacts on the customer defection probability, average waiting time, and unfairness. Recall that asθ increases, the skew in video access decreases. Both the defection probability and average waiting time are worsen by the reduction in the skew. This is because cost-based scheduling policies favor popular videos by nature. Whenθ increases, the deference in video popularity decreases which in turns makes the scheduling decision harder to make. Unfairness decreases by increasingθwhich is as expected. Again, “MCF-P combined with ART” is the best policy in terms of all performance metrics, except unfairness.
The results so far are for a video workload of a fixed video length.Figure 25shows the customer defection probability, average waiting time and unfairness results for a variable-length video workload. The workload is comprised of videos with lengths in the range of 60 to 180 minutes. The length of each video is generated randomly within the specified range. The results for the workload are obtained by averaging the values of four runs. The PCS-V and ART algorithms also work well in this workload. “MCF-P combined with ART” as in most cases performs better than all other policies. Moreover, we can see that the fairness of ART and PCS-V is better than that of MCF-P with variable-length video workload.
The results so far assume a Poisson request arrival process. Let us now examine the behavior under Weibull dis-tribution with different shape (k) values.Figure 26 demon-strates that the shape has a little impact, especially when the server capacity is larger than 500 channels. Figure 27 compares MCF-P, PCS-V, and MCF-P with ART under Weibull Arrival Distribution with the same shape. The results with other shape parameters have the same trend and thus are not shown. We can see clearly that PCS-V and “MCF-P combined with ART” sill perform better than MCF-P. We can see also that MCF-P with ART is the best policy.
7.6. Comparing Waiting-Time Predictability with PCS and ART. Figure 28compares the predictability of MCF-P, PCS-V, and “MCF-P combined with ART” in terms of the average deviation and percentage of clients receiving expected time of service (PCRE) under waiting tolerance Model B. The results with ModelC are similar and thus are not shown. The results demonstrate that ART significantly improves the predictability of MCF-P. PCS-V is also more predictable than MCF-P. In particular, ART reduces the average deviation by up to 30% and 75% for models B and C, respectively. It also increases the number of clients receiving expected times by up to 35%. Moreover, “MCF-P combined with ART” gives more customers expected times than PCS-V with a relatively less significant increase in the average deviation.
1 2 3 4 11 51 101 0
20 40 60 80 100 120
T
im
e
b
et
w
ee
n
two
su
cce
ss
ive
re
gular
st
reams
(min)
Video number Without ART With ART
(a) Average time between two regular streams
1 2 3 4 11 51 101 0
20 40 60 80 100
Ia
n
d
Es
tr
ea
m
s
(%
)
Video number I streams
E streams
(b) Initial and extended regular streams with-out ART
1 2 3 4 11 51 101 0
20 40 60 80 100
Ia
n
d
Es
tr
ea
m
s
(%
)
Video number I streams
E streams
(c) Initial and extended regular streams with ART
Figure12: Impact of ART on regular streams (ERMT, MCF-P, Server Capacity =450).
Cu
st
o
m
er
d
ef
ec
ti
o
n
(%
)
300 400 500 600 700
0 20 40 60 80
Server capacity MQL
MCF-P
MQL with ART MCF-P with ART (a) Defection rate
A
ver
age
w
aiting
time
(sec
onds)
300 400 500 600 700
0 5 10 15 20
Server capacity MQL
MCF-P
MQL with ART MCF-P with ART (b) Average waiting time
U
n
fair
ness
300 400 500 600 700
0 0.005 0.01 0.015 0.02 0.025
Server capacity MQL
MCF-P
MQL with ART MCF-P with ART (c) Unfairness
Figure13: Effectiveness of ART (transition patching).
Cu
st
o
m
er
d
ef
ec
ti
o
n
(%
)
300 400 500 600 700 10
20 30 40 50 60 70 80
Server capacity MQL
MCF-P
MQL with ART MCF-P with ART (a) Defection rate
A
ver
age
w
aiting
time
(sec
onds)
300 400 500 600 700 0
5 10 15 20
Server capacity MQL
MCF-P
MQL with ART MCF-P with ART (b) Average waiting time
U
n
fair
ness
300 400 500 600 700 0.005
0.01 0.015 0.02 0.025
Server capacity MQL
MCF-P
MQL with ART MCF-P with ART (c) Unfairness
Ac
tu
al
Wr
(min
ut
es)
550 600 650 700 750 800 850 Server capacity
0 2 4 6 8 10 12
MCF-P (RAF) MCF-P (RAP) MCF-P (RAP) with ART
(a) Video 1
Ac
tu
al
Wr
(min
ut
es)
550 600 650 700 750 800 850 Server capacity
0 5 10 15 20 25 30 35
MCF-P (RAF) MCF-P (RAP) MCF-P (RAP) with ART
(b) Video 10
Ac
tu
al
Wr
(min
ut
es)
550 600 650 700 750 800 850 Server capacity
0 10 20 30 40
MCF-P (RAF) MCF-P (RAP) MCF-P (RAP) with ART
(c) Video 20
Figure15: Comparing Actual Wrin MCF-P (RAF), MCF-P (RAP), and MCFP(RAP) with ART (patching).
Cu
st
o
m
er
d
ef
ec
ti
o
n
(%
)
300 350 400 450 500 550 600 0
10 20 30 40 50
Server capacity PCS-V
MCF-P with ART (a) Defection rate
A
ver
age
w
aiting
time
(sec
onds)
300 350 400 450 500 550 600 0
1 2 3 4 5 6
Server capacity PCS-V
MCF-P with ART (b) Average waiting time
300 400 500
U
n
fair
ness
600 0
0.005 0.01 0.015 0.02 0.025 0.03
Server capacity PCS-V
MCF-P with ART (c) Unfairness
Figure16: Comparing the effectiveness of PCS and ART (ERMT).
Cu
st
o
m
er
d
ef
ec
ti
o
n
(%
)
300 350 400 450 500 550 600 10
20 30 40 50
Server capacity PCS-V
MCF-P with ART (a) Defection rate
A
ver
age
w
aiting
time
(sec
onds)
300 350 400 450 500 550 600 1.5
2 2.5 3 3.5 4 4.5
Server capacity PCS-V
MCF-P with ART (b) Average waiting time
300 400 500 600
0.005
U
n
fair
ness
0.01 0.015 0.02 0.025 0.03
Server capacity PCS-V
MCF-P with ART (c) Unfairness
Cu
st
o
m
er
d
ef
ec
ti
o
n
(%
)
300 350 400 450 500 550 600 25
30 35 40 45 50 55 60
Server capacity PCS-V
MCF-P with ART (a) Defection rate
A
ver
age
w
aiting
time
(sec
onds)
300 350 400 450 500 550 600 3
4 5 6 7
Server capacity PCS-V
MCF-P with ART (b) Average waiting time
300 400 500 600
0.015
U
n
fair
ness
0.02 0.025 0.03
Server capacity PCS-V
MCF-P with ART (c) Unfairness
Figure18: Comparing the Effectiveness of PCS and ART (Patching).
A
ver
age
cost
p
er
re
quest
(se
co
nds)
20 40 60 80 100 120 0
5 10 15 20 25
×102
Video number PCS-V
MCF-P with ART (a) 300 channel
A
ver
age
cost
p
er
re
quest
(se
co
nds)
20 40 60 80 100 120 0
5 10 15 20 25
×102
Video number PCS-V
MCF-P with ART (b) 400 channel
A
ver
age
cost
p
er
re
quest
(se
co
nds)
20 40 60 80 100 120 0
5 10 15 20 25
×102
Video number PCS-V
MCF-P with ART (c) 500 channel
Figure19: Comparing the Impacts of PCS and ART on Cost per Request (ERMT, MCF-P).
0 10 20 30 40 50 60 70
Cu
st
o
m
er
d
ef
ec
ti
o
n
(%
)
20 40 60 80 100 120 Request rate (requests/min) Patching, PCS-V
ERMT, PCS-V
Patching, MCF-P with ART ERMT, MCF-P with ART
(a) Defection rate
0 2 4 6 8 10
A
ver
age
w
aiting
time
(sec
onds)
20 40 60 80 100 120 Request rate (requests/min) Patching, PCS-V
ERMT, PCS-V
Patching, MCF-P with ART ERMT, MCF-P with ART (b) Average waiting time
0 0.01 0.02 0.03 0.04 0.05
U
n
fair
ness
20 40 60 80 100 120 Request rate (requests/min) Patching, PCS-V
ERMT, PCS-V
Patching, MCF-P with ART ERMT, MCF-P with ART
(c) Unfairness
0 10 20 30 40 50 60
Cu
st
o
m
er
d
ef
ec
ti
o
n
(%
)
20 30 40 50 60 70 Average waiting tolerance (seconds)
Patching, PCS-V ERMT, PCS-V
Patching, MCF-P with ART ERMT, MCF-P with ART
(a) Defection rate
0 5 10 15
A
ver
age
w
aiting
time
(sec
onds)
20 30 40 50 60 70 Average waiting tolerance (seconds)
Patching, PCS-V ERMT, PCS-V
Patching, MCF-P with ART ERMT, MCF-P with ART (b) Average waiting time
0 0.005 0.01 0.015 0.02 0.025 0.03 0.035 0.04
U
n
fair
ness
20 30 40 50 60 70 Average waiting tolerance (seconds)
Patching, PCS-V ERMT, PCS-V
Patching, MCF-P with ART ERMT, MCF-P with ART
(c) Unfairness
Figure21: Impact of Customer Waiting Tolerance (Server Capacity =500).
0 10 20 30 40 50 60
Cu
st
o
m
er
d
ef
ec
ti
o
n
(%
)
100 150 200
Number of videos Patching, PCS-V ERMT, PCS-V
Patching, MCF-P with ART ERMT, MCF-P with ART
(a) Defection rate
0 2 4 6 8 10
A
ver
age
w
aiting
time
(sec
onds)
100 150 200
Number of videos Patching, PCS-V ERMT, PCS-V
Patching, MCF-P with ART ERMT, MCF-P with ART (b) Average waiting time
0 0.005 0.01 0.015 0.02 0.025 0.03 0.035
U
n
fair
ness
100 150 200
Number of videos Patching, PCS-V ERMT, PCS-V
Patching, MCF-P with ART ERMT, MCF-P with ART
(c) Unfairness
Figure22: Impact of Number of Videos (Server Capacity =500).
0 10 20 30 40 50 60
Cu
st
o
m
er
d
ef
ec
ti
o
n
(%
)
60 80 100 120 140 160 180 Video length (minutes) Patching, PCS-V ERMT, PCS-V
Patching, MCF-P with ART ERMT, MCF-P with ART
(a) Defection rate
0 1 2 3 4 5 6 7 8 9
A
ver
age
w
aiting
time
(sec
onds)
60 80 100 120 140 160 180 Video length (minutes) Patching, PCS-V ERMT, PCS-V
Patching, MCF-P with ART ERMT, MCF-P with ART (b) Average waiting time
0 0.005 0.01 0.015 0.02 0.025 0.03 0.035 0.04
U
n
fair
ness
60 80 100 120 140 160 180 Video length (minutes) Patching, PCS-V ERMT, PCS-V
Patching, MCF-P with ART ERMT, MCF-P with ART
(c) Unfairness
0.1 0.15 0.2 0.25 0.3 0.35
Cu
st
o
m
er
d
ef
ec
ti
o
n
(%
)
0.1 0.2 0.3 0.4 0.5 0.6 Skew parameter (θ)
PCS-V
MCF-P with ART (a) Defection rate
0 2 4 6 8 10
A
ver
age
w
aiting
time
(sec
onds)
0.1 0.2 0.3 0.4 0.5 0.6 Skew parameter (θ)
PCS-V
MCF-P with ART (b) Average waiting time
0.005
U
n
fair
ness
0.01 0.015 0.02 0.025
0.1 0.2 0.3 0.4 0.5 0.6 Skew parameter (θ) PCS-V
MCF-P with ART (c) Unfairness
Figure24: Impact of Skew in Video Access (ERMT, Server Capacity =450).
Cu
st
o
m
er
d
ef
ec
ti
o
n
(%
)
200 250 300 350 400 450 500 0
0.5 1 1.5 2 2.5
Server capacity MCF-P
PCS-V
MCF-P with ART (a) Defection rate
A
ver
age
w
aiting
time
(sec
onds)
200 250 300 350 400 450 500 0
5 10 15 20 25 30 35 40
Server capacity MCF-P
PCS-V
MCF-P with ART (b) Average waiting time
U
n
fair
ness
200 250 300 350 400 450 500 0
0.02 0.04 0.06 0.08 0.1
Server capacity MCF-P
PCS-V
MCF-P with ART (c) Unfairness
Figure25: Comparing the Effectiveness of MCF-P, PCS, and ART under a Variable-Length Video Workload (ERMT, 60 to 180 minutes Video Length Range).
Cu
st
o
m
er
d
ef
ec
ti
o
n
(%
)
300 350 400 450 500 550 600 0
0.1 0.2 0.3 0.4 0.5
Server capacity
K=0.6
K=0.7
K=0.82
K=0.86
K=0.9 (a) Defection rate
A
ver
age
w
aiting
time
(sec
onds)
300 350 400 450 500 550 600 0
1 2 3 4 5 6 7
Server capacity
K=0.6
K=0.7
K=0.82
K=0.86
K=0.9 (b) Average waiting time
U
n
fair
ness
300 350 400 450 500 550 600 0
0.005 0.01 0.015 0.02 0.025
Server capacity
K=0.6
K=0.7
K=0.82
K=0.86
K=0.9 (c) Unfairness
Cu
st
o
m
er
d
ef
ec
ti
o
n
(%
)
300 350 400 450 500 550 600 0
0.1 0.2 0.3 0.4 0.5 0.6 0.7
Server capacity MCF-P
PCS-V
MCF-P with ART (a) Defection rate
A
ver
age
w
aiting
time
(sec
onds)
300 350 400 450 500 550 600 0
2 4 6 8 10 12
Server capacity MCF-P
PCS-V
MCF-P with ART (b) Average waiting time
U
n
fair
ness
300 350 400 450 500 550 600 0
0.005 0.01 0.015 0.02 0.025 0.03
Server capacity MCF-P
PCS-V
MCF-P with ART (c) Unfairness
Figure27: Comparing MCF-P, PCS-V, and MCF-P with ART under Weibull Arrival Distribution (ERMT, K =0.6).
A
ver
age
d
ev
iation
(sec
onds)
300 400 500 600 700
0 0.5 1 1.5 2
Server capacity MCF-P
PCS-V
MCF-P with ART (a) Average deviation
U
sers
w
ith
expect
ed
times
(%)
300 400 500 600 700
0.4 0.5 0.6 0.7 0.8 0.9 1
Server capacity MCF-P
PCS-V
MCF-P with ART
(b) Customer with expected time
Figure28: Waiting-Time Predictability of MCF-P, MCF-P with ART, and PCS-V (ERMT,Wp=0.5μtol,Model B).
Cu
st
o
m
er
d
ef
ec
ti
o
n
(%
)
0.5 1 2 3 4 5 6 7
42 44 46 48 50 52 54 56
Flash crowds inter-arrival time (days) MCF-P
PCS-V
MCF-P with ART (a) Customer defection
A
ver
age
w
aiting
time
(sec
onds)
0.5 1 2 3 4 5 6 7
0 2 4 6 8 10
Flash crowds inter-arrival time (days) MCF-P
PCS-V
MCF-P with ART (b) Waiting time
U
n
fair
ness
0.5 1 2 3 4 5 6 7
0.02 0.022 0.024 0.026 0.028 0.03 0.032
Flash crowds inter-arrival time (days) MCF-P
PCS-V
MCF-P with ART (c) Unfairness
A
ver
age
cost
p
er
re
quest
(se
co
nds)
20 40 60 80 100 120
0 5 10 15 20 25
×102
Video number MCF-P
PCS-V
MCF-P with ART (a) 300
A
ver
age
cost
p
er
re
quest
(se
co
nds)
20 40 60 80 100 120
0 5 10 15 20
×102
Video number MCF-P
PCS-V
MCF-P with ART (b) 500
Figure30: Comparing MCF-P, PCS-V, and MCF-P with ART with Flash Crowds in Average Cost per Request (ERMT, Flash Crowds Arrival Rate = 1/day).
Cu
st
o
m
er
d
ef
ec
ti
o
n
(%
)
300 400 500 600 700 0
0.1 0.2 0.3 0.4 0.5
Server capacity PCS-V
PCS-V with ART MCF-P with ART
(a) Defection rate
A
ver
age
w
aiting
time
(sec
onds)
300 400 500 600 700 0
1 2 3 4 5 6
Server capacity PCS-V
PCS-V with ART MCF-P with ART (b) Average waiting time
U
n
fair
ness
300 400 500 600 700 0
0.005 0.01 0.015 0.02 0.025 0.03
Server capacity PCS-V
PCS-V with ART MCF-P with ART
(c) Unfairness
Figure31: Effectiveness of Combining Art with PCS (ERMT).
MCF-P when combined with ART handles the flash crowds more efficiently than the other policies. In particular, it achieves the best customer defection probability and average waiting time under all flash crowds interarrival times. PCS-V achieves better results than MCF-P, but its improvement is less than that of ART.Figure 30confirms that ART enhances the efficiency of stream handling even with flash crowds. It is clearly evident that “MCF-P combined with ART” achieves the lowest cost per request for all videos.
7.8. Effectiveness of Combining ART with PCS. Let us now look at the results of combining PCS-V with ART. We show the results under ERMT and Patching in Figures 31 and
32, respectively. Transition Patching has the same trend as Patching and therefore its results are not shown. These results indicate that “MCF-P combined with ART” performs the best among all variations, and that PCS-V performs better than “PCS-V with ART.” From these figures, we conclude that negative interference occurs when ART is combined with PCS-V. Removing this interference by modifying these two strategies is a challenging task and left for a future study.
8. Conclusions
Cu
st
o
m
er
d
ef
ec
ti
o
n
(%
)
300 400 500 600 700 0.1
0.2 0.3 0.4 0.5 0.6
Server capacity PCS-V
PCS-V with ART MCF-P with ART
(a) Defection rate
A
ver
age
w
aiting
time
(sec
onds)
300 400 500 600 700 1
2 3 4 5 6 7
Server capacity PCS-V
PCS-V with ART MCF-P with ART (b) Average waiting time
U
n
fair
ness
300 400 500 600 700 0.005
0.01 0.015 0.02 0.025 0.03
Server capacity PCS-V
PCS-V with ART MCF-P with ART
(c) Unfairness
Figure32: Effectiveness of Combining PCS-V and ART (Patching).
Predictive Cost-Based Scheduling(PCS) andAdaptive Regular Stream Triggering(ART). The main results can be summa-rized as follows.
(i) There is no clear advantage of computing the cost over a future time window, compared with comput-ing the cost only at the next schedulcomput-ing time. (ii) The proposed PCS scheduling policy outperforms the
best existing policy (MCF-P) in terms of customer defection probability and average waiting time. The waiting times can also be predicted more accurately with PCS. The two variations of PCS (PCS-V and PCS-L) perform nearly the same and thus the simpler variant (PCS-V) is preferred because of its lower implementation complexity.
(iii) By enhancing stream merging behavior, the proposed ART technique substantially improves both the cus-tomer defection probability and the average waiting time.
(iv) Although ART in principle can be applied with any scheduling policy, including PCS, negative inter-ference exists between ART and PCS, and thus their combination generally achieves worse than any of them applied individually. Removing this interference by modifying these two strategies is a challenging task and left for a future study.
(v) The best overall performer is “MCF-P combined with ART”, followed by PCS. With ART, significantly more clients can receive expected waiting times for service than PCS, but at a somewhat lower waiting time accuracy.
Acknowledgments
This paper is a revised and extended version of our paper “Performance and waiting-time predictability analysis of design options in cost-based scheduling for scalable media streaming,” which was presented at the International
MultiMedia Modeling Conference (MMM 2009), Antipolis, France, January 2009. It also combines the MMM 2009 paper with a short paper “Predictive cost-based scheduling for scal-able video streaming,” presented at the IEEE International Conference on Multimedia & Expo (ICME 2008), Hannover, Germany, June 2008. This work was supported in part by NSF Grants CNS-0626861 and CNS-0834537.
References
[1] K. A. Hua, Y. Cai, and S. Sheu, “Patching: a multicast technique for true video-on-demand services,” inProceedings of the 6th ACM International Conference on Multimedia, pp. 191–200, 1998.
[2] D. L. Eager, M. K. Vernon, and J. Zahorjan, “Optimal and efficient merging schedules for video-on-demand servers,” in Proceedings of the 7th ACM International Conference on Multimedia, pp. 199–202, 1999.
[3] Y. Cai and K. A. Hua, “Sharing multicast videos using patching streams,”Multimedia Tools and Applications, vol. 21, no. 2, pp. 125–146, 2003.
[4] M. Rocha, M. Maia, I. Cunha, J. Almeida, and S. Campos, “Scalable media streaming to interactive users,” inProceedings of the 13th Annual ACM International Conference on Multime-dia, pp. 966–975, 2005.
[5] H. Ma, G. K. Shin, and W. Wu, “Best-effort patching for multi-cast true VoD service,”Multimedia Tools and Applications, vol. 26, no. 1, pp. 101–122, 2005.
[6] C.-J. Huang, Y.-T. Chuang, C.-T. Guan, Y.-C. Luo, K.-W. Hu, and C.-H. Chen, “A hybrid priority-based video-on-demand resource sharing scheme,”Computer Communications, vol. 31, no. 10, pp. 2231–2241, 2008.
[7] H. Dai and E. Chan, “Quick patching: an overlay multicast scheme for supporting video on demand in wireless net-works,”Multimedia Tools and Applications, vol. 36, no. 3, pp. 221–242, 2008.
[8] Y. Cai and K. A. Hua, “An efficient bandwidth-sharing technique for true video on demand systems,” inProceedings of the 7th ACM International Conference on Multimedia, pp. 211–214, 1999.
the 9th International Conference on Distributed Multimedia Systems, pp. 72–77, 2003.
[10] D. L. Eager, M. K. Vernon, and J. Zahorjan, “Bandwidth skimming: a technique for cost-effective video-on-demand,” inMultimedia Computing and Networking 2000, vol. 3969 of Proceedings of SPIE, pp. 206–215, San Jose, Calif, USA, January 2000.
[11] L.-S. Juhn and L.-M. Tseng, “Harmonic broadcasting for video-on-demand service,”IEEE Transactions on Broadcasting, vol. 43, no. 3, pp. 268–271, 1997.
[12] J.-F. Paris, S. W. Carter, and D. D. E. Long, “Efficient broadcasting protocols for video on demand,” inProceedings of the IEEE International Workshop on Modeling, Analysis, and Simulation of Computer and Telecommunication Systems ((MASCOTS ’98), pp. 127–132, Montreal, Canada, July 1998. [13] C. Huang, R. Janakiraman, and L. Xu, “Loss-resilient
on-demand media streaming using priority encoding,” in Proceed-ings of the 12th ACM International Conference on Multimedia, pp. 152–159, New York, NY, USA, October 2004.
[14] L. Shi, P. Sessini, A. Mahanti, Z. Li, and D. L. Eager, “Scalable streaming for heterogeneous clients,” inProceedings of the 14th Annual ACM International Conference on Multimedia (MM ’06), pp. 337–346, Santa Barbara, Calif, USA, October 2006. [15] P. Gill, L. Shi, A. Mahanti, Z. Li, and D. L. Eager, “Scalable
on-demand media streaming for heterogeneous clients,”ACM Transactions on Multimedia Computing, Communications and Applications, vol. 5, no. 1, pp. 1–24, 2008.
[16] N. J. Sarhan and B. Qudah, “Efficient cost-based scheduling for scalable media streaming,” inMultimedia Computing and Networking 2007, vol. 6504 ofProceedings of SPIE, San Jose, Calif, USA, January 2007.
[17] M. A. Alsmirat, M. Al-Hadrusi, and N. J. Sarhan, “Analysis of waiting-time predictability in scalable media streaming,” in Proceedings of the 15th ACM International Conference on Multimedia (MM ’07), pp. 727–736, Augsburg, Bavaria, September 2007.
[18] S. W. Carter and D. D. E. Long, “Improving video-on-demand server efficiency through stream tapping,” in Proceedings of the 6th International Conference on Computer Communications and Networks (ICCCN ’97), pp. 200–207, Las Vegas, Nev, USA, September 1997.
[19] D. Eager, M. Vernon, and J. Zahorjan, “Minimizing bandwidth requirements for on-demand data delivery,”IEEE Transactions on Knowledge and Data Engineering, vol. 13, no. 5, pp. 742– 757, 2001.
[20] A. Bar-Noy, J. Goshi, R. E. Ladner, and K. Tam, “Comparison of stream merging algorithms for media-on-demand,” Multi-media Systems, vol. 9, no. 5, pp. 411–423, 2004.
[21] A. Dan, D. Sitaram, and P. Shahabuddin, “Scheduling policies for an on-demand video server with batching,” inProceedings of the 2nd ACM International Conference on Multimedia, pp. 391–398, 1994.
[22] C. C. Aggarwal, J. L. Wolf, and P. S. Yu, “The maximum factor queue length batching scheme for video-on-demand systems,” IEEE Transactions on Computers, vol. 50, no. 2, pp. 97–110, 2001.
[23] C. Costa, I. Cunha, A. Borges, et al., “Analyzing client interactivity in streaming media,” inProceedings of the 13th International World Wide Web Conference (WWW ’04), pp. 534–543, New York, NY, USA, May 2004.
[24] A. K. Tsiolis and M. K. Vernon, “Group-guaranteed channel capacity in multimedia storage servers,” inProceedings of the
ACM International Conference on Measurement and Modeling of Computer Systems (SIGMETRICS ’97), pp. 285–297, Seattle, Wash, USA, June 1997.
[25] N. J. Sarhan and C. R. Das, “A new class of scheduling policies for providing time of service guarantees in video-on-demand servers,” in Proceedings of the 7th IFIP/IEEE International Conference on Management of Multimedia Networks and Services, pp. 127–139, 2004.
[26] I. Ari, B. Hong, E. Miller, S. Brandt, and D. Long, “Managing flash crowds on the internet,” in Proceedings of the 11th IEEE/ACM International Symposium on Modeling, Analysis, and Simulation of Computer and Telecommunication Systems (MASCOTS ’03), pp. 246–249, 2003.