An economic-risk analysis of alternative rotations by stochastic
simulation in Fars province
A. Sheikhzeinoddin, M. Bakhshoodeh, H. Dehghanpur
*Department of Agricultural Economics, College of Agriculture, Shiraz University, Shiraz, I.R. Iran
*
Corresponding Author: [email protected]ARTICLE INFO ABSTRACT - Cultivation of legumes in crop rotations results in atmosphere nitrogen fixation. After harvesting, part of this external nitrogen remains in soil and is used by subsequent crops. This implies that producers would gain from lowering the amount of nitrogen fertilizer in their fields. In this study, stochastic simulation is used to generate probability distributions of net present value for alternative rotations by Simetar software. Moreover, the alternative rotations were ranked applying stochastic dominance with respect to function (SDRF) and stochastic efficiency with respect to function (SERF). The results of both procedures showed that cereals-oilseed with onion and legume rotation is most preferred for risk-neutral decision makers and cereals–oilseed with legumes rotation is most preferred for risk-averse decision makers. Therefore, including a legumes crop in the rotation can reduce nitrogen required by a subsequent crop and so increase the net present income associated with that rotation.
Article history:
Received 28 April 2014 Accepted 5 December 2016 Available online 24 September 2017
Keywords:
Stochastic budgeting Stochastic dominance Stochastic efficiency Stochastic simulation
INTRODUCTION
Agricultural economists have studied risk management in several ways. A large part of the previous research has generally been an explanation of how risk management strategies are effectively used and are based on expected utility frameworks or stochastic dominance. Traditionally, agricultural economists tended to look at yield risk and price risk separately. In many previous studies, simulation have been used to procreate distributions for key output variables, e.g., Bailey and Richardson (1985); Harris and Mapp (1986); Pandey (1990); Zuniga et al. (2001); Coble et al.(2003); Ribera et al.(2004) and Lien et al. (2007). Simulating the KOVs1provides an estimate of the range of possible
outcomes based on the user’s parameters and input assumptions. The stochastic simulation also allows the decision maker to consider risk by analyzing the possible outcomes based on the probability distributions of KOVs for risky alternatives.
Hignight et al. (2010) evaluated production cost, crop yield and economic risk of no-tillage and conventional-tillage in five rice-based cropping systems. They simulated yields, crop prices, and key input prices to create net return distributions and SERF used to evaluate profitability and risk efficiency.
McLellan and Carlberg (2010) used stochastic budgets for four alternative crop rotations. They simulated net returns associated with each rotation by
1Key Output Variables
Simetar and ranked risky alternatives by stochastic dominance and stochastic efficiency.
In the present study, the interactions of four alternative rotations in Fars province are examined to find out how uncontrolled variables (yield and price) affect net present values and which rotation is most beneficial to producers according to alternative risk aversion preferences. In this context, the objective of this study was to determine which rotation is most efficient in Fars at particular risk aversion levels.
MATERIALS AND METHODS Stochastic Simulation
Simulation models are empirically defined as either deterministic or stochastic based on the existence of risky variables in the analysis (Richardson, 2008). Decision makers can generate distribution of KOV using stochastic simulation and survey about how their decisions are affected by particular input variables. In a stochastic simulation model, risk is added to the random variables, so the most likely outcome can be observed. In order to estimate the most acceptable outcome, iterations number in the simulation should be specified. Each time that the model is solved, an estimate of the KOV is obtained. By combining all KOV simulated values, KOV probability distribution can be generated and the risk of this variable can be measured.
42 Because of the fact that agricultural producers are
exposed to several uncontrolled and risky variables such as yield and price changes over time, the stochastic simulation models are used in this study. Moreover, the Simetar that is developed by Richardson et al. (2000) as an Excel adds-in computer program is used to simulate the crop rotation model. The multivariate empirical probability distributions are used to estimate historical correlation between the stochastic variables (crop prices, crop yields and nitrogen application levels) and the probability distributions of these random variables. The multivariate distributions are used in cases there are several random and statistically dependent input variables Generally, the multivariate empirical distribution can be used when there are 7 to 10 historical observations (Richardson, 2008). Given the assumption that data are empirically distributed, it prevents forcing of a specific distribution for stochastic variables, and the ability of the model does not limit to deal with correlation and heteroskedasticity (Richardson et al., 2000).
Simulation and Ranking Risky Alternatives
The present study uses simulation model to generate probability distributions of net present value for alternative rotations (NPV). The simulation model is composed of five parts:
1) input data (which contains the deterministic enterprise budgets for each of the crops considered in the alternative rotations) and stochastic random variables (crop prices, crop yields, nitrogen application levels), 2) estimation of the parameters for the stochastic variables to be simulated, 3) simulation of four crop rotations, 4) simulation model (in this part, the deterministic and stochastic variables are used, and a NPV distribution is estimated for 4 crop rotations), 5) the alternative rotations are ranked using stochastic dominance with respect to function (SDRF) and Stochastic Efficiency with Respect to Function (SERF). Ranking the alternative crop rotations using the Cumulative Distribution Functions (CDF) and the probabilities of achieving target values is not complete because these two methods ignore farmers’ preferences for income and risks. So, in this study, we applied utility-based risk ranking procedures, by results of a simulation model. These procedures are advantageous because they merge the decision makers' preferences for risk. The utility-based ranking procedures applied to the simulation model results include: FSD, SSD2, SDRF3,
CE4and SERF5. As a rule, when two of the present value
net returns CDFs cross at the same points in the graph, the FSD ranking method cannot be used (Richardson et al., 2000). The stochastic dominance, with respect to function (SDRF), is used to compute utility values for each estimation of the NPV. The weighted utilities are summed and used to rank the different alternatives.
2Second Stochastic Dominance
3-Stochastic Dominance with Respect to Function 4- Certainty Equivalent
5-Stochastic Efficiency with Respect to Function
Also, the stochastic efficiency method (SERF) is applied to the crop rotation model because it lets both more discriminating ranks of alternatives and the computation of a certain equivalent (CE) for each rotation. In SERF method, the negative exponential utility function is assumed to be the form of the producers’ utility function. In order to use this utility function SERF, the range of absolute risk aversion coefficients should be estimated.
Input data in the model include area under cultivation and production costs. Stochastic variables are crop yield, crop price and amount of nitrogen fertilizer used. We used deterministic and stochastic variables to evaluate KOV by:
( ) ( ( ))
( ) ( )
1 1 1
n
i i i i i
t t
i
TR AH TC N NP AH
NPV
R R
=
× + × ×
=
+ + (1)
Where TRiis total revenue (Rialsper ha; approximately
1 USD = 35000 Rials in 2016), TCiis total cost (Rials
per ha), AHiis area planted (ha), N is nitrogen fertilizer
used (kg per ha), NP is price of nitrogen fertilizer (Rials per kg), R is discount rate, t and i represent time and year, respectively.
For this purpose, four rotations were assumed for a hypothetical farm in Fars province. Then, net present return for each rotation was simulated by Simetar and compared with each other. It was assumed that the crop is sold after harvesting (at the current available price), and there was no carryover from one year to the next. The four rotations are represented in Table 1. Legumes were not cultivated in second rotation but other three rotations contain legumes and thus lead to nitrogen fixation in the soil.
43
Table 1. Alternative crop rotations in Fars, Iran
Rotation Year 1 2 3 4 5Month 6 7 8
1 Canola
Cereals–oilseed with legume rotation 2 Maize Pea
3 Sunflower Wheat
4 Fallow land Barley
1 Maize Sugar beet
Rotation without legume crops 2 Sunflower Barley
3 Tomato Fallow land
4 Rice
1 Onion Wheat
Cereals-oilseed with onion and legume 2 Fallow land Canola
3 Fallow land Pea
4 Sunflower Barley
1 Lentil Canola
Cereals with rice and legume 2 Rice
3 Fallow land Pea Wheat
4 Fallow land Barley
The data used in this study included the price and yield of crops, production costs, price and consumption of nitrogen fertilizer and were obtained from the Iranian Ministry of Jahad-Agriculture for the period of 2000-2008. A multivariate empirical distribution was estimated for each random variable (crop prices, crop yield, and nitrogen application levels) utilizing these data. Then, a stochastic multivariate empirical number was obtained and the deterministic budget was applied. The net present value of total revenue and total cost of each rotation was calculated by using stochastic budget (see Equation 1). In this study, KOV is the present value of net return (NPV) for each rotation.
RESULTS AND DISCUSSION
The summary statistics for the results of simulation (in the 1,000 iterations) are showed in Table 2.As shown, the third rotation had the largest mean of NPV compared with the other two rotations. Also, the second rotation had a negative mean of NPV indicating no economic justification of this option.
The graph of Cumulative Distribution Functions (CDF) allows us to compare the relative risk of each distribution of the net present value of returns. The FSD ranking method cannot be used when two CDFs of the NPV cross each other at one point.
The probabilities of target values can be estimated for each of the crop rotations using the results of the simulation model. These estimates show to the decision makers, the probabilities of achieving net present value less than a specified target value; in other words, these
estimates show the probabilities of NPV to be below the target value. The decision maker is expected to select the scenario that has the lowest probability of achieving net present value less than a pre-determined netreturnlevel. The findings of this analysis are shown in Table 3.The lower and upper cut-off values are equal to 0 and 54 million Rials, respectively, and thus the probabilities of achieving NPV less than zero, between zero to 54 million Rials and more than 54 million Rials for each scenario are represented in the Table.
Based on the probabilities of target values, the cereals-oilseed with onion and legume rotation (rotation 3) would be the selected alternative, as only 37% of the time, the NPV of this rotation was expected to fall below zero. Also, the worst rotation is the rotation without legume crops (rotation 2) -when the NPV was estimated to fall below zero 70% of the time. The alternative rotations were ranked using SSD and presented in Table 4.
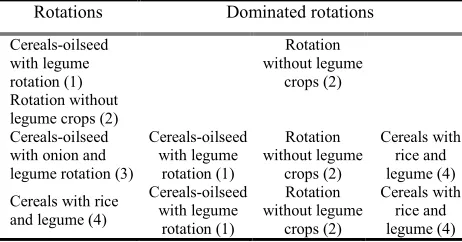
The first column in Table 4indicates alternative crop rotations and the rotations that appear in the following columns are those that are dominated by the crop rotation in the first column.
Based on the SSD ranking results, rotation 3 is preferred to all other rotations. The rotation without legume crops (rotation 2) was the least preferred rotation because it did not dominate any of other rotations. Therefore, according to SSD criterion, the best options were rotation 3, rotation 4, rotation 1 and rotation 2, respectively.
As shown in Table 5, a preferred alternative was calculated and presented for both the lower risk aversion coefficient and the upper risk aversion coefficient.
Table 2. Summary statistics for distributions of crop rotations
44
Table 3. Probability of less and more than target value
NPV1 NPV2 NPV3 NPV4 Prob<0 0.51 0.70 0.37 0.48 0<Prob<54 million
Rials 0.32 0.08 0.08 0.25 Prob>54 million
Rials 0.17 0.22 0.55 0.27
Sum 1 1 1 1
Table 4. Second Degree Dominance (SSD)
Rotations Dominated rotations Cereals-oilseed
with legume rotation (1)
Rotation without legume
crops (2) Rotation without
legume crops (2) Cereals-oilseed with onion and legume rotation (3)
Cereals-oilseed with legume
rotation (1)
Rotation without legume
crops (2)
Cereals with rice and legume (4) Cereals with rice
and legume (4)
Cereals-oilseed with legume
rotation (1)
Rotation without legume
crops (2)
Cereals with rice and legume (4)
Table 5. Preferred alternatives resulting from SDRF ranking
Crop rotation Level of Preference RL=0 RL=0.0000004
1 Cereals-oilseed with onion and legume Preferred Most Preferred 3rd Most
2 Cereals with rice and legume 2nd Most Preferred 2nd Most Preferred
3 Cereals –oilseed with legume rotation Preferred 3rd Most Preferred Most
4 Rotation without legume crops Preferred Least Preferred Least
In this Table, the second and third columns showed results of ranking each rotation for neutral and risk-averse decision makers, respectively. According to Table 5, cereals-oilseed with onion and legume rotation was estimated to be the most preferred rotation amongst risk neutral decision makers. If the crop of this rotation is not available or was not selected by the producer, then the next most preferred alternative will be the cereals with rice and legume crop rotation in this risk ranking. But for risk-averse decision makers, cereals-oilseed with legume rotation is realized to be the most preferred rotation after which, cereal with rice and legume rotation is the most preferred alternative. Therefore, in both risk neutral and risk-averse decision makers, rotations without legume crops are the worst rotation. Fig. 1 showed the results of the SERF method used to simultaneously compare four alternatives in the range of 0 to 0.0000004 of risk aversion coefficients.
The SERF chart explains how the preferred alternative(s) changes over the range of risk aversion coefficients. The X-axis represents the risk aversion coefficients and Y-axis represents the CE value.
From the SERF chart, it can be concluded that with increasing risk aversion coefficient, certainty equivalent value reduces and is to be negative. Each CE line that is
above all the other CE lines corresponds to a preferred alternative. So, the cereals-oilseed with onion and legume rotation (NPV3) is the preferred alternative as it
has the largest CE value until 0.00000075 risk aversion coefficient. After this risk aversion coefficient, the CE line for the cereals–oilseed with legume rotation (NPV1)
is above all the other CElines, but with negative certainty equivalent value. Also, because certainty equivalent of cereals with rice and legume rotation was negative and below all the other CE lines, we did not include it.
Fig. 1. Ranking alternative with SERF method
CONCLUSIONS
The results of this study have implications for risk-averse producers in Fars province in Iran. These producers may be able to increase their net present value of return by including a legume cover crop in their current rotation. The producers will be able to benefit economically through higher profit margins. Also, it would be expected to take advantage of the agronomic benefits associated with legume cover crops and to benefit from the health of the environment. The results of the simulation procedure showed that including legume cover crops in rotation increases net present value of return and causes the rotation to have positive net present value. But, crop rotations that exclude legume crops have negative net present values. We ranked four rotations with SDRF and SERF methods, the results of which showed that cereals-oilseed with onion and legume is the preferred alternative based on the two methods. However, when the producer is risk-averse, cereals-oilseed with legume is the best alternative. Therefore, including a legume crop in rotation increases the net present income associated with that rotation in Fars province.
NPV1
NPV3 NPV4
-15,000,000.00 -10,000,000.00 -5,000,000.00 0.00 5,000,000.00 10,000,000.00
0 0.0000001 0.0000002 0.0000003 0.0000004 0.0000005
C
er
ta
in
ty
E
qu
iv
al
en
t(
C
E
)
ARAC
45 REFERENCES
Bailey, D.V., & Richardson, J.W. (1985). Analysis of selected whole-farm simulation approach. American Journal of Agricultural Economics, 65, 813-820.
Coble, K.H., Zuniga, M. & Heifner, R. (2003). Evaluation of the interactions of risk management tools for cotton and soybeans. Agricultural Systems, 75, 323-340.
Entz, M. (2009). Personal Communication. Winnipeg: University of Manitoba Department of Plant Science. Harris, T.R., & Mapp, H.P. (1986).A stochastic dominance
comparison of water-conserving irrigation strategies. American Agricultural Economics Association, 68, 298-305.
Hignight, J.A., Watkins, K.B. & Anders, M.M. (2010). An economic risk analysis of tillage and cropping system on the Arkansas Grand Prairie. Selected paper prepared for presentation at the Southern Agricultural Economics Association Annual Meeting.
Lien, G., Størdal, S., Hardaker, J.B., & Asheim, L.J. (2007). Risk aversion and optimal forest replanting: A stochastic Efficiency study. European Journal of Operational Research, 181(3), 1584-1592.
McLellan, A., & Carlberg, J. (2010). The economics of annual legume and double legume cover cropping in Southern Manitoba. Selected Paper, Southern. Agricultural Economics Association Annual Meeting February, 6-9. Pandey, S. (1990). Risk-efficient irrigation strategies for
wheat. Agricultural Economics, 4, 59-71.
Ribera, L.A., Hons, F.M., & Richardson, J.W. (2004). Tillage and cropping systems. Agronomy Journal, 96, 415-424. Richardson, J.W. (2008). Simulation for applied risk
management with an introduction to SIMETAR. College Station: Department of Agricultural Economics, Texas A&M University.
Richardson, J.W., Klose, S.L., & Gray, A.W. (2000). An applied procedure for estimating and simulating multivariate empirical (MVE) probability distributions in farm-level risk assessment and policy analysis. Journal of Agriculture and Applied Economics, 32(2), 299-315. Zuniga, M., Coble, K.H., & Heifner, R. (2001). Evaluation of
46
! "# $ % & "' (
) *+ ,- !
& .$-!
.
01 2 3 " 4 3 %
$5
"# $ % $
67. !
&3 8 01 .
9 ! -1 : ; * 71
9 <3 6= 9 5$ >; ? %,- @($
Simetar
. !
.$-1 A%
) ; * @3 C = D - @($
SDRF
(
7 1 ; *
)
SERF
(
FC " %= G1 $% . % !
-% C H
I 5* " 4 % 4 JK1
FC 6
-% C I 5*
-" 4 % 4 JK1
>1 4 M N 01 . % !
9 *+
%
" > O & 9 *+ % "# $ %
.
:
: ; 1 Q1
8 / 2 / 1393
:= 1WHQ1
15 / 9 / 1395
: - $- Q1
2 / 7 / 1396
:
N ; *
! -; *
; * @3 C 1 ; *