www.ann-geophys.net/30/1259/2012/ doi:10.5194/angeo-30-1259-2012
© Author(s) 2012. CC Attribution 3.0 License.
Annales
Geophysicae
Features of highly structured equatorial plasma irregularities
deduced from CHAMP observations
C. Xiong1,2, H. L ¨uhr1, S. Y. Ma2, C. Stolle3, and B. G. Fejer4
1Helmholtz Centre Potsdam, GFZ German Research Centre for Geosciences, Telegrafenberg, 14473, Potsdam, Germany 2Department of Space Physics, College of Electronic Information, Wuhan University, Wuhan 430079, China
3National Space Center, Technical University of Denmark, 2100 Copenhagen, Denmark 4Center for Atmospheric and Space Science, Utah State University, Logan UT 84322, USA
Correspondence to: C. Xiong ([email protected])
Received: 18 March 2011 – Revised: 2 August 2012 – Accepted: 3 August 2012 – Published: 24 August 2012
Abstract. In this study five years of CHAMP (Challenging Mini-satellite Payload) fluxgate magnetometer (FGM) data is used to investigate the characteristics of Equatorial Plasma Bubbles (EPBs). We filtered the FGM data by using band-passes with four different cut-off periods to get the EPBs with different maximum spatial scale sizes in the meridional plane ranging from 76–608 km. Associated with the EPB ob-servations at about 400 km, the typical altitude of CHAMP during the year 2000–2005, we also investigate the post-sunset equatorial vertical plasma drift data from ROCSAT-1 (Republic of China Satellite ROCSAT-1). Since the height of the F-layer is highly correlated with the vertical plasma drift and solar flux, we sorted the ROCSAT-1 data into different groups by F10.7. From the integrated vertical drift we have estimated the post-sunset uplift of the ionosphere. By com-paring the properties of EPB occurrence for different scale sizes with the global distribution of plasma vertical uplift, we have found that EPBs reaching higher altitudes are more structured than those which are sampled by CHAMP near the top side of the depleted fluxtube. Such a result is in ac-cord with 3-D model simulations (Aveiro and Hysell, 2010). Small-scale EPB structures are observed by CHAMP when the irregularities reach apex heights of 800 km and more. Such events are encountered primarily in the Brazilian sector during the months around November, when the post-sunset vertical plasma drift is high.
Keywords. Ionosphere (Equatorial ionosphere; Ionospheric irregularities)
1 Introduction
An important aspect of EPBs is their latitudinal distribu-tion. Stolle et al. (2006) found a latitudinal distribution of EPB occurrences detected by CHAMP at 400 km altitude that peaks at ±9.5° magnetic latitude (Mlat) with a standard de-viation of 4.5° in both hemispheres. This is in apparent con-trast with EPB occurrence rates deduced from ROCSAT-1 (∼600 km) and DMSP (840 km) observations, which peak at the geomagnetic equator and decrease symmetrically to ±20° magnetic latitude (Burke et al., 2004). Xiong et al. (2010) have investigated the EPB from electron density data ob-tained by the CHAMP and GRACE satellites. Their results have shown that at CHAMP altitude (∼400 km), the EPB occurrence peaks on average at−8.74º and 9.47º Mlat in the Southern and Northern Hemisphere and at−6.96º and 8.25º Mlat at GRACE altitude (∼500 km), respectively. Compar-ing the results from the two satellite missions, it is observed that at higher altitude the EPBs appear closer to the magnetic equator. This was interpreted by Xiong et al. (2010) as an indication that the plasma depletion associated with an EPB evolves along magnetic fluxtubes. Under these conditions the apex height of EPBs can be estimated, and it is found in most cases to range around 600 km, reconciling the different lati-tudes of occurrence peaks from CHAMP and ROCSAT-1 ob-servations.
By operating the ALTAIR radar, which is located in the Kwajalein Atoll, Marshal Islands at a magnetic dip latitude of 4.3° N, in a latitude scan incoherent scatter mode, Tsun-oda (1980) present direct evidence that plasma bubbles are indeed magnetic field aligned and extend over at least 10° of magnetic latitude. Furthermore, Makela et al. (2005) present two examples using data collected by a ground-based imag-ing system on Haleakala Volcano on Maui, Hawaii, and in-situ density plasma density measurements taken at 600 km by ROCSAT-1. In their results the composite images were mapped along the magnetic field lines to 600 km altitude. Excellent agreement was found between the location of the depletions estimated by the composite imaging technique and the ROCSAT-1 data, even in the conjugate hemisphere. Yokoyama et al. (2007) reported a concurrent observation of radar echo and plasma irregularities along the same meridian in opposite hemispheres but at magnetically conjugate loca-tions.
It is well know that EPBs can have scale sizes from a few meters to thousands of km, due to different generation and developing EPB conditions (Zargham and Seyler, 1989; Hy-sell and Seyler, 1998; HyHy-sell, 2000). Singh et al. (1997) pre-sented some examples from Atmosphere Explorer E (AE-E) data showing plasma bubbles developing from wavy ion den-sity structures in the bottom side F-layer. The wavy struc-tures mostly had east–west wave lengths of 150–880 km and the ionization trough in the wavy structures later broke up into either multiple bubble patches or a single bubble. In the multiple bubble patches, intra-bubble spacing varied from 55 to 140 km. In a fully developed equatorial spread F case, east–west wavelengths from 690 km down to about 0.5 km
were present simultaneously. Xiong et al. (2010), by ana-lyzing the electron density data of CHAMP and GRACE satellites, found that both satellites may detect more than one electron depletion regions along one meridional passage over the low latitude regions. Stolle et al. (2006) have used high-resolution CHAMP magnetic field readings (50 Hz) to investigate the fine structure of detected EPB events in the meridional plane. Their presented event exhibited structures as small as about 50 m. Narrowest features were commonly observed at the poleward boundaries of a series of EPBs.
The close relationship between EPB occurrence rate and the amplitude of the vertical plasma drift, or the layer height, was shown empirically in several studies (Farley et al., 1970; Fejer et al., 1999; Stolle et al., 2008). Fejer et al. (2008) used ROCSAT-1 data to develop a model for the vertical plasma drift, which was used by Stolle et al. (2008) for their analysis. Jayachandran et al. (1993) investigated HF Doppler radar and ionosonde measurements in India, and stated that the height of the F-layer, determined by the evening vertical plasma drift, is the deciding factor for an EPB onset. They also stated that the R-T growth rate maximizes at the time of the peak height rather than at the time of peak velocity. Stolle et al. (2008) and Su et al. (2008) have confirmed that the EPB occurrence rate has a higher correlation with the inte-grated vertical plasma drift velocity than with the peak value of the vertical plasma drift velocity during the pre-reversal enhancement (PRE).
Questions we want to address are the spatial scale distribu-tion of EPBs, and what are the characteristics of the different scale sizes in the meridional plane, and how do they depend on prevailing conditions? A near-polar orbit satellite such as CHAMP provides us excellent opportunities to study the lat-itudinal structures of EPBs. For this paper we have used the first five years of CHAMP magnetic field data and ROCSAT-1 ion drift data to verify that the high vertical plasma drift plays an important role for the small-scale size EPB to rise to the CHAMP altitude (about 400 km). Results obtained pro-vide first observational epro-vidence that some EPBs are highly structured at the bottom side.
2 Data
The CHAMP satellite was launched on 15 July 2000 into a circular, near-polar (inclination=87.3°) orbit with an ini-tial altitude of about 450 km. Its local time changes by about 5.5 min per day, sweeping all time zones in 131 days (Reig-ber et al., 2002). After 3718 days in orbit, it reentered the Earth’s thermosphere and burned up on 19 September 2010. In this paper we use primarily the fluxgate magnetometer (FGM) data to investigate EPBs by their magnetic signa-tures. In order to avoid false detections due to storm-related magnetic pulsation effects, we have selected quiet to mod-erately disturbance times as indicated byKp≤3.5. In
addi-tion plasma density readings from the Planar Langmuir probe
Table 1. The low-pass and high-pass filters with different cut-off
periods used for detecting different scale size EPBs.
Low-pass High-pass Scale size
(LP) period (HP) period (km)
8 s 40 s 120–608
4 s 20 s 60–304
2 s 10 s 30–152
1 s 5 s 15–76
(PLP) data are also taken into account. The sparse sampling, once per 15 s, however, provides only a coarse overview. Here we consider data from the more active 5 yr from Au-gust 2000 to July 2005.
For the EPB detection approach from FGM data (vector magnetic field data at high resolution), we follow the ap-proach introduced by Stolle et al. (2006). In order to iden-tify the small magnetic signatures of EPBs it is necessary to subtract the main field and the large-scale magnetospheric fields from the original readings. The residual field is trans-formed into Mean-Field-Aligned (MFA) coordinates, com-prising two transverse components and one field-aligned. Only the latter, parallel componentBµ, is of interest here. As in Fig. 3 of Stolle et al. (2006), the parallel component,Bµ, is first filtered with a band pass filter and then rectified. After that a threshold is set at LU=0.20 nT. For an EPB to be de-tected, the rectified amplitude has to reach above LU for sev-eral successive readings. In this paper we have applied four different band-pass filters toBµ in order to separate EPBs of different scale sizes. The cut-off periods of the filters are listed in Table 1. For example, in the smallest range (1 s av-erage low-pass filter and 5 s avav-erage high-pass filter) only an along-track wavelength of less than 76 km is considered. But ifBµis first smoothed by an 8 s average and then high-pass filtered with 40 s averages, EPB structures with wavelengths 120–608 km will get through.
ROCSAT-1 was launched on 27 April 1999 into a circular orbit at an altitude of 600 km and with an inclination of 35◦. It sampled the dip equator at all local times in 25 days. Based on the measurements taken by the Ionospheric Plasma and Electro-dynamic Probe Instrument (IPEI) on board the satel-lite, Fejer et al. (2008) constructed a climatological model of the equatorial F-region vertical plasma drift. In this paper, we have used the same vertical drift data from July 1999 to June 2004 but resampled them.
Similar to FGM data, the vertical drift is only used from periods of geomagnetically quiet conditions (Kp≤3.5).
These data were grouped for every month into overlapping 2 month bins and sorted into overlapping 30º wide longi-tude bins. The local time (LT) distribution is discretized into 30 min steps derived from overlapping 1-h local time bins except for the 17:00–22:00 LT sector, where 30 min bins are used and 15 min resolution is obtained, in order to
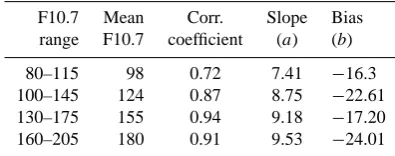
ac-Table 2. The solar flux ranges and the relationship betweenSPRE
andvzPfor different solar flux levels.
F10.7 Mean Corr. Slope Bias
range F10.7 coefficient (a) (b)
80–115 98 0.72 7.41 −16.3
100–145 124 0.87 8.75 −22.61
130–175 155 0.94 9.18 −17.20
160–205 180 0.91 9.53 −24.01
count more accurately for the rapidly changing evening pre-reversal drift enhancements (Fejer et al., 2008). For each lo-cal time, month, and longitude bin, we have grouped the drift data into 4 solar flux bins. The F10.7 ranges of these groups and the average flux values for each group are listed in Ta-ble 2.
3 Observations
The purpose of this paper is to investigate EPBs of different spatial scale sizes in the meridional plane. As described in Sect. 2, a dedicated program is applied to detect EPB events from CHAMP FGM data. Figure 1 shows two examples of EPBs encountered by CHAMP. The top panel presents elec-tron density from CHAMP PLP data. Within the gray shaded windows, we can see electron density depletions. It indicates that the satellite encountered a series of EPBs on this orbit. The middle panel presents the variations of the magnetic field componentBµ, parallel to the background field, which cor-relates well with the electron density depletion. This is at-tributed to the diamagnetic effect of dense plasma (L¨uhr et al., 2003). The bottom panel shows the spectrum of the mag-netic signature over the latitude range affected by EPBs (±17º magnetic latitude). Comparing the two EPB events, we find much more fine structure in the left frame, which is taken over Brazil than in the right frame, which has been recorded over eastern Asia. The visual impression is confirmed by the spectra of the magnetic field variations. The spectral ampli-tudes are about 10 times larger from the Brazilian event.
[image:3.595.88.245.94.172.2]22
447
Figure 1. Two examples of EPB detections by CHAMP. Shown are electron density changes over the
448
pass (top), the corresponding variation of the parallel component, Bµ (middle) and the spectrum of Bµ
449
(bottom) for two EPB events.
450
451
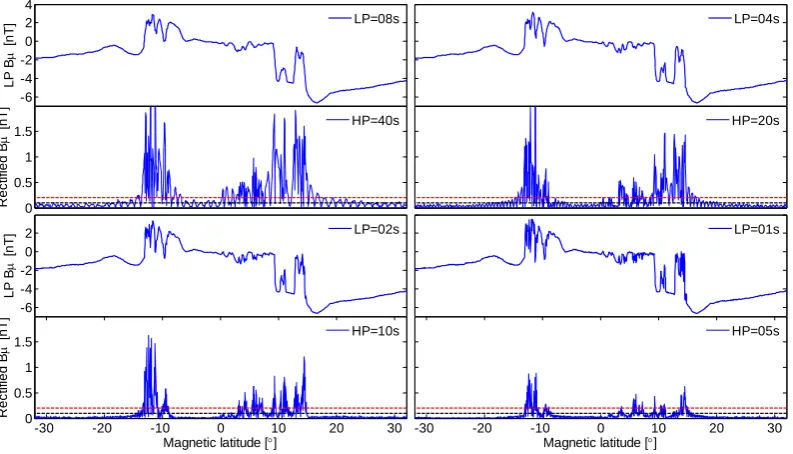
Figure 2. Time series of the parallel magnetic field component
𝐵𝜇
from Fig. 1, middle panel, after
452
applying different low-pass filters (upper panels);high-pass filtered and rectified signals (lower panels).
453
The red and black dashed lines in the lower panels represent the upper and lower thresholds applied for
454
the automatic EPB detection process.
455
0 1 2 3 4 5 N e [ 1e1 2* m -3]CHAMP 2002-11-23 23.63UT 20.05LT 306.34E
-40 -30 -20 -10 0 10 20 30 40
-6 -4 -2 0 2
Magnetic latitude []
Bu
[
nT
]
0.05 0.1 0.15 0.2 0.25 0.3 0.35 0.4 0.45 0.5
0 0.1 0.2 0.3 0.4 0.5 Frequency (Hz) Spe c trum am plit ude [ nT ] 0 0.5 1 1.5 2 2.5 N e [ 1e1 2* m -3]
CHAMP 2004-04-14 14.45UT 21.60LT 107.26E
-40 -30 -20 -10 0 10 20 30 40
-3 -2.5-2 -1.5-1 -0.50 0.5
Magnetic latitude []
Bu
[
nT
]
0.05 0.1 0.15 0.2 0.25 0.3 0.35 0.4 0.45 0.5
0 0.1 0.2 0.3 0.4 0.5 Frequency (Hz) Spe c trum am plit ude [ nT ] -6 -4 -2 0 2 4 L P B [n T ] LP=08s 0 0.5 1 1.5 R e c ti fi e d B [n T ] HP=40s LP=04s HP=20s -6 -4 -2 0 2 L P B [n T ] LP=02s
-30 -20 -10 0 10 20 30
0 0.5 1 1.5
Magnetic latitude []
R e c ti fi e d B [n T ] HP=10s LP=01s
-30 -20 -10 0 10 20 30
Magnetic latitude []
HP=05s
Fig. 1. Two examples of EPB detections by CHAMP. Shown are electron density changes over the pass (top), the corresponding variation of
the parallel component,Bµ(middle) and the spectrum ofBµ(bottom) for two EPB events.
22 447
Figure 1. Two examples of EPB detections by CHAMP. Shown are electron density changes over the
448
pass (top), the corresponding variation of the parallel component, Bµ (middle) and the spectrum of Bµ
449
(bottom) for two EPB events.
450
451
Figure 2. Time series of the parallel magnetic field component 𝐵𝜇 from Fig. 1, middle panel, after
452
applying different low-pass filters (upper panels);high-pass filtered and rectified signals (lower panels).
453
The red and black dashed lines in the lower panels represent the upper and lower thresholds applied for
454
the automatic EPB detection process.
455 0 1 2 3 4 5 N e [ 1e1 2* m -3]
CHAMP 2002-11-23 23.63UT 20.05LT 306.34E
-40 -30 -20 -10 0 10 20 30 40 -6
-4 -2 0 2
Magnetic latitude []
Bu
[
nT
]
0.05 0.1 0.15 0.2 0.25 0.3 0.35 0.4 0.45 0.5 0 0.1 0.2 0.3 0.4 0.5 Frequency (Hz) Spe c trum am plit ude [ nT ] 0 0.5 1 1.5 2 2.5 N e [ 1e1 2* m -3]
CHAMP 2004-04-14 14.45UT 21.60LT 107.26E
-40 -30 -20 -10 0 10 20 30 40
-3 -2.5-2 -1.5 -1 -0.50 0.5
Magnetic latitude []
Bu
[
nT
]
0.05 0.1 0.15 0.2 0.25 0.3 0.35 0.4 0.45 0.5 0 0.1 0.2 0.3 0.4 0.5 Frequency (Hz) Spe c trum am plit ude [ nT ] -6 -4 -2 0 2 4 L P B [n T ] LP=08s 0 0.5 1 1.5 R e c ti fi e d B [n T ] HP=40s LP=04s HP=20s -6 -4 -2 0 2 L P B [n T ] LP=02s
-30 -20 -10 0 10 20 30
0 0.5 1 1.5
Magnetic latitude []
R e c ti fi e d B [n T ] HP=10s LP=01s
-30 -20 -10 0 10 20 30
Magnetic latitude []
HP=05s
Fig. 2. Time series of the parallel magnetic field componentBµfrom Fig. 1, middle panel, after applying different low-pass filters (upper panels); high-pass filtered and rectified signals (lower panels). The red and black dashed lines in the lower panels represent the upper and lower thresholds applied for the automatic EPB detection process.
into groups of shorter scale. The small-scale EPBs exhibit the largest amplitudes at the poleward edges.
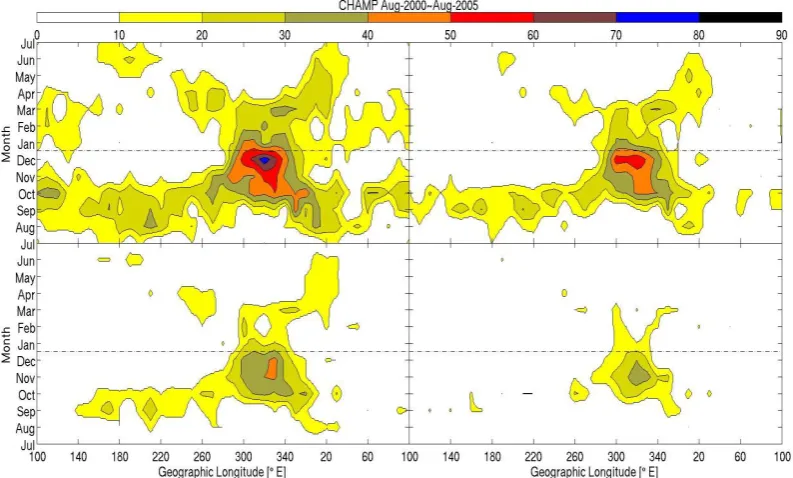
As has been shown in many previous papers, the largest occurrence rates of EPBs are observed above Brazil around December solstice months (e.g. Burke et al., 2004; Stolle et al., 2006; Su et al., 2008; Xiong et al., 2010). Figure 3 shows the longitudinal/seasonal (S/L) distribution of EPBs detected by the method described above, separately for the four band-pass filter groups. Detected EPBs are sorted into bins of 1 month and 10º in longitude for the determination of the oc-currence rates. Rates have been determined by dividing the number of passes with positive detections by the total
num-ber of orbits passing over that longitude bin. For all four dif-ferent band-pass filters, the largest occurrence rates are found between 300–340º longitudes around November and Decem-ber. Otherwise the occurrence rates are severely reduced to-wards smaller scales. Only for the largest scales we obtain a S/L distribution similar to previous studies. It is worth noting that the mean value of the solar flux prevailing during days of positive detections is increasing gradually from large-scale to small-scale events. We obtain average F10.7 values of 159, 167, 171 and 176 for the four filter groups, respectively. This indicates that for the more structured EPBs to reach the alti-tude of CHAMP a higher solar flux level is needed.
[image:4.595.52.540.67.226.2] [image:4.595.101.498.277.504.2]23 456
Figure 3. The seasonal / longitudinal distribution of EPBs occurrence rates for different meridional scale
457
size, using different band-pass filters: LP=8s, HP=40s (top left); LP=4s, HP=20s (top right); LP=2s,
458
HP=10s (bottom left); LP=1s, HP=5s (bottom right).
459
460
Figure 4. The relationship between the peak value of the vertical plasma drift velocity and the integrated
461
vertical plasma drift velocity for the solar flux range F10.7=130-175 (average F10.7=155).
462
Fig. 3. The seasonal/longitudinal distribution of EPBs occurrence rates for different meridional scale size, using different band-pass filters:
LP=8 s, HP=40 s (top left); LP=4 s, HP=20 s (top right); LP=2 s, HP=10 s (bottom left); LP=1 s, HP=5 s (bottom right).
In order to prove this suggestion we have also investi-gate the vertical plasma drift, VZ, data of ROCSAT-1. Su
et al. (2008) and Stolle et al. (2008) have shown that EPB occurrence rates show a good correlation with the peak ver-tical plasma drift during the pre-reversal enhancement,VZP. But the correlation between EPB occurrence rate and the in-tegrated vertical velocity,SPRE, is even higher. Following the approach of Stolle et al. (2008) we get
SPRE=
t2
Z
t1
VZ·dt (1)
wheret1 is the local time with the first occurrence of up-ward plasma drift (positive value ofVZ) after the afternoon
local minimum (between noon and postsunset maxima), and
t2is the time of polarity switch in vertical plasma drift from upward to downward.SPREcontains both information about the vertical plasma drift velocity and the extend to which the plasma is lifted up. At greater height the ion/neutral colli-sion frequency is reduced. Therefore, the growth rate of in-stabilities is larger (Ossakow, 1981). Stolle et al. (2008) have identifiedSPREas the preferred indicator for EPB generation. In order to find the relation between SPRE and the vertical plasma drift we have correlated the two quantities separately for four solar flux ranges. Results of the analysis are listed in Table 2. The highest correlation coefficient, 0.94, is ob-tained for the solar flux range F10.7=130–175 sfu. Figure 4 shows a scatter plot ofVZPversusSPRE. All the points are rea-sonably well grouped around the regression line. The linear regression has the formSPRE=9.18·VZP−17.20 whereVZPis
23 456
Figure 3. The seasonal / longitudinal distribution of EPBs occurrence rates for different meridional scale
457
size, using different band-pass filters: LP=8s, HP=40s (top left); LP=4s, HP=20s (top right); LP=2s,
458
HP=10s (bottom left); LP=1s, HP=5s (bottom right).
459
460
Figure 4. The relationship between the peak value of the vertical plasma drift velocity and the integrated
461
vertical plasma drift velocity for the solar flux range F10.7=130-175 (average F10.7=155).
462
Fig. 4. The relationship between the peak value of the vertical
plasma drift velocity and the integrated vertical plasma drift
veloc-ity for the solar flux range F10.7=130–175 (average F10.7=155).
given in (m s−1) andS
PREin (km). As can be seen from Ta-ble 2, the slope of the regression line increases when higher solar flux ranges are considered.
[image:5.595.99.496.64.303.2] [image:5.595.307.548.361.524.2]24
463
Figure 5. The seasonal / longitudinal distribution of the integrated vertical plasma drift velocity.
464
[image:6.595.130.466.64.260.2]465
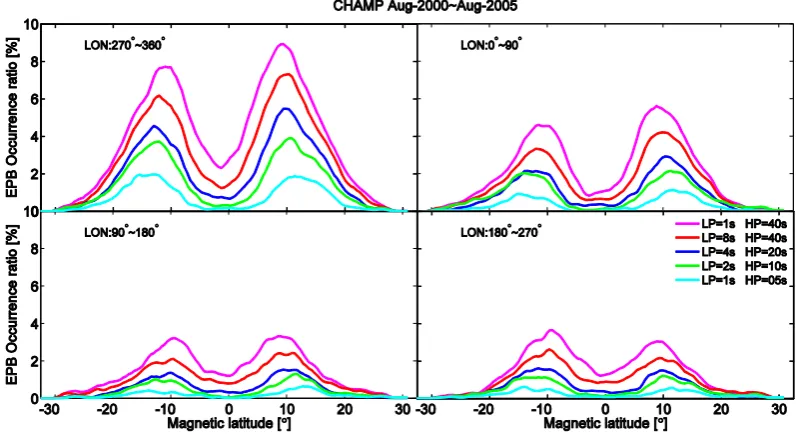
Figure 6. Latitudinal distribution of the EPB Occurrence rate from the different band-passes separately for
466
four longitude sectors.
467
Fig. 5. The seasonal/longitudinal distribution of the integrated vertical plasma drift velocity.
24 463
Figure 5. The seasonal / longitudinal distribution of the integrated vertical plasma drift velocity.
464
[image:6.595.97.496.298.515.2]465
Figure 6. Latitudinal distribution of the EPB Occurrence rate from the different band-passes separately for
466
four longitude sectors.
467
Fig. 6. Latitudinal distribution of the EPB occurrence rate from the different band-passes separately for four longitude sectors.
Fig. 2. It seems that for a given solar flux level, the F-layer in this region is easier to be lifted to higher altitude, where the plasma is obviously more susceptible to the generation of small scale size EPBs.
In a next step we investigate the latitudinal distribution of the EPB occurrence rate following the approach as described by Xiong et al. (2010). EPB signals are sorted into 1º wide latitude bins. Count numbers in each bin are normalized by the total number of satellite passes over that bin. From Fig. 6 we can see that all the occurrence rate profiles from the dif-ferent filters show two symmetric peaks, one north and one south of the magnetic equator. In order to obtain a more quan-titative description of the distribution, we have fitted a
Gaus-sian function separately to each of the peaks. The function is specified as
y=A·exp(−(x−x0) 2
2σ2 ) (2)
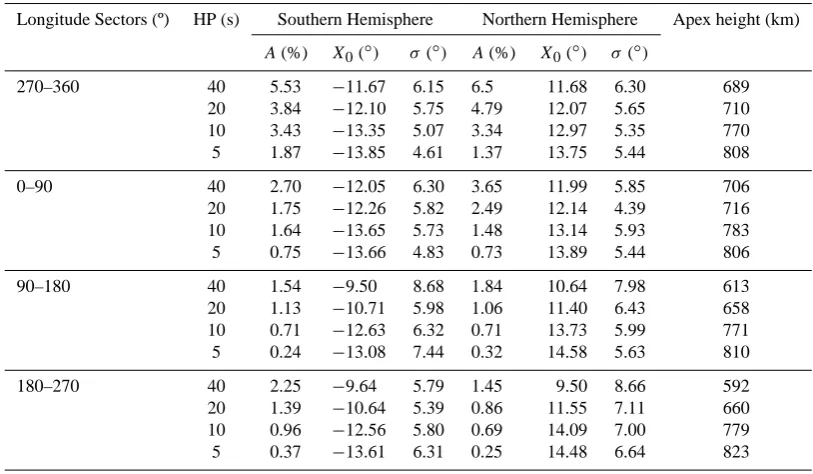
whereAis the peak occurrence rate amplitude,x0is the lat-itude of the peak andσ is the width in degrees of latitude of the distribution. All pairs of distribution peaks are almost symmetrical around the dip equator. The results of the fitting procedure are listed in Table 3. We find a general trend that the more structured EPBs detected at CHAMP altitude has been lifted up higher than the large-scale bubbles. The num-ber of EPB detections differs significantly between the four
Table 3. Parameters of Gaussian fits to the latitude profiles of the EPB occurrence rates separately for four longitude sectors (see Fig. 5).
Longitude Sectors (º) HP (s) Southern Hemisphere Northern Hemisphere Apex height (km)
A(%) X0(◦) σ (◦) A(%) X0(◦) σ(◦)
270–360 40 5.53 −11.67 6.15 6.5 11.68 6.30 689
20 3.84 −12.10 5.75 4.79 12.07 5.65 710
10 3.43 −13.35 5.07 3.34 12.97 5.35 770
5 1.87 −13.85 4.61 1.37 13.75 5.44 808
0–90 40 2.70 −12.05 6.30 3.65 11.99 5.85 706
20 1.75 −12.26 5.82 2.49 12.14 4.39 716
10 1.64 −13.65 5.73 1.48 13.14 5.93 783
5 0.75 −13.66 4.83 0.73 13.89 5.44 806
90–180 40 1.54 −9.50 8.68 1.84 10.64 7.98 613
20 1.13 −10.71 5.98 1.06 11.40 6.43 658
10 0.71 −12.63 6.32 0.71 13.73 5.99 771
5 0.24 −13.08 7.44 0.32 14.58 5.63 810
180–270 40 2.25 −9.64 5.79 1.45 9.50 8.66 592
20 1.39 −10.64 5.39 0.86 11.55 7.11 660
10 0.96 −12.56 5.80 0.69 14.09 7.00 779
5 0.37 −13.61 6.31 0.25 14.48 6.64 823
longitude sectors. However, the latitude of peak occurrences is practically the same for all longitude sectors. For refer-ence, we have added a column in Table 3 giving the apex height of fluxtubes containing the highest occurrence rate. Our observations suggest that CHAMP detects small-scale plasma irregularities only on fluxtubes that have been lifted up high enough. On fluxtubes with lower apex height, large-scale structure are preferably observed at CHAMP altitude.
4 Discussion
The purpose of this study is to investigate the scale size of equatorial plasma bubbles and find out their specific charac-teristics. For achieving this goal we have chosen a statistical approach. CHAMP magnetic field and electron density data over the period August 2000 to July 2005 have been con-sidered for this purpose. Within 5 yr CHAMP provides an even coverage of all local times and seasons. This time in-terval provides, in addition, a good overlap with the vertical plasma drift measurements from ROCSAT-1 (July 1999 to June 2004). Furthermore, these years coincide with the high activity period of solar cycle 23.
For the investigation of the EPB structural scales, we make use of the high-resolution CHAMP magnetic field data. This is done because the electron density is sampled only once per 15 s, corresponding to one sample per 114 km. The relation between plasma density and magnetic field variations can be explained by the diamagnetic effect of dense plasmas. Ac-cording to L¨uhr et al. (2003), changes in total field strength,
1B, can be approximated by
1B=1n·(Te+Ti)·
k
B (3)
wheren is the electron density, Te and Ti are the electron and ion temperatures,kis the Boltzmann constant andBthe ambient magnetic field strength. Here, we assume that the temperatures are about the same inside and outside the bub-bles. It is obvious that the ambient magnetic field strength influences the scaling factor between1nand1B.
For discriminating bubbles of different spatial scales, we have applied four band-pass filters to the magnetic field data. Due to the polar orbit of CHAMP, we obtain only informa-tion about scale length in the meridional plane. The shortest filter considers sizes up to 76 km, the longest up to 608 km. Extending the high pass filter to longer periods (larger scales) causes a severe contamination of the small EPB magnetic signals by magnetic pulsations. We found out that the EPB occurrence distribution derived from plasma density mea-surement (e.g. Xiong et al., 2010) is reproduced best by mag-netic field data, when the 1 Hz samples are high pass filtered with a cut off period of 40 s (∼608 km scale size). For com-pleteness it is noted that our detection algorithm is based on a fixed1n(see Xiong et al., 2010), opposed to1n/nas used in many other studies (e.g. Burke et al., 2004; Su et al., 2006). 4.1 Occurrence distribution of EPBs
25
[image:8.595.50.286.62.245.2]468
Figure 7. L-value distribution of fluxtubes on which EPB of different scale size where detected.
469
470
Figure 8. Carton illustrating the structure of plasma irregularities relative to CHAMP orbit height.
471
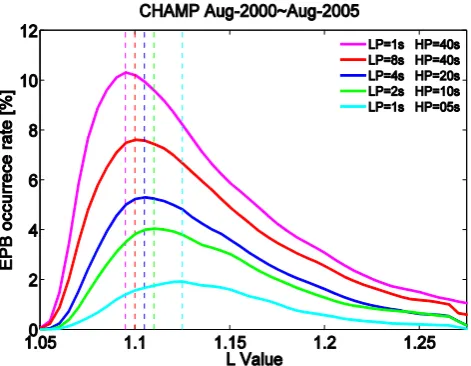
Fig. 7. L-value distribution of fluxtubes on which EPB of different
scale size where detected.
the meridional plane depending on the mean altitude of the bubble structure. From Fig. 3, comparing the top left panel to the right bottom panel, one can see that there are many more large scale EPBs at CHAMP attitude. An appreciable amount of smallest scale (15–76 km) bubbles is only detected in the longitude sector 270–360º around December solstice months. The four S/L distributions in Fig. 3 are all self-similar, just the percentages change from frame to frame. Ob-viously, the small scales are substructures of large-scale bub-bles. Conversely, we observe often large-scale EPBs without small structures (see Fig. 1, right example).
Another interesting fact is the large apex height of the flux-tubes containing small-scale features. From Fig. 6 we can deduce that the occurrence rates of highly structured events are quite different for the four considered longitude sectors. However, it is interesting to note that CHAMP detects at all longitudes the small structures preferably on fluxtubes with apex heights of about 800 km. Similarly for the other scale sizes, we find comparable apex heights at all longi-tudes for the peak occurrence rates. Over the 5 yr consid-ered the CHAMP altitude has become lower. In order to ac-count for that we computed the L-value of the fluxtube when-ever detecting an EPB. Results are presented in Fig. 7. Here again the poleward shift of the occurrence peaks for smaller EPB structures is evident. The smallest scale attains highest rates atL=1.125RE which corresponds to an apex height of about 800 km. These observations suggest that an irreg-ular region is highly structured at its bottom side and that depletion features may get larger towards apex. Support for this suggestion is provided by Aveiro and Hysell (2010) who successfully modeled a plasma irregularity structure using a 3-dimensional numerical simulation. They applied two kinds of instabilities to obtain high altitude plasma irregularities. At the bottom side of the ionosphere between about 200 and 250 km, the irregularity was driven by the collisional shear
instability (CSI). Also after several minutes of simulation run time, the effect of CSI did not reach F region peak al-titudes, but remained at the bottom side. CSI was found to cause larger relative amplitudes than structures created by the generalized Rayleigh-Taylor (GRT) instability. The lat-ter instability is more effective at altitudes near the F peak where the vertical plasma density gradient is less steep than at the bottom side. GRT structures have been found to extent also to higher altitudes, and “they do not appear to be very turbulent” (Aveiro and Hysell, 2010). Simulation runs com-bining CSI and GRT produced structures within the F-region at nearly all altitudes and scale sizes. This implies that well-developed irregularities include also smaller scale structures. This is consistent with our observations that only the high altitude bubbles contain the smallest detected scales. 4.2 Influence of the vertical plasma drift
It is known that the ionospheric F-region is uplifted consider-ably after sunset by the strong vertical plasma drift during the pre-reversal enhancement (PRE). This makes the F-region bottom side more susceptible to initiating the Rayleigh-Taylor instability (Kelley, 2009, Sect. 4). Stolle et al. (2008) have confirmed in a statistical study the close relation of EPB occurrence rate with the value of the integrated verti-cal plasma drift,SPRE. When comparing Fig. 3 and Fig. 5, we can clearly confirm the conclusions of Stolle et al. (2008) that the EPB occurrence has a higher correlation withSPRE. Particularly large values ofSPREup to 500 km are found in the Brazilian sector during the months around November. Here, we find irregularities on fluxtubes reaching on aver-age up to 800 km at their apex. This is exactly the location and time where the majority of small-scale EPBs are de-tected. All this points in the direction of an especially high uplift of the F-region. On top of that we found on average a higher solar flux level prevailing during days of small-scale EPBs (F10.7=176 sfu) than during large scale EPBs (F10.7=159 sfu) detections. This adds further evidence to the connection between small-scale structures and a high F-region. It is well known that the vertical plasma velocity dur-ing PRE is closely controlled by the solar flux level and with that it directly influencesSPRE(see Fig. 4). At first order we may interpret SPRE values as the amount of plasma uplift. For detecting small-scale EPB we needSPRE values larger than 400 km. This brings the fluxtube up to 800 km and en-ables CHAMP to detect highly structured features at 400 km altitude. CHAMP detects large-scale EPBs on flux tubes that reach on average apex heights of 600 km, and for thoseSPRE values ofSPRE>100 km are sufficient.
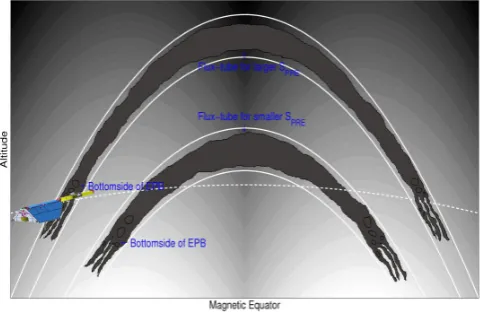
Our preferred interpretation of the obtained results is schematically illustrated in Fig. 8. Post-sunset plasma irregu-larities develop along fluxtubes. Small scale structures form at the lower end and higher up features become larger. De-pending on the integrated vertical plasma drift CHAMP is sampling the irregularity either near the top or close to the
25
Figure 7. L-value distribution of fluxtubes on which EPB of different scale size where detected.
469
[image:9.595.310.548.61.232.2]470
Figure 8. Carton illustrating the structure of plasma irregularities relative to CHAMP orbit height.
471 Fig. 8. Carton illustrating the structure of plasma irregularities
rela-tive to CHAMP orbit height.
bottom. In case of fluxtubes reaching up to 800 km ,the small structures are observed 400 km lower. This may be regarded as indications for the vertical extend of EPBs. Since the ma-jority of EPBs reach an apex height of 600 km, the mama-jority of small features may be expected at 200–300 km altitude. However, owing to our single satellite observations, we can-not say whether the fine structure is limited to the lower part of EPBs or is present at all altitudes.
4.3 Local time dependence of EPB structures
CHAMP on its polar orbit provides only meridional cuts though the plasma irregularities. Longitudinal (local time) variations can only be investigated by statistical methods. In order to check that, we determined the local time depen-dence of the occurrence rate. Assuming no dependepen-dence on longitude, we limited the investigation to the longitude sec-tor 270–360º E, where the majority of the small-scale EPBs is observed. Figure 9 shows the EPB occurrence rate ver-sus local time (LT) for the hours 19:00–01:00 LT separately for the four filter bands. As seen before, more events are de-tected by longer period filters. Up to 22:00 LT rates are in-creasing. Since the ratio between large and small structures stays about the same, between 19:30 and 22:00 LT, we find no indication of a significant relative increase of the small-scale structures up to 22:00 LT. After 22:00 LT, the situation is different. At that time we can expect a downward plasma drift during high and moderate solar activity times (Fejer et al., 2008). While the occurrence of large-scale features stays almost constant until midnight, the small-scale structures de-cay rapidly. These observations suggest following conclu-sions: (1) The growth of well-developed plasma irregulari-ties is confined until about 22:00 LT. Small and large scales develop at the same rate. Due to the increase in small scales, we expect that the structures are uplifted mainly in this LT sector. (2) After 22:00 LT, when the vertical plasma drift is
26
472
Figure 9. Local time distribution of EPB occurrence rates for different scale sizes at 270-360 degree
473
longitude.
474
Fig. 9. Local time distribution of EPB occurrence rates for different
scale sizes at 270–360 degree longitude.
mainly downward stabilizing the ionosphere, we observe that smaller scales decay much faster than large scale structures.
From the data available, we can say that we detected small-scale bubbles, when the corresponding L-shell reached to high apex altitudes, but we do not know whether EPBs on low fluxtubes have also small-scale structures at the bottom side of the bubble, below the sampling altitude of CHAMP.
5 Summary
In this paper we have presented results on the characteristics of plasma irregularities of different scale sizes. The studies are based on CHAMP observations from the high solar activ-ity years August 2000–August 2005. Main features deduced are as follows:
1. CHAMP detects many more EPBs with scale sizes 120– 608 km than 15–76 km. Small-scale EPBs at CHAMP altitude are confined in general to the longitude sector 270–360º E and the months around November.
2. There is a good correlation between the integrated ver-tical plasma drift after sunset and the detected scale size of EPB structures. CHAMP detects structured EPBs only in regions of high ionospheric uplift.
3. Highest occurrence rates are encountered on fluxtubes that reach apex heights of 800 km. Large-scale EPBs ex-hibit maximum occurrence rates on fluxtubes with apex heights of about 600 km.
[image:9.595.47.290.64.220.2]time progresses. The reason for the fast decay of small structures after 22:00 LT is suggested to be related to the downward plasma drift, but this cannot be determined uniquely from our observations.
5. Based on the interpretation of model simulations by Aveiro and Hysell (2010), we suggest that the bottom side of plasma irregularities is assigned to smaller scale structures than those at apex height, and that irregulari-ties which are well developed in altitude have structures to very low scales (according to CHAMP data down to kilometer-scale).
The results obtained here should be verified by multi-satellite approaches and numerical modeling to uniquely assess the height distribution of bubble structures.
Acknowledgements. The CHAMP and GRACE missions are
spon-sored by the Space Agency of the German Aerospace Center (DLR) through funds of the Federal Ministry of Economics and Technol-ogy. We would like to thank the German Space Operations Cen-ter (GSOC) of the German Aerospace CenCen-ter (DLR) for provid-ing continuously and nearly 100 % of the raw telemetry data of the CHAMP and GRACE satellites. One of the authors (Chao Xiong) is supported by the German Academic Exchange Service (DAAD) and China Scholarship Council (CSC).
The service charges for this open access publication have been covered by a Research Centre of the Helmholtz Association.
Topical Editor M. Pinnock thanks T. Yokoyama and one anony-mous referee for their help in evaluating this paper.
References
Aveiro, H. C. and Hysell, D. L.: Three dimensional numer-ical simulation of equatorial F region plasma irregularities with bottomside shear flow, J. Geophys. Res., 115, A11321, doi:10.1029/2010JA015602, 2010.
Burke, W. J., Gentile, L. C., Huang, C. Y., Valladares, C. E., and Su, S. Y.: Longitudinal variability of equatorial plasma bub-bles observed by DMSP and ROCSAT-1, J. Geophys. Res., 109, A12301, doi:10.1029/2004JA010583, 2004.
Farley, D., Balsey, B., Woodman, R., and McClure, J.: Equatorial Spread F: Implications of VHF Radar Observations, J. Geophys. Res., 75, 7199–7216, 1970.
Fejer, B. G., Scherliess, L., and de Paula, E. R.: Effects of the verti-cal plasma drift velocity on the generation and evolution of equa-torial spread F, J. Geophys. Res., 104, 19859–19869,, 1999. Fejer, B. G., Jensen, J. W., and Su, S.-Y.: Quiet time
equa-torial F region vertical plasma drift model derived from ROCSAT-1 observations, J. Geophys. Res., 113, A05304, doi:10.1029/2007JA012801, 2008.
Huang, C. Y., Burke, W. J., Machuzak, J. S., Gentile, L. C., and Sultan, P.: DMSP observations of equatorial plasma bubbles in the topside ionosphere near solar maximum, J. Geophys. Res., 106, 8131–8142, 2001.
Hysell, D. L.: A review and synthesis of plasma irregularities in equatorial spread F, J. Atmos. Sol.-Terr. Phys., 62, 1037–1056, 2000.
Hysell, D. L. and Seyler, C. E.: A renormalization group ap-proach to estimation of anomalous diffusion in the unsta-ble equatorial F region, J. Geophys. Res., 103, 26731–26737, doi:10.1029/98JA02616, 1998.
Jayachandran, B., Balan, N., Rao, P. B., Sastri, J. H., and Bailey, G. J.: HF Doppler and ionosonde observations on the onset condi-tions of equatorial spread-F, J. Geophys. Res., 98, 13741–13750, 1993.
Kelley, M. C.: The Earth’s Ionosphere, Plasma Physics and Electro-dynamics, 2nd Edn., Academic, San Diego Calif, 2009. L¨uhr, H., Rother, M., Maus, S., Mai, W., and Cooke, D.: The
dia-magnetic effect of the equatorial Appleton anomaly: Its charac-teristics and impact on geomagnetic field modeling, Geophys. Res. Lett., 30, 1906, doi:10.1029/2003GL017407, 2003. Makela, J. J. and Kelley, M. C.: Using the 630.0-nm nightglow
emission as a surrogate for the ionospheric Pedersen conduc-tivity, J. Geophys. Res., 108, 1253, doi:10.1029/2003JA009894, 2003.
Makela, J. J., Kelley, M. C., and Su, S.-Y.: Simultaneous observations of convective ionospheric storms: ROCSAT-1 and ground-based imagers, Space Weather, 3, SROCSAT-12C02, doi:10.1029/2005SW000164, 2005.
Ossakow, S. L.: Spread F theories – A review, J. Atmos. Sol.-Terr. Phys., 43, 437–452, 1981.
Reigber, C., L¨uhr, H., and Schwintzer, P.: CHAMP mission status, Adv. Space Res., 30, 129–134, 2002.
Singh, S., Johnson, F. S., and Power, R. A.: Gravity wave seeding of equatorial plasma bubbles, J. Geophys. Res., 102, 7399–7410, doi:10.1029/96JA03998, 1997.
Sobral, J. H. A., Abdu, M. A., Takahashi, H., Sawant, H., Zamlutti, C. J., and Borba, G. L.: Solar and geomagnetic activity effects on nocturnal zonal velocities of ionospheric plasma depletions, Adv. Space Res., 24, 1507–1510, 1999.
Stolle, C., L¨uhr, H., Rother, M., and Balasis, G.: Magnetic signa-tures of equatorial spread F, as observed by the CHAMP satel-lite, J. Geophys. Res., 111, A02304, doi:10.1029/2005JA011184, 2006.
Stolle, C., L¨uhr, H., and Fejer, B. G.: Relation between the occur-rence rate of ESF and the equatorial vertical plasma drift velocity at sunset derived from global observations, Ann. Geophys., 26, 3979–3988, doi:10.5194/angeo-26-3979-2008, 2008.
Su, S.-Y., Liu, C. H., Ho, H. H., and Chao, C. K.: Distribution char-acteristics of topside ionospheric density irregularities: Equato-rial versus midlatitude regions, J. Geophys. Res., 111, A06305, doi:10.1029/2005JA011330, 2006.
Su, S.-Y., Chao, C. K., Liu, C. H., and Ho, H. H.: Meridional wind effect on anti-solar activity correlation of equatorial den-sity irregularity distribution, J. Geophys. Res., 112, A10305, doi:10.1029/2007JA012261, 2007.
Su, S.-Y., Chao, C. K., and Liu, C. H.: On monthly/seasonal/ longi-tudinal variations of equatorial irregularity occurrences and their relationship with the postsunset vertical drift velocities, J. Geo-phys. Res., 113, A05307, doi:10.1029/2007JA012809, 2008. Tsunoda, R. T.: Magnetic-field-aligned characteristics of plasma
bubbles in the nighttime equatorial ionosphere, J. Atmos. Terr. Phys., 42, 743–752, 1980.
Whalen, J. A.: An equatorial bubble: Its evolution observed in re-lation to bottom side spread F and to the Appleton anomaly, J. Geophys. Res., 105, 5303–5315, 2000.
Xiong, C., Park, J., L¨uhr, H., Stolle, C., and Ma, S. Y.: Compar-ing plasma bubble occurrence rates at CHAMP and GRACE al-titudes during high and low solar activity, Ann. Geophys., 28, 1647–1658, doi:10.5194/angeo-28-1647-2010, 2010.
Yokoyama, T., Su, S.-Y., and Fukao, S.: Plasma blobs and ir-regularities concurrently observed by ROCSAT-1 and equa-torial atmosphere radar, J. Geophys. Res., 112, A05311, doi:10.1029/2006JA012044, 2007.