4-3-2019
Equation of state of boron nitride combining
computation, modeling, and experiment
Shuai Zhang
Lawrence Livermore National Laboratory
Amy Lazicki
Lawrence Livermore National Laboratory
Burkhard Militzer
University of California, Berkeley
Lin H. Yang
Lawrence Livermore National Laboratory
Kyle Caspersen
Lawrence Livermore National Laboratory
See next page for additional authors
Follow this and additional works at:
https://lib.dr.iastate.edu/ameslab_manuscripts
Part of the
Condensed Matter Physics Commons
,
Materials Science and Engineering Commons
,
and the
Plasma and Beam Physics Commons
This Article is brought to you for free and open access by the Ames Laboratory at Iowa State University Digital Repository. It has been accepted for inclusion in Ames Laboratory Accepted Manuscripts by an authorized administrator of Iowa State University Digital Repository. For more information, please [email protected].
Recommended Citation
Equation of state of boron nitride combining computation, modeling, and
experiment
Abstract
The equation of state (EOS) of materials at warm dense conditions poses significant challenges to both theory
and experiment. We report a combined computational, modeling, and experimental investigation leveraging
new theoretical and experimental capabilities to investigate warm-dense boron nitride (BN). The simulation
methodologies include path integral Monte Carlo (PIMC), several density functional theory (DFT)
molecular dynamics methods [plane-wave pseudopotential, Fermi operator expansion (FOE), and spectral
quadrature (SQ)], activity expansion (actex), and all-electron Green's function Korringa-Kohn-Rostoker
(mecca), and compute the pressure and internal energy of BN over a broad range of densities and
temperatures. Our experiments were conducted at the Omega laser facility and the Hugoniot response of BN
to unprecedented pressures (1200–2650 GPa). The EOSs computed using different methods cross validate
one another in the warm-dense matter regime, and the experimental Hugoniot data are in good agreement
with our theoretical predictions. By comparing the EOS results from different methods, we assess that the
largest discrepancies between theoretical predictions are
≲
4% in pressure and
≲
3% in energy and occur at
106K, slightly below the peak compression that corresponds to the K-shell ionization regime. At these
conditions, we find remarkable consistency between the EOS from DFT calculations performed on different
platforms and using different exchange-correlation functionals and those from PIMC using free-particle
nodes. This provides strong evidence for the accuracy of both PIMC and DFT in the pressure,
high-temperature regime. Moreover, the recently developed SQ and FOE methods produce EOS data that have
significantly smaller statistical error bars than PIMC, and so represent significant advances for efficient
computation at high temperatures. The shock Hugoniot predicted by PIMC, actex, and mecca shows a
maximum compression ratio of 4.55±0.05 for an initial density of 2.26g/cm3, higher than the Thomas-Fermi
predictions by about 5%. In addition, we construct tabular EOS models that are consistent with the
first-principles simulations and the experimental data. Our findings clarify the ionic and electronic structure of BN
over a broad range of temperatures and densities and quantify their roles in the EOS and properties of this
material. The tabular models may be utilized for future simulations of laser-driven experiments that include
BN as a candidate ablator material.
Disciplines
Condensed Matter Physics | Materials Science and Engineering | Plasma and Beam Physics
Authors
Shuai Zhang, Amy Lazicki, Burkhard Militzer, Lin H. Yang, Kyle Caspersen, Jim A. Gaffney, Markus W. Däne,
John E. Pask, Walter R. Johnson, Abhiraj Sharma, Phanish Suryanarayana, Duane D. Johnson, Andrey V.
Smirnov, Philip A. Sterne, David Erskine, Richard A. London, Federica Coppari, Damian Swift, Joseph Nilsen,
Art J. Nelson, and Heather D. Whitley
Equation of state of boron nitride combining computation, modeling, and experiment
Shuai Zhang,1,*Amy Lazicki,1,†Burkhard Militzer,2,3,‡Lin H. Yang,1Kyle Caspersen,1Jim A. Gaffney,1Markus W. Däne,1
John E. Pask,1Walter R. Johnson,4Abhiraj Sharma,5Phanish Suryanarayana,5Duane D. Johnson,6,7Andrey V. Smirnov,6
Philip A. Sterne,1David Erskine,1Richard A. London,1Federica Coppari,1Damian Swift,1
Joseph Nilsen,1Art J. Nelson,1and Heather D. Whitley1,§
1Lawrence Livermore National Laboratory, Livermore, California 94550, USA
2Department of Earth and Planetary Science, University of California, Berkeley, California 94720, USA 3Department of Astronomy, University of California, Berkeley, California 94720, USA
4Department of Physics, 225 Nieuwland Science Hall, University of Notre Dame, Notre Dame, Indiana 46556, USA 5College of Engineering, Georgia Institute of Technology, Atlanta, Georgia 30332, USA
6Division of Materials Science & Engineering, Ames Laboratory, Ames, Iowa 50011, USA 7Department of Materials Science & Engineering, Iowa State University, Ames, Iowa 50011, USA
(Received 2 February 2019; published 3 April 2019)
The equation of state (EOS) of materials at warm dense conditions poses significant challenges to both theory and experiment. We report a combined computational, modeling, and experimental investigation leveraging new theoretical and experimental capabilities to investigate warm-dense boron nitride (BN). The simulation methodologies include path integral Monte Carlo (PIMC), several density functional theory (DFT) molecular dynamics methods [plane-wave pseudopotential, Fermi operator expansion (FOE), and spectral quadrature
(SQ)], activity expansion (ACTEX), and all-electron Green’s function Korringa-Kohn-Rostoker (MECCA), and
compute the pressure and internal energy of BN over a broad range of densities and temperatures. Our experiments were conducted at the Omega laser facility and the Hugoniot response of BN to unprecedented pressures (1200–2650 GPa). The EOSs computed using different methods cross validate one another in the warm-dense matter regime, and the experimental Hugoniot data are in good agreement with our theoretical predictions. By comparing the EOS results from different methods, we assess that the largest discrepancies
between theoretical predictions are4% in pressure and3% in energy and occur at 106K, slightly below the
peak compression that corresponds to theK-shell ionization regime. At these conditions, we find remarkable
consistency between the EOS from DFT calculations performed on different platforms and using different exchange-correlation functionals and those from PIMC using free-particle nodes. This provides strong evidence for the accuracy of both PIMC and DFT in the high-pressure, high-temperature regime. Moreover, the recently developed SQ and FOE methods produce EOS data that have significantly smaller statistical error bars than PIMC, and so represent significant advances for efficient computation at high temperatures. The shock Hugoniot
predicted by PIMC,ACTEX, andMECCAshows a maximum compression ratio of 4.55±0.05 for an initial density
of 2.26 g/cm3, higher than the Thomas-Fermi predictions by about 5%. In addition, we construct tabular EOS
models that are consistent with the first-principles simulations and the experimental data. Our findings clarify the ionic and electronic structure of BN over a broad range of temperatures and densities and quantify their roles in the EOS and properties of this material. The tabular models may be utilized for future simulations of laser-driven experiments that include BN as a candidate ablator material.
DOI:10.1103/PhysRevB.99.165103
I. INTRODUCTION
The equation of state (EOS) of materials from the con-densed matter to warm-dense matter and the plasma regime plays an indispensable role in radiation hydrodynamic sim-ulations [1], which are required for the design and analysis of inertial confinement fusion (ICF) and high-energy den-sity (HED) experiments. In laser-driven capsule experiments,
ablator materials are important to implosion dynamics and performance. Currently, the most widely used ablator mate-rials are plastics, such as polystyrene derivatives and glow-discharge polymer, high-density carbon (HDC), and beryl-lium. Materials with higher density and tensile strength, such as boron (B) and its compounds, offer the potential for im-provements in performance and additional nuclear diagnostics in exploding pusher platforms [2,3].
At ambient conditions, boron nitride (BN) exists in two
stable, nearly degenerate phases: hexagonal BN (h-BN) and
cubic BN (c-BN), similar to the graphite and diamond phases
for various applications [4]. Nanostructured c-BN, whose
hardness is almost twice that of bulkc-BN and close to that of
diamond, has been synthesized at high-pressure and temper-ature conditions [5]. Other applications for low-dimensional
BN include nanoelectronic devices [4] and expanded h-BN
for hydrogen storage [6]. It has also been demonstrated that the density and mechanical properties of BN can be tuned by constructing a mixture of its cubic and hexagonal phases [7].
There have been extensive theoretical and experimental studies on the structure [8,9], stability [10–12], EOS [13–18], melting and phase diagram [19–22], and mechanical [23–25], optical [26,27], thermodynamic [14,25,28,29], and transport [30,31] properties of BN and its polymorphs. The phase
transformation of rhombohedral BN (r-BN) was found to be
dependent on the pressure-transmitting medium [12], and the
transition ofh-BN into a wurtzite phase (w-BN) under plastic
shear may be dramatically different from that under hydro-static pressures [32,33]. A large number of calculations using density functional theory (DFT) [34,35], and quantum Monte Carlo (QMC) simulations [15,36,37] have been performed on
c-BN. Assisted by vibrational corrections, QMC results [15]
successfully reproduce the volume changes and Raman fre-quency shifts measured by static high-pressure experiments.
Experimentally, the diamond anvil cell or multianvil
ap-paratus have been used to obtain the EOS of h-BN up to
∼12 GPa and 1000 K [38–40],c-BN to 160 GPa and 3300 K
[41–43], and of w-BN to 66 GPa [44]. Shock compression
measurements for BN up to 300 GPa have been reported
for various initial densities (1.81–3.48 g/cm3) [16–18,45],
porosity [18], and temperatures (293–713 K) [45]. Because of the limited data available at extremely high-pressure and -temperature conditions, existing tabular EOS models have traditionally relied on simplified electronic structure theory, such as the Thomas-Fermi (TF) theory. The goal of this work is to investigate the EOS of BN in the high-energy density regime and provide tabular models that are validated by first-principles simulations and experimental data.
In a recent study [3], Zhang et al.computed the EOS of
B based on first-principles quantum simulations over a wide range of temperatures and densities. The Hugoniot computed from those simulations shows excellent agreement with our experimental measurement on a planar laser shock platform. We have utilized the data to construct an EOS table (X52) for B. The work has also allowed us to study the performance of the polar direct-drive exploding pusher platform [2] and its sensitivity to the EOS.
In this work, we combine extensive theoretical calculations to build tabular models for the EOS of BN, which we then validate in the warm-dense matter regime via comparison to experimental measurements of the BN Hugoniot. We also provide theoretical estimates of the uncertainty in the pressure and internal energy by comparing values from different sim-ulation methods. Our theoretical methods include many-body path integral Monte Carlo (PIMC), several electronic structure theories based on pseudopotential DFT-molecular dynam-ics (DFT-MD), an activity expansion method, and an all-electron, Green’s function Korringa-Kohn-Rostoker (KKR) method. Our experiments consist of three measurements of
the Hugoniot response ofc-BN conducted at the Omega laser
facility.
The paper is organized as follows: Sec. II introduces
our simulation methods; Sec. III describes details of our
shock experiments; Sec. IV introduces our EOS models;
Sec.Vcompares and discusses our EOS and Hugoniot results
from different theoretical methods and experiments and those
between BN and C; finally, we conclude in Sec.VI.
II. FIRST-PRINCIPLES SIMULATION METHODS
In this section, we introduce the theoretical methods that are used in this work to compute the internal energies and pressures of BN across a wide range of temperatures and densities in order to provide simulation data for construction of tabular EOS models for BN. The theoretical methods applied here include PIMC, the activity expansion method
as implemented in theACTEXcode, and several methods that
are based on DFT. The DFT methods include both methods that sample the ionic positions via molecular dynamics and average-atom methods where the ionic positions are static.
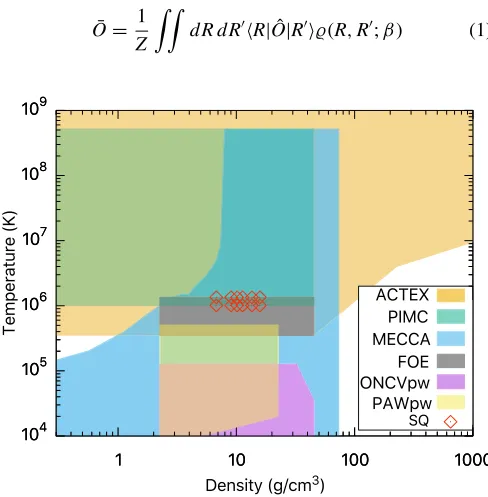
Figure1summarizes the temperature and density conditions
at which each of the methods has been employed for calcula-tions of BN in this study. In the following, we briefly describe the fundamental assumptions associated with each technique and comment on its accuracy. Additional details can be found in the cited references.
A. Path integral Monte Carlo
PIMC is a quantum many-body method for materials simulations that is based on sampling the finite-temperature density matrix derived from the full many-body Hamiltonian
H. In PIMC, particles are treated as quantum paths that are
cyclic in imaginary time [0, β =1/kBT], where kB is the
Boltzmann constant. Thermodynamic properties, such as the internal energy, are obtained by
¯ O= 1
Z
[image:4.590.301.545.457.706.2]
dR dRR|Oˆ|R(R,R;β) (1)
in coordinate representation.Z =dRR|Oˆ|Ris the partition
function.(R,R;β)= R|exp(−βH)|Ris the density
ma-trix. Trotter’s formula [46] can be used to break up(R,R;β)
intoM slices, each corresponding to an imaginary-time step
τ =β/M. The method becomes exact in the limit ofτ →0.
Higher temperatures require fewer points, and convergence with respect to the imaginary-time step must systematically be tested for each system studied. In practice, one starts with a solution of the two-body problem and only employs the PIMC method to sample higher-order correlations. This pair density matrix approach is described in Refs. [47,48].
The application of PIMC to electronic structure calcula-tions requires certain approximacalcula-tions due to the fermion sign problem. Fermionic symmetry requires that a negative sign arises from the antisymmetrical wave function. This leads to the nearly complete cancellation of positive and negative contributions to the fermionic density matrix, which makes a direct numerical evaluation impractical for more than a few particles. The standard way to avoid this issue in PIMC simulations is to restrict the paths to the positive region of
the trial density matrix T by implementing the fixed-node
approximation [49]. The conditionT =0 in 3N-dimensional
space defines the nodal surface, where N is the number of
particles. In high-temperature simulations,T is chosen to be
a Slater determinant of free-particle density matrices
[1]
(ri,rj;β)=
k
exp(−βEk)k∗(ri)k(rj), (2)
wherek∗(r) denotes a plane wave with energyEk. The
cor-responding nodal surface is called free-particle nodes. The as-sumption of free-particle nodes is appropriate at high tempera-ture. The PIMC method with free-particle nodes has been suc-cessfully developed and applied to hydrogen [50–58], helium [59,60], and calculations of the EOS for a range of first-row elements [3,61–64] and compounds [61,65–67]. Recent de-velopments [68–70] have extended the applicability of PIMC to second-row elements at lower temperatures by appending
localized orbitals to[1], opening a possible route toward
ac-curate quantum many-body simulations of heavier elements. In this study, we apply PIMC for the simulations of BN with free-particle nodes using the CUPID code [71]. All elec-trons and nuclei are treated explicitly as quantum paths. The Coulomb interactions are described via pair density matrices
[47,72], which are evaluated in steps of τ = 5121 Hartree−1
(Ha−1). The nodal restriction is enforced in much smaller
steps of 81921 Ha−1. The calculations are performed over a
wide range of densities 0.23–45.16 g/cm3, or 0.1 to 20 times
the ambient densityρ0∼2.26 g/cm3 based on that ofh-BN
[73], and temperatures 106–5×10⁸K. Each simulation cell
consists of 24 atoms, which is comparable to our previous simulations for pure B [3], nitrogen (N) [63], and hydrocar-bons [66,67]. The cell-size effects on the EOS are negligible
at such high-temperature conditions.1
1By comparing the EOS and the radial distribution functiong(r)
obtained using 24-atom cells to those using 96-atom cells in our DFT-MD calculations, we find negligible differences at temperatures
above 5×10⁴K. A comparison ing(r) is shown in Fig.8.
B. DFT-MD with plane-wave basis and projector augmented wave potentials
DFT-MD is a widely used method for accurately simu-lating condensed matter systems at finite temperatures. In DFT-MD, the ions are classical particles, which move accord-ing to Newton’s classical equations of motion. The forces are computed by solving the Kohn-Sham DFT equations for the electrons at each time step. The applicability and accuracy of DFT-MD for EOS calculations has been previ-ously demonstrated for condensed phase materials in multiple studies (see Ref. [74] as an example). One difficulty lies in using this method for high temperatures, which is originated from significant thermal excitation of electrons and intractable computational cost.
Our DFT-MD simulations for BN are performed in two different ways. One way is by using the projector augmented wave (PAW) pseudopotentials [75] and plane-wave basis
(PAWpw), as implemented in the Viennaab initiosimulation
package (VASP) [76] and used in our previous studies (e.g., Refs. [3,66,67,69,77]). Similar to our recent work on pure B [3], we choose the hardest PAW potentials available in VASP, which freeze the 1s electrons in the core and have a core radius of 1.1 bohrs for both B and N. We choose the Perdew-Burke-Ernzerhof (PBE) [78] functional for describing electronic exchange and correlation interactions, a large cutoff
energy of 2000 eV for the plane-wave basis, and thepoint
to sample the Brillouin zone. The simulations are carried out using a Nosé thermostat [79] to generate MD trajectories in the canonical ensemble. The MD time step is chosen to ensure total energy conservation and takes on values of 0.05– 0.55 fs in these calculations, with smaller values correspond-ing to higher temperatures. We typically run for 5000 steps
at each density-temperature (ρ-T) condition, which is found
to be sufficient for convergence of the computed energies and pressures.
To ensure consistency with the all-electron PIMC energies,
our PAWpw energies from VASP reported in this study are
shifted by −79.017 Ha/BN. This is determined with
all-electron calculations for isolated B and N atoms with OPIUM [80] using the PBE functional.
Our PAWpw calculations are performed at temperatures
between 6.7×10³K and 5.05×10⁵K (∼0.6–43.5 eV). Due
to limitations in applying the plane-wave expansion for or-bitals at low densities and limitations in the applicability of
the pseudopotentials that freeze the 1s2 electrons in the core
at high densities, we consider a smaller range of densities
(ρ0 up to 10×ρ0) than that was examined via PIMC
simu-lations. These conditions are relevant to shock-compression experiments and span the range in which Kohn-Sham DFT-MD simulations are feasible by conventional wave-function-based approaches. We performed calculations with both 24-atom and 96-atom cells to minimize the finite-size errors.
C. DFT-MD with optimized norm-conserving Vanderbilt pseudopotentials and Fermi-operator expansion
separate set of DFT-MD simulations by utilizing optimized norm-conserving Vanderbilt (ONCV) [81,82] pseudopoten-tials, a plane-wave method (ONCVpw) at low temperatures, and a Fermi-operator expansion method (FOE) at high tem-peratures, in order to verify our PAWpw calculations and expand the range of applicability of Kohn-Sham DFT to higher temperatures. Detailed information about the ONCV
pseudopotentials is described in AppendixA.
The ONCVpw calculations at low temperature (<1.3×
105K) are similar to those using PAWpw. We applied a
preconditioned conjugate gradient method [83] to fully re-lax the electronic wave functions at each time step. An efficient fast Fourier transform (FFT) algorithm was used for the conversion of the wave functions between real and reciprocal spaces. Each simulation is performed either with
frozen 1s2 core pseudopotentials (for ρ10×ρ
0) or with
all-electron pseudopotentials (forρ >10×ρ0),NV T
ensem-ble with over 5000 steps, time step of 0.2 fs, and on 128-atom supercells.
At temperatures greater than 3.5×10⁵K, K-shell
ion-ization becomes significant [3]. We use all-electron ONCV potentials and FOE [84,85], which takes advantage of the smooth Fermi-Dirac function at high temperature by approx-imating the function with polynomial expansion, to con-duct Kohn-Sham DFT calculations. In the subspace-projected Hamiltonian approach, we adopted the Chebyshev filtered subspace iteration approach [86]. As the ground-state elec-tron density depends solely on the occupied eigenspace, the technique exploits the fast growth property of Chebyshev polynomial to magnify the relevant spectrum, thereby provid-ing an efficient approach for the solution of the Kohn-Sham eigenvalue problem. The matrix-vector multiplications in the Chebyshev filtering procedure are performed on the FFT grids in Fourier space and only considered if the vector has a nonzero value in the matrix.
Three steps are involved in this method: (i) a Chebyshev filter to construct a subspace which is an approximation to the temperature-smearing occupied eigenspace in a given self-consistent iteration; (ii) FFT mesh to span the Chebyshev filtered subspace from real space to Fourier space; (iii) FOE in terms of the subspace-projected Hamiltonian represented in the plane-wave basis to compute relevant quantities like the density matrix, electron density, and band energy. The accuracy of the Chebychev polynomial expansion [87,88]
depends on the electron temperatureTe, and the width of the
eigenspectrum Ee. In particular, the degree of polynomial
required to achieve the desired accuracy in the approximation
[87] of the Fermi-Dirac distribution isO(Ee/kBTe). A more
accurate estimate that takes into account the location of the Fermi level can be found in Ref. [89]. Chebychev polynomial orders of 40–60 and localization radii ranging from 1.056 to 2.88 bohrs were used in the FOE method.
To achieve the same level of accuracy as the plane-wave
approach, our high-T FOE simulations use PBE
exchange-correlation functional and the same FFT meshes as the ON-CVpw method (real-space grid spacing ranges from 0.066 to
0.18 bohrs). TheNV T simulations were carried out using
32-atom supercells. Each simulation involves 3000–6000 steps
(0.05–0.1 fs/step) to ensure sufficient statistics.
D. DFT-MD using spectral quadrature
The spectral quadrature (SQ) method [89] is a density
matrix basedO(N) method for the solution of the Kohn-Sham
equations that is particularly well suited for calculations at high temperature. In the SQ method, all quantities of interest, such as energies, forces, and pressures, are expressed as bilinear forms or sums of bilinear forms which are then ap-proximated by quadrature rules that remain spatially localized by exploiting the locality of electronic interactions in real space [90], i.e., the exponential decay of the density matrix at finite temperature [91–94]. In the absence of truncation, the method becomes mathematically equivalent to the recursion method [95,96] with the choice of Gauss quadrature, while for Clenshaw-Curtis quadrature, the FOE [87,88] in Chebyshev polynomials is recovered. Being formulated in terms of the finite-temperature density matrix, the method is applicable to metallic and insulating systems alike, with increasing effi-ciency at higher temperature as the Fermi operator becomes smoother and the density matrix becomes more localized
[97,98].O(N) scaling is obtained by exploiting the locality
of the density matrix at finite temperature, while the exact diagonalization limit is obtained to desired accuracy with increasing quadrature order and localization radius.
Conver-gence to standardO(N3) plane-wave results, for metallic and
insulating systems alike, is readily obtained [97,98].
While mathematically equivalent to classical FOE meth-ods for a particular choice of quadrature, the more general SQ formulation affords a number of advantages in practice [97,98]. These include the following: (1) The method is expected to be more robust since it explicitly accounts for the effect of truncation on the Chebyshev expansion. (2) The method computes only the elements of density matrix needed to evaluate quantities of interest, e.g., only diagonal elements to obtain densities and energies, rather than computing the full density matrix (to specified threshold) as in FOE methods. (3) The method computes the Fermi energy without storage or recomputation of Chebyshev matrices as required in FOE methods. (4) The method admits a decomposition of the global Hamiltonian into local sub-Hamiltonians in real space, reducing key computations to local sub-Hamiltonian matrix-vector multiplications rather than global full-Hamiltonian matrix-matrix multiplications as in FOE methods. Since the associated local multiplications are small (according to the decay of the density matrix) and independent of one another, the method is particularly well suited to massively paral-lel implementation; whereas the global sparse matrix-matrix multiplications required in FOE methods pose significant challenges for parallel implementation [85].
temperatures in excess of∼105K, where the Fermi operator
becomes sufficiently smooth and density matrix sufficiently localized to reduce wall times below those attainable by
standard O(N3) scaling methods for the system sizes
con-sidered here, though avenues exist to reduce this temperature substantially [99].
Simulations were carried out for a series of 32-atom BN
unit cells at densities from 6.77–13.55 g/cm3 and
tempera-tures from 1 010 479–1 347 305 K. All-electron ONCV [81] pseudopotentials were employed for B and N with cutoff radii of 0.60 and 0.65 bohrs, respectively. Exchange and correlation were modeled in the local density approximation (LDA) as
parametrized by Perdew and Zunger [100].NV T simulations
were carried out using a Nosé-Hoover thermostat [79,101] with∼500 steps for equilibration followed by∼3000–5000 steps for production (with time steps of 0.035–0.04 fs). A
finite-difference grid spacing of ∼0.1 bohrs
(commensu-rate with unit-cell dimensions), Gauss and Clenshaw-Curtis quadrature orders of 50 and 76, respectively, and localization radius of 1.3 bohrs were employed in the SQ calculations to obtain energies to 0.02% and pressures to 0.2% (discretization error) or less.
E. All-electron, Green’s function Korringa-Kohn-Rostoker
In addition, we applied an all-electron, Green’s function KKR electronic structure method (based on Kohn-Sham DFT) implemented within a scalar-relativistic approximation, i.e., spin orbit is ignored beyond the core electrons. We use the multiple-scattering electronic structure calculation for
com-plex applications (MECCA) code, ak-space KKR code [102].
More technical details on high-energy density applications
using MECCA and the advantages using a Green’s function
method can be found in Ref. [103].MECCAis applicable to
the whole pressure and temperature range of interest in this paper, beyond that available from pseudopotential methods.
However, as presently implemented,MECCAis a static DFT
code that does not sample the ionic degrees explicitly, i.e., vibrational energies and corresponding entropy contributions cannot be obtained. As such, one must add these either from another calculation or some analytic model. Here, we apply
the ideal-gas correction to theMECCAresults to provide the
most consistent comparisons with the other methods. This approach was used recently to address, for example, the principal Hugoniot curves for Be in a review of EOS models for ICF materials [104].
For current results, we used the atomic sphere approx-imation with periodic boundary conditions to incorporate interstitial electron contributions to Coulomb energy from all atomic Voronoi polyhedra. The KKR spherical-harmonic
local basis included Lmax=2, i.e.,s, p, andd symmetries
within the multiple-scattering contributions, and L’s up to
200 are included automatically until the free-electron Bessel functions contribute zero to the single-site wave-function normalizations. The Green’s functions are integrated via complex-energy contours taking advantage of analytic contin-uation to decrease dramatically solution times [105]. Various DFT exchange-correlation functionals are included through
use of the libXC library [106]. In this work we used the
LDA functional of Vosko, Wilk, and Nusair [107]. Brillouin
zone integrations for self-consistent charge iterations were
performed with a 16×16×16 Monkhorst-Pack [108] k
-point mesh along the complex-energy contour for energies with an imaginary part smaller than 0.25 Rydberg, and a
10×10×10 k-point mesh otherwise. A denser mesh was
used for the physical density of states calculated along the real-energy axes when needed.
Even though BN occurs in many phases near ambient conditions, for simplicity we chose to use a dense packed but cubic structure, the B2 phase (CsCl prototype) for all MECCAcalculations to cover the broad range of pressures and temperatures.
F. Activity expansion
Activity-expansion calculations of the EOS are performed
using theACTEXcode, which is based on an expansion of the
plasma grand partition function in powers of the constituent particle activities (fugacities) [109,110]. The present calcu-lations are similar to those used in previous work [3] and include interaction terms beyond the Debye-Hückel, electron-ion bound states and electron-ion-core plasma polarizatelectron-ion terms, along with relativistic and quantum corrections [111,112].
EOS data generated with theACTEX code, as well as OPAL
opacity tables which use the state populations computed from ACTEX, have been extensively checked by comparison with astronomical observations [113] and with laser-driven experi-ments [114].
As with previous studies [3], we cut off ACTEX
calcu-lations at temperatures below the point where many-body terms become comparable to the leading-order Saha term
(T >5.8×10⁵K). This ensures that the activity-expansion
method is valid while allowing investigation of the predicted peak compression on the Hugoniot.
III. SHOCK HUGONIOT EXPERIMENT
Experiments to constrain the EOS of BN were performed at the Omega laser facility at the Laboratory for Laser Energetics
in Rochester, NY. Samples were c-BN crystals of greater
than 99% purity (by weight) and density of 3.45(±0.03)
g/cm3, obtained from Saint-Gobain Ceramic Materials. Pale
amber-colored {111}and{¯1¯1¯1}-oriented (identified by their
morphology) optically transparent single crystals were char-acterized using x-ray photoelectron spectroscopy (XPS) and Raman spectroscopy as in [115]. XPS analysis was performed
with a PHI Quantum 2000 system, using focused (1×1 mm)
monochromatic Al Kα x rays (1486.3 eV). XPS revealed a
large amount of C, O, and Si contamination, but a 60-s 3-kV Ar-ion beam sputter (estimated to remove about 2–5 nm from the surface), dropped the concentration of contaminants by nearly 50%, indicating that these form primarily a surface
contamination (a<1μm contaminated surface layer will have
no effect on our measurement). After etching, XPS identified a B:N ratio of 1.08:1. Room-temperature Raman spectroscopy
at 514.5 nm showed the TO and LO phonons of c-BN at
1057.7 and 1309.1 cm−1, with no sign of the defect bands
observed for amber crystals in Ref. [115], indicating a high
bulk purity. An extremely weak peak at 1122.3 cm−1suggests
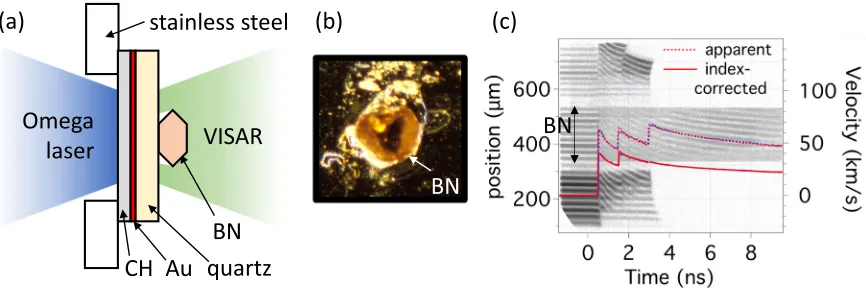
FIG. 2. (a) Experimental configuration (not drawn to scale), (b) image of a typicalc-BN crystal glued to the quartz plate, viewed from the perspective of the VISAR diagnostic, and (c) image of the VISAR data from shot 75 265, with the analyzed velocities shown as red and blue traces (corresponding the two interferometer legs). The dashed traces are the apparent velocities and the solid traces are corrected for the index
of refraction in quartz andc-BN.
Crystals with parallel facets separated by∼150 μm and
lateral dimensions of 150–250μm were affixed to∼90-μ
m-thick z-cut α-quartz (density of 2.65 g/cm3) windows with
micron-scale layers of epoxy. A 3-μm-thick layer of Au was
deposited on the other side of the quartz window, to absorb ablation plasma x rays and reduce x-ray preheat of the BN
samples to negligible levels, and a ∼25-μm-thick layer of
plastic was deposited onto the Au to form the laser ablator
[Fig.2(a)].
Samples were ablated directly using 12 beams at of the Omega laser with a 1-ns top-hat pulse shape and distributed
phase plates forming a 800-μm spot size. Laser energies were
tuned to drive the target at intensities ranging from 1.8×10¹⁴
to 5×10¹⁴TW/cm2.
A reflecting shock wave could be tracked continuously as
it propagated through the quartz and c-BN samples, using
a line-imaging velocimeter (VISAR: Velocity Interferometer
System for Any Reflector) [116]. Thein situapparent
veloc-ities are corrected for the index of refraction of the quartz
(1.546 87) [117] and c-BN (2.126) [118] at 532 nm, which
is the wavelength of the VISAR probe laser.
The shock velocities in the quartz andc-BN at the interface
between the two are used in the impedance-matching
tech-nique, to determine the EOS data point forc-BN. Because of
a finite glue bond thickness between the two materials, the
shock velocity in thec-BN must be extrapolated to the quartz
surface. The quartz Hugoniot standard is taken from [119] and the reshock model from [120]. The shock impedance in
c-BN at these conditions is higher than quartz, but sufficiently
close that the accuracy of the off-Hugoniot quartz model has
a small effect on the result (differs by ∼1% from the result
obtained by simply assuming a reflected Hugoniot for the reshock state).
The results of these measurements are recorded in TableI.
Factors contributing to the uncertainty in the Omega
mea-surements include uncertainty in the quartz and c-BN wave
velocities, uncertainty in the extrapolation of thec-BN
veloc-ity across the epoxy layer, uncertainty in the initial densveloc-ity of
c-BN, and systematic uncertainty in the quartz standard EOS.
Uncertainty in thec-BN index of refraction is not quantified
so is not included in the error bar.
IV. CONSTRUCTION OF EOS MODELS FOR BN
Before describing the results of the first-principles simula-tions and experiments in detail, we describe the EOS models and make comparisons to a subset of the calculations. We construct EOS tables (X2151 and X2152) for BN under the QEOS framework [121,122]. QEOS is a self-contained quasi-single-phase set of thermodynamic models that are widely applicable and guarantee the correct physical limits at both
high/low temperature and high/low density. The standard
QEOS model based on TF theory also guarantees thermo-dynamic consistency. In our QEOS framework, we decom-pose the EOS into separate contributions corresponding to
the T =0 cold curve, the ion-thermal term that describes
[image:8.590.78.511.63.207.2]contributions to the EOS from the ionic degrees of freedom, and the electron-thermal term that describes the contributions to the EOS from thermal distribution of the electrons. The cold curve is generally taken from experimental data static DFT calculations, while the electron-thermal term is generated using fast electronic structure methods, namely, TF theory
TABLE I. Measured quartz andc-BN shock velocities (Us) and analyzedc-BN particle velocity (Up), pressure (P), and density (ρ).
Quartz BN
Us(km/s) Us(km/s) Up(km/s) P(GPa) ρ(g/cm3)
75265 31.27(0.47) 31.95(0.29) 18.97(0.47) 2091(53) 8.49(0.34)
75263 34.99(0.34) 35.04(0.31) 21.87(0.37) 2643(48) 9.18(0.30)
[image:8.590.37.547.664.742.2]and DFT calculations for the average atom-in-jellium model
(Purgatorio) described in AppendixB. The ion-thermal term
is often derived using a form proposed by Cowan [121,122] and can be modified to fit both experimental data and data from many-body calculations. In condensed phases (at high densities and low temperatures), the EOS, and hence the shock response of materials, is dominated by the cold curve, whereas the ion-thermal term dominates the EOS through much of the high-velocity shock regime that is currently accessible in planar experiments at Omega and the National Ignition Facility. The behavior of the EOS and the Hugoniot near peak compression, on the other hand, is mostly dominated by the electron-thermal term. The Hugoniot response that a model predicts near peak compression is therefore determined mostly by the underlying electron-thermal model, and thus notable differences are seen between TF-based QEOS models and Purgatorio-based QEOS models.
The QEOS framework was chosen due to the lack of data necessary to constrain a more complicated multiphase EOS representation and because the focus of this study is
in the liquid/plasma region relevant to high-velocity,
laser-driven shocks. Both X2151 and X2152 tables have reasonably similar parametrization except for the electron-thermal model. At the time when the X2151 table was constructed there was
only a Purgatorio2 electron-thermal model for B, therefore,
the full electron-thermal model for BN is a mixture of a Purga-torio electron-thermal model for B and a TF electron-thermal model for N. Once a N Purgatorio electron-thermal model became available, the X2152 table was constructed, where the hybrid TF-Purgatorio electron-thermal model from X2151 was exchanged with a fully Purgatorio electron-thermal model (some adjustments to other EOS parameters were needed to improve the fit for X2152). Therefore, examining the L2150 (legacy TF EOS), X2151, and X2152 gives a demonstration of how the Hugoniot varies from a fully mean-field TF descrip-tion of ionizadescrip-tion, to a hybrid treatment, to a fully quantum atom-in-jellium description.
In both X2151 and X2152, the equilibrium conditions were chosen to be in the hexagonal phase, with a density
of 2.258 g/cm3, at 295 K and 1 atm. The cold curves are
identical in the two models and were fit to calculations from this study and Hugoniot measurements from the Marsh compendium [18]. Since the ground-state phase was taken to be hexagonal, the transformation to the cubic phase was represented by employing break points [122] to transition from the hexagonal cold curve to the cubic cold curve at 10 GPa (the wurtzite phase is essentially combined with the cubic phase in this QEOS form). This transformation pressure is slightly higher than what is reported (1–6 GPa [123]) but was chosen so that the density where the transfor-mation begins is notably denser than the reference density; this was a practical choice to enhance the stability of the
2We performed Purgatorio calculations for boron and for
nitro-gen in order to nitro-generate the electron-thermal term of the EOS, which is used for constructing EOS tables based on the QEOS model. Our Purgatorio calculations use the Coulomb potential and
Hedin-Lundqvist [140] form of exchange-correlation functional
[image:9.590.306.552.74.190.2]un-der LDA.
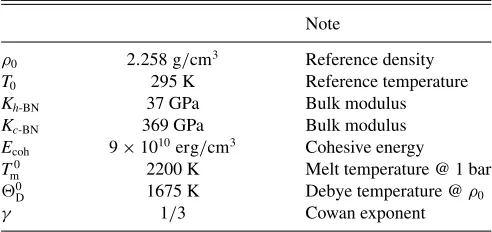
TABLE II. Key parameters used in the X2152 EOS table.
Note
ρ0 2.258 g/cm3 Reference density
T0 295 K Reference temperature
Kh-BN 37 GPa Bulk modulus
Kc-BN 369 GPa Bulk modulus
Ecoh 9×10¹⁰erg/cm3 Cohesive energy
T0
m 2200 K Melt temperature @ 1 bar
0
D 1675 K Debye temperature @ρ0
γ 1/3 Cowan exponent
EOS when employed during hydrodynamic simulations. The first-principles isochores calculated for this work were used to constrain the ion-thermal models; specifically, the density-dependent Grüneisen model, and the Cowan liquid model. The largest difference between X2151 and X2152 (outside of the electron-thermal model) is that the best ion-thermal fit for X2151 (hybrid electron thermal) was found using a Cowan exponent of 0.5, conversely the best fit for X2152 (purely Purgatorio) was determined using the canonical value
of 13. All other EOS parameters (melt temperature, Debye
temperature, etc.) were taken directly from known literature. The thermodynamic parameters in the ion-thermal model are determined by fitting the pressure data from PIMC, DFT-MD, andACTEX, taking into account the range of applicability of each method. The key parameters used in X2152 are shown
in Table II. In order to avoid problems with energy offsets
(energy zeros) in various techniques, only the pressure data are used for constructing the LEOS tables. The fidelity of this procedure is discussed here.
We note that the EOS obtained using different electronic structure theories can vary depending on the underlying physics. For example, orbital-free (OF) MD, which signifi-cantly reduces computational cost of standard DFT-MD by constructing the energy functional in a form that is inde-pendent of electronic wave functions, predicts CH to be less compressible at the compression maximum than predicted by
PIMC and Purgatorio [66,67]. Zhang et al. [67] found that
this is because the internal energies calculated by OFMD are lower than PIMC, although the pressures are similar, at the same temperatures. Comparing a recent work [124] on carbon EOS using OFWMD (with W standing for Weizsäcker) to the
most recent, Purgatorio-based LEOS 9061 table,3 the peak
compression predicted by OFWMD is also smaller (4.5 by OFWMD versus 4.6 by LEOS 9061). In addition, OFMD calculations for silicon [125] show a single compression max-imum along the Hugoniot, whereas PIMC predicts two peaks
corresponding toKandLshell ionization, respectively.
We examine the internal energy differences by comparing the Hugoniot curves for BN based on three LEOS tables (LEOS 2150, X2151, and X2152), for which the electron-thermal free energy is constructed differently, as we have
3LEOS 9061 is a multiphase, Purgatorio-based table for carbon
developed by fitting the ionic thermodynamic parameters to the
FIG. 3. (a) Pressure- and (b) temperature-compression Hugoniot of BN predicted by different LEOS models in comparison with PIMC and DFT-MD (PAWpw). The initial density of all Hugoniot curves is
set to be 2.15 g/cm3. Note that the deviations at above 106GPa and
2×10⁷K are due to the electron relativistic effect, which is included
in the Purgatorio tables (thus fully in X2152 and partially in X2151) but not in L2150 or PIMC.
explained previously in this section. The results are shown
in Fig.3. Consistent with previous studies, we find that the
TF-based model (L2150) predicts a lower peak compression with a broader shape along the vertical axis than the fully Purgatorio-based model (X2152). As expected, the model which combines TF and Purgatorio models lies between the two. Both the shape and the magnitude of the peak
com-pression are intimately related to the K-shell ionization of
B and N. The TF model is broad due to the neglect of the shell effects, and we observe that the peak compression
becomes sharper as one accounts for the K-shell ionization
of B (X2151), and sharper still when we also account for the shell structure of N (X2152).
The differences in the maximum compression predicted by the different models can be explained by decomposing the Hugoniot function [left-hand side of the Hugoniot
equa-tion E−Ei−(P+Pi)(Vi−V)/2=0, where (E,P,V) and
(Ei,Pi,Vi) denote the energy, pressure, and volume of the
sample in the shocked and the initial states, respectively] into
the energy termE−Ei and the pressure term (P+Pi)(Vi−
V)/2 and comparing the two as functions of density along
isotherms. Figure 4 shows such comparisons at 2×10⁶ K,
which is near the compression maximum along the shock
Hugoniot (Fig.3). The density at which the energy and the
pressure curves cross is the Hugoniot density at this temper-ature. We find that the pressure curves of X2151 and X2152 are on top of each other, but their energies are different. The energies of X2151 are lower, leading to a smaller compression ratio than X2152. In comparison, X2152 data are similar to PIMC in both energy and pressure. This indicates that when constructing an EOS model by merely fitting pressure, it is important to make the electronic contribution fully Purgatorio based. This is not surprising because Purgatorio is essentially a DFT method. The EOS consistency here demonstrates that the agreement in EOS between PIMC and DFT is not acciden-tal, but represents a consistent description of the electronic
interaction in both methods. In addition, Fig. 4 shows the
2500 3000 3500 4000 4500
8 9 10 11 12 13
Energy (eV/BN)
Density (g/cm3)
P term
E term
T=2x10⁶ K
[image:10.590.40.285.61.213.2]PIMC L2150 X2151 X2152
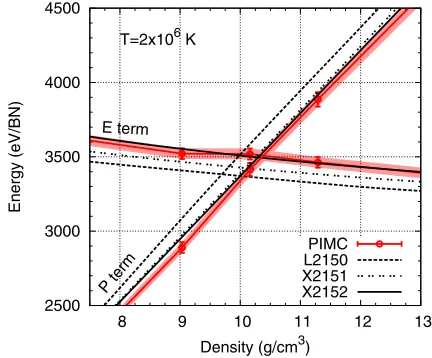
FIG. 4. Comparison of the pressure and the energy terms of
the Hugoniot function along the 2×10⁶K isotherm, which is near
the compression maximum. Shaded areas denote the error bar of the PIMC data.
nonsmoothness and error bar of the PIMC data at 2×10⁶K,
which leads to an uncertainty in the compression ratio of
0.05 (or1%). This represents the level of uncertainty in
our reported compression maximum along the Hugoniot by PIMC. At both higher and lower temperatures, the uncertain-ties are smaller because of the smaller error of the EOS data and higher smoothness of the data along isotherms.
V. RESULTS AND DISCUSSION
A. Isochore comparisons
In order to evaluate the performance of recent extensions of DFT methods to high temperature, we compare the com-puted EOS data from PIMC, PAWpw, ONCVpw, FOE, SQ, ACTEX, andMECCA. We choose the X2152 model along
sev-eral isochores between 0.23 and 45.16 g/cm3in Fig.5for the
basis of performing the comparison. Figure5(b)highlights the
comparison in the temperature range of 105–107K. This is the
regime where 1selectrons are significantly ionized, providing
an important test bed for different methods.
We find that, at temperatures greater than 2×10⁶K,
PIMC,ACTEX, andMECCAresults show excellent agreement
with each other, while the ACTEX predictions are slightly
higher than the other two methods only at higher
densi-ties. At densities above 4.52 g/cm3 and temperatures below
1.35×10⁶K, deviations ofACTEXfrom the other methods are
evident, which indicates a cutoff temperature (Tcutoff) below
which the ACTEX method breaks down. This is where the
two-body term at order 2 in the activity becomes comparable to the Saha term, which we use as a simple measure of the point where higher-order terms start to contribute. Since those
terms are not included inACTEX, we can consider this to be
the limit of the current theory. Moreover, we have plotted the
percent differences betweenACTEXand X2152 data (see Fig.6
for the comparison in energy; pressure plots look similar), and
found the cutoff is dependent on the density:Tcutoffgradually
[image:10.590.315.531.63.242.2]FIG. 5. Comparison of the pressure-temperature profiles of BN
along several isochores from PIMC, DFT-MD (PAW, frozen 1s),
DFT-MD (ONCV, frozen 1s), FOE (all electron), SQ (all electron),
ACTEX,MECCA, and X2152. Subplot (b) is a zoom-in version of (a).
0.1 to 20 times ρ0. Above Tcutoff, the agreement between
ACTEX and X2152 data is excellent, with differences below 2% in general.
Our pressure-temperature profiles by MECCA are overall
consistent with those by PIMC, PAWpw, ONCVpw, FOE,
SQ, and ACTEX. The agreement is best at densities higher
than 4.5 g/cm3 and temperatures higher than 106K, where
the contributions to the EOS from the ions (the ion-thermal contributions) are less significant than those from the thermal
electrons (see Fig.7).
At intermediate-low densities (0.23–2.3 g/cm3), we
ob-serve a discrepancy betweenMECCAand the DFT-MD/X2152
data, and it grows larger as temperature decreases further
below 105K. This is because the MECCA simulations are
performed using static configurations with two atoms in the
105
106
107
108
109
1 10
Temperature (K)
Density (g/cm
3)
-2 -1.5 -1 -0.5 0 0.5 1 1.5 2
0.1 0.2 0.5 1 2 3 5 8 15x
FIG. 6. Percent difference in internal energy of BN between
ACTEX and X2152 along several isochores. The compression ratio
(with respect to ρ0=2.258 g/cm3) are labeled at the top of the
plotting area. The reference points forACTEX and X2152 are both
atρ0and ambient temperature.
B2 (cesium chloride) structure, which do not include ion motion, and we have thus approximated the ion-thermal effect by adding ideal-gas corrections to the pressures and energies. However, at the low-temperature conditions, the nuclei show significant correlations by forming polymers, such as N-N pairs or B-N structures, that are characterized by the strong
fluctuations in the radial pair distribution function at 104 K
and shown in Figs.8(a)–8(c). Therefore, by disregarding the
vibrational and rotational contributions, the ideal-gas model underestimates the EOS at these conditions. As temperature
exceeds 5×10⁴K, the features in the pair distribution
func-tion quickly smooth out because the polymeric structures are destabilized by thermal effects, which makes the ideal-gas approximation for the ions work better and explains the improved agreement between the EOS from DFT-MD and MECCA. Moreover, we note that the agreement between the
EOS from X2152 andMECCAcan be improved by replacing
the ideal-gas correction with the ion-thermal model from
X2152. The differences atρ > ρ0reduce more by applying a
constant shift to theMECCApressures to anchor the
pressure-zero point atρ0and 300 K. These findings explain the good
consistency between the shock Hugoniot predicted by X2152 andMECCAEOS data, which we address in Sec.V C.
At densities higher than 2.26 g/cm3, the radial distribution
function also shows significant pair correlations at
tempera-tures below 105K [Figs.8(d)–8(f)]. However, the agreement
between the EOS fromMECCAand those from DFT-MD are
far better than at lower densities. This is the regime where
the cold-curve contribution dominates the EOS, as Fig. 7
implies. The excellent agreement betweenMECCAand
[image:11.590.43.288.64.500.2]Density (g/cm
3)
Pele in Pt
104 105 106 107 108
1 10
0 20 40 60 80 100
0.1 0.2 0.5 1 2 3 5 8 15x
Temperature (K)
Density (g/cm
3)
Pion in Pt
104 105 106 107 108
1 10
[image:12.590.75.506.62.281.2]0.1 0.2 0.5 1 2 3 5 8 15x
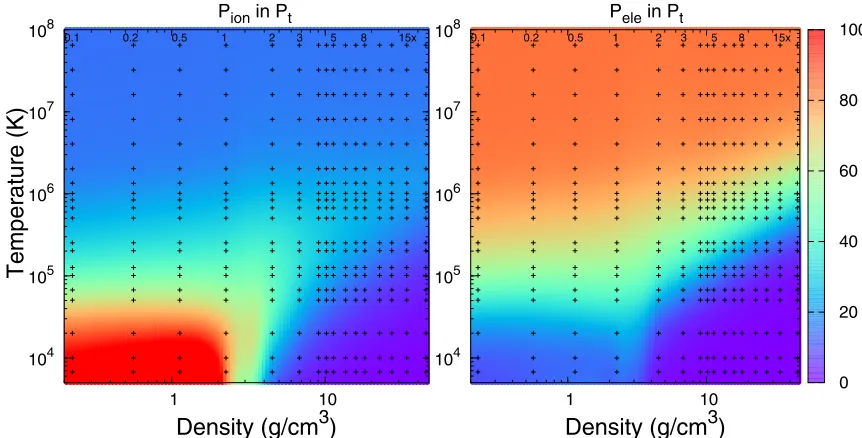
FIG. 7. Percent contributions of the ion-thermal (left) and electron-thermal (right) terms to the total pressure of BN. The remaining contributions are from the cold curve. The temperature-density conditions corresponding to several isochores along which we performed
EOS calculations are shown with “+” symbols.
nonideal ion-thermal contribution are less significant in the
more strongly compressed (ρ5×ρ0) regime.
At 2.26 g/cm3 andT <2×10⁴K, we also observe
dif-ferences between X2152 and DFT-MD. This can be explained
FIG. 8. Comparison of the nuclear pair correlation function ob-tained from DFT-MD (PAWpw) for BN using 24-atom (red) and 96-atom (dark) cells at two different densities and three temperatures.
The reference densityρ0is 2.26 g/cm3. The peaks at 104K indicate
a polymeric structure of the liquid. Differences between small and large cells are evident at 4000 K, indicating a significant finite-size effect. This effect is stronger at higher densities and becomes
negligible at temperatures higher than 5×10⁴K.
by the differences in the cold curve between X2152 and
DFT-MD. The energy minimum in X2152 is set to ρ0=
2.26 g/cm3 corresponding to h-BN, while DFT-MD tends
to stabilize c-BN because of the cubic simulation cell being
implemented for the liquid simulations. In fact, we found that
altering the cold curve in X2152 such that the ρ0 is more
in line with the ambient density of c-BN allows for better
agreement with these low-temperature points.
We compare the EOS data from SQ with those from PIMC,
FOE, andMECCAalong two different isotherms: 1.01×10⁶
and 1.35×10⁶ K. Their values are listed in Table III and
the differences shown in Figs. 9(a) and 9(b) for pressures
and energies, respectively. Our FOE and SQ pressures are in excellent agreement with each other (differences are less than 1%). This can be explained by the use of all-electron ONCV potentials and the DFT-MD nature of both methods. The FOE energies are slightly lower than the SQ values by 1%–2% of the corresponding ideal-gas values. The small differences can be attributed mainly to different discretization errors in the two approaches, whereas differences associated with trajectory lengths, pseudopotentials, and exchange-correlation functionals were determined to be an order of magnitude smaller.
Our PIMC data at these temperatures scatter around the DFT values because of the longer paths and larger error bars at such conditions. The differences between PIMC and SQ are
<4% in pressure and1 Ha/atom (or3% when normalized
by the ideal-gas value) in energy, which is typical of what we found about differences between PIMC and DFT-MD in previous work on B [3] and hydrocarbon systems [3,67]. MECCAdata also agree with SQ and FOE at these conditions,
with differences <3% in pressure and <0.4 Ha/atom (or
<1.5% when normalized by corresponding ideal-gas values)
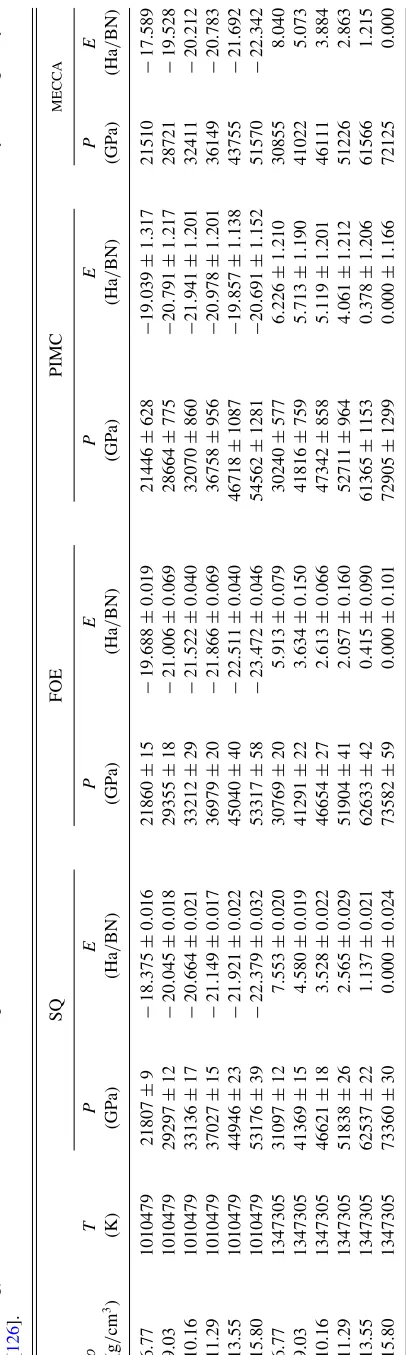
[image:12.590.38.286.397.650.2]T A BLE III. Comparison o f computed internal ener gies and p ressures from S Q, FOE, PIMC, and MECCA . T he ener gies ha v e been shifted b y setting the reference to their respecti v e v alues at 15 . 80 g / cm 3and 1 . 35 × 10 6K , at which the pressures are close to each other . The errors in the S Q, FOE, and P IMC data are the statistical 1 σ error b ar determined by blocking analysis [ 126 ]. SQ FOE P IMC MECCA ρ TP E P E P E P E (g / cm 3) (K) (GP a) (Ha / BN) (GP a) (Ha / BN) (GP a) (Ha / BN) (GP a) (Ha / BN) 6.77 1010479 21807 ± 9 − 18 . 375 ± 0 . 016 21860 ± 15 − 19 . 688 ± 0 . 019 21446 ± 628 − 19 . 039 ± 1 . 317 21510 − 17.589 9.03 1010479 29297 ± 12 − 20 . 045 ± 0 . 018 29355 ± 18 − 21 . 006 ± 0 . 069 28664 ± 775 − 20 . 791 ± 1 . 217 28721 − 19.528 10.16 1010479 33136 ± 17 − 20 . 664 ± 0 . 021 33212 ± 29 − 21 . 522 ± 0 . 040 32070 ± 860 − 21 . 941 ± 1 . 201 32411 − 20.212 11.29 1010479 37027 ± 15 − 21 . 149 ± 0 . 017 36979 ± 20 − 21 . 866 ± 0 . 069 36758 ± 956 − 20 . 978 ± 1 . 201 36149 − 20.783 13.55 1010479 44946 ± 23 − 21 . 921 ± 0 . 022 45040 ± 40 − 22 . 511 ± 0 . 040 46718 ± 1087 − 19 . 857 ± 1 . 138 43755 − 21.692 15.80 1010479 53176 ± 39 − 22 . 379 ± 0 . 032 53317 ± 58 − 23 . 472 ± 0 . 046 54562 ± 1281 − 20 . 691 ± 1 . 152 51570 − 22.342 6.77 1347305 31097 ± 12 7 . 553 ± 0 . 020 30769 ± 20 5 . 913 ± 0 . 079 30240 ± 577 6 . 226 ± 1 . 210 30855 8.040 9.03 1347305 41369 ± 15 4 . 580 ± 0 . 019 41291 ± 22 3 . 634 ± 0 . 150 41816 ± 759 5 . 713 ± 1 . 190 41022 5.073 10.16 1347305 46621 ± 18 3 . 528 ± 0 . 022 46654 ± 27 2 . 613 ± 0 . 066 47342 ± 858 5 . 119 ± 1 . 201 46111 3.884 11.29 1347305 51838 ± 26 2 . 565 ± 0 . 029 51904 ± 41 2 . 057 ± 0 . 160 52711 ± 964 4 . 061 ± 1 . 212 51226 2.863 13.55 1347305 62537 ± 22 1 . 137 ± 0 . 021 62633 ± 42 0 . 415 ± 0 . 090 61365 ± 1153 0 . 378 ± 1 . 206 61566 1.215 15.80 1347305 73360 ± 30 0 . 000 ± 0 . 024 73582 ± 59 0 . 000 ± 0 . 101 72905 ± 1299 0 . 000 ± 1 . 166 72125 0.000
FIG. 9. EOS differences of PIMC (red), FOE (black), andMECCA
(blue) relative to SQ along two isotherms (1.01×10⁶ and 1.35×
106K). Because of the different references chosen in the EOS data
sets, all energies have been shifted by the corresponding value at
15.80 g/cm3and 1.35×10⁶K. The energy differences are
normal-ized by the corresponding ideal-gas values (21kBT per BN). The
statistical error bars correspond to the 1σ uncertainty of the FOE
and PIMC data.
approximations in each, are reliable for studying the EOS of warm-dense matter.
Figure 9 and TableIII also show the standard error bars
of our EOS data, determined by statistical averaging of the MD (for FOE and SQ) or PIMC data blocks. At the
tempera-tures of 1.01×10⁶–1.35×10⁶K, PIMC errors are 2%–3%
in pressure and ∼0.6 Ha/atom in energy; FOE errors are
0.05%–0.8% in pressure and 0.01–0.08 Ha/atom in energy.
In comparison, the statistical error bars of the SQ data are
significantly smaller (see Table III). These results establish
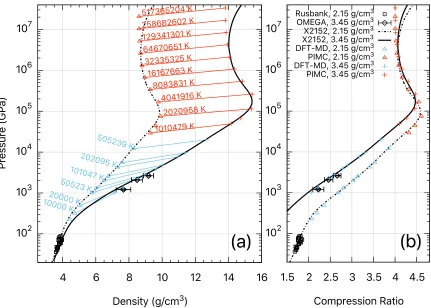
[image:13.590.306.552.62.486.2]FIG. 10. Comparison of the Hugoniot of BN from experiment to predictions from PIMC and DFT-MD (PAWpw) simulations and the X2152 model in (a) pressure-density and (b) pressure-compression ratio representations. The initial densities of corresponding Hugoniots are shown in the legend. In (a), equal-temperature conditions along the two Hugoniot curves are connected with lines (as guides to the eyes) to approximate the location of isotherms. The corresponding temperatures are labeled in colored texts. Note that the deviation between PIMC
and X2152 curves at above 106GPa is due to the electron relativistic effect, which is considered in X2152 but not in PIMC.
B. Comparison between theory and experiment
In this section, we compare our experimental measure-ments of the pressure-density relation of BN with our theoreti-cal predictions. The experimental data are along the Hugoniot curve, which varies depending on the properties of the sample
material. Figure 10 compiles the experimental and
theoret-ical Hugoniot curves corresponding to two different initial
densities (ρi): Omega data with ρi of 3.45 g/cm3 and the
Rusbank data [18] withρiof 2.15 g/cm3. The corresponding
theoretical predictions by X2152 are shown with dark curves. We also show the PIMC and the DFT-MD predictions for
3.45 g/cm3and 2.15 g/cm3.
The comparison in Fig.10shows very good consistency
between the measurements and the theoretical predictions. Assisted by the theoretical predictions, we are able to estimate Hugoniot temperatures for the experimental data. We label the Hugoniot temperatures for selected DFT-MD data points with
blue-colored text in Fig.10. We find the Omega data points
are in the temperature range of 104–105K. Our results also
show that the PIMC and DFT-MD predicted Hugoniot are in remarkable agreement with X2152 for both initial densities, which span the Hugoniot curves over a wide range in the phase space. This further shows the validity of the fitting and construction procedure and the quality of our X2152 table. Our calculations and the X2152 model predict BN to have
a maximum compression ratio of 4.59 at 9.8×10⁴ GPa for
ρi=2.15 g/cm3 and 4.47 at 1.8×10⁵ GPa for ρi=
3.45 g/cm3. We also note that the pressure-density Hugoniots
predicted by our different tabular models are very similar
(see Fig. 3) at the pressure regime (103–3×10³ GPa)
ex-plored in our current experiments. We expect future, accurate experiments at higher pressures (e.g., near the compression maximum) to further check our predictions.
C. Comparison of different EOS methods
Finally, we make a comprehensive comparison of the shock Hugoniot curves for BN predicted by our different EOS meth-ods. The pressure-compression and temperature-compression
Hugoniot curves from ACTEX, TF, MECCA, and X2152 are
shown in Fig. 11. We note that ACTEX and X2152 each
intrinsically accounts relativistic effects in the free-particle Hamiltonian, thus the Hugoniot deviates from the nonrela-tivistic ideal electron gas limit of 4 at very high temperatures
(>108K). In comparison, the relativistic correction has not
been applied to the TF calculation and theMECCAcalculations
are based on scalar relativistic calculations, which do not change the asymptotic ideal electron gas limit.
At pressures of ∼104–106 GPa and temperatures ∼3×
105–2×10⁷K,ACTEX, X2152, andMECCAyield very similar
Hugoniot profiles and a maximum compression of∼4.55 for
FIG. 11. Comparison of the pressure-compression Hugoniot of BN from different theories and LEOS models. The initial density of
every Hugoniot curve is 2.26 g/cm3. Two sets of DFT-MD (PAWpw)
Hugoniots constructed with a difference of the cohesive energy
(Ecoh∼7.1 eV/atom [127]) in the initial energy are also shown for
comparison. Note that allMECCApressures in the EOS have been
shifted relative to the value at the initial density and 300 K. The
deviations at pressures above 106 GPa and 2×10⁷K are due to
the fully relativistic treatment of the free electrons in Purgatorio and
ACTEX.
to the TF model and the maximum compression ratio is lower
by∼0.2. The peak is associated with theK-shell ionization
of B and N, which is smoothed out in the TF model because electronic shell effects are missing in this approach but cap-tured by the other methods. The slightly larger compression
predicted byACTEX than X2152 is consistent with the2%
larger values of theACTEXEOS data than X2152 (Figs.5and
6). The slightly lower compression predicted byMECCAthan X2152 can be explained by the nonperfect reconciliation in pressure and energy terms in the Hugoniot function (MECCA pressures are slightly lower while energies are similar in
comparison to SQ and PIMC, as shown in Fig.9).
In the low-temperature condensed matter regime, we find
that, with a constant pressure shift in the EOS, our MECCA
predictions for the Hugoniot are in good consistency with those of X2152. This indicates the efficacy of using the ideal-gas model to approximate the ion-thermal effect when constructing EOS using small-size, fixed-lattice models (as inMECCA). Our TF results predict BN to be stiffer in this regime because the initial energy in TF is estimated using an
average-atom method (described in AppendixB), which may
be higher than the actual value because of the excess energy release due to bonding. We also show differences between X2152 and our DFT-MD (PAWpw) predictions, in particular
in Hugoniot temperatures [Fig. 11(b)]. This is because of
the EOS differences betweenh-BN andc-BN that we have
elaborated previously in Sec.V A.
D. EOS and Hugoniot of isoelectronic materials
Our EOS models and results for BN enable us to investi-gate the difference with C, an isoelectronic material of BN.
Figure12compares the Hugoniot of BN and of C based on
X2152 and LEOS 9061, setting their initial densities to be the
same (2.26 g/cm3). LEOS 9061 is the a multiphase EOS table
FIG. 12. (a) Pressure- and (b) temperature-density Hugoniot of BN in comparison with C. The electron-thermal contribution to both tables is based on Purgatorio. The initial density of both materials is
set to be 2.26 g/cm3.
constructed for C by using a Purgatorio table for the electron-thermal term and fitting DFT and PIMC data [128] to obtain the ion-thermal term, similar to our present work on BN.
The Hugoniot comparison shows that, at temperature
regimes of both 105–106K and >107K, the compression
ratio of BN is higher than C. The compression peak is thus
slightly narrower for C. This is because the K level of C
is in-between those of B and N. The differences between
BN and C in the low-pressure condensed-matter region (T <
105K) reflect differences in the cold-curve and ion-thermal
contributions to the EOS. These differences are physically consistent with the influence of different types of interactions between atoms in the two materials. BN has slightly higher ionic character than C due to the differences between the elec-tronegativity of B and N, associated with dipolar interactions between the nonidentical atoms.
E. Zero-point motion effects
We have also examined the effect of zero-point motion (ZPM) on the EOS and Hugoniot of BN. In order to do this, we implement the Debye model [129] to estimate the mag-nitude of the EOS contributions due to ZPM. This correction reasonably accounts for the nuclear quantum effects that have been neglected in the our Born-Oppenheimer MD simula-tions. According to the Debye model, the harmonic vibration
energy can be approximated by δE =9kBD(V)/8, where
D(V) is the volume-dependent Debye temperature and is
related to the ambient density viaD(V)=D(V0)(ρ/ρ0)γ
withγ being the Grüneisen parameter, and the corresponding
pressureδP=9γkBD(V)/8V. We take the valuesD(V0)=
1900 K andγ =1.1 forc-BN from previous measurements
and calculations [14,22], apply the corrections to our EOS data from DFT-MD (PAWpw), and evaluate the changes in
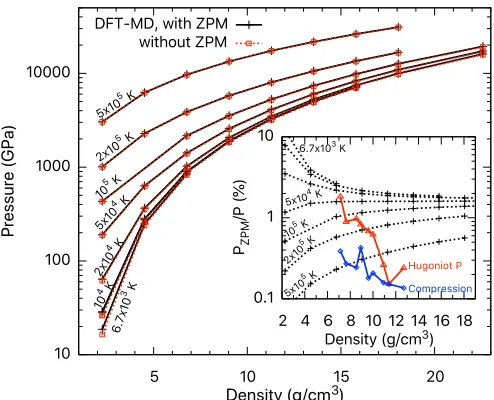
the Hugoniot curve. The results are summarized in Fig.13.
Our results show that ZPM causes a pressure increase by
over 10% at 6.7×10³K and ambient density. This
percent-age difference decreases gradually to∼1% at 20 g/cm3. The
[image:15.590.306.553.63.215.2]