RESEARCH
Custom made inclusion bodies:
impact of classical process parameters
and physiological parameters on inclusion body
quality attributes
Christoph Slouka
1, Julian Kopp
1, Stefan Hutwimmer
2, Michael Strahammer
1, Daniel Strohmer
1,
Elisabeth Eitenberger
3, Andreas Schwaighofer
3and Christoph Herwig
1,4*Abstract
Background: The bacterium E. coli is a major host for recombinant protein production of non-glycosylated prod-ucts. Depending on the expression strategy, the recombinant protein can be located intracellularly. In many cases the formation of inclusion bodies (IBs), protein aggregates inside of the cytoplasm of the cell, is favored in order to achieve high productivities and to cope with toxic products. However, subsequent downstream processing, including homogenization of the cells, centrifugation or solubilization of the IBs, is prone to variable process performance or can be characterized by low extraction yields as published elsewhere. It is hypothesized that variations in IB qual-ity attributes (QA) are responsible for those effects and that such attributes can be controlled by upstream process conditions. This contribution is aimed at analyzing how standard process parameters, such as pH and temperature (T) as well as different controlled levels of physiological parameters, such as specific substrate uptake rates, can vary IB quality attributes.
Results: Classical process parameters like pH and T influence the expression of analyzed IB. The effect on the three QAs titer, size and purity could be successfully revealed. The developed data driven model showed that low tem-peratures and low pH are favorable for the expression of the two tested industrially relevant proteins. Based on this knowledge, physiological control using specific substrate feeding rate (of glucose) qs,Glu is altered and the impact is
tested for one protein.
Conclusions: Time dependent monitoring of IB QA—titer, purity, IB bead size—showed a dependence on classical process parameters pH and temperature. These findings are confirmed using a second industrially relevant strain. Optimized process conditions for pH and temperature were used to determine dependence on the physiological parameters, the specific substrate uptake rate (qs,Glu). Higher qs,Glu were shown to have a strong influence on the ana-lyzed IB QAs and drastically increase the titer and purity in early time stages. We therefore present a novel approach to modulate—time dependently—quality attributes in upstream processing to enable robust downstream processing.
Keywords: Escherichia coli, Inclusion body quality attributes, Recombinant protein production, Upstream development
© The Author(s) 2018. This article is distributed under the terms of the Creative Commons Attribution 4.0 International License (http://creat iveco mmons .org/licen ses/by/4.0/), which permits unrestricted use, distribution, and reproduction in any medium, provided you give appropriate credit to the original author(s) and the source, provide a link to the Creative Commons license, and indicate if changes were made. The Creative Commons Public Domain Dedication waiver (http://creat iveco mmons .org/ publi cdoma in/zero/1.0/) applies to the data made available in this article, unless otherwise stated.
Open Access
*Correspondence: [email protected]
4 Institute of Chemical, Environmental and Bioscience Engineering,
Research Area Biochemical Engineering, Vienna University of Technology, Gumpendorfer Strasse 1a, 1060 Vienna, Austria
Background
The gram-negative bacterium E. coli is the expression host of choice for the production of 30–40% of recom-binant drugs in industry [1, 2]. As E. coli shows very fast replication rates [3, 4] on comparatively inexpensive media [5], the benefits often outweigh the numerous purification steps [1, 6] and the missing glycosylation pattern [1, 7, 8]. Recombinant protein production in E. coli regained more interest as the demand in single chain antibody-fragments increased, which can be properly expressed in E. coli [1, 8]. The strain BL21(DE3) created by F. Studier and B. Moffatt back in 1986 [9] is often used in an industrial scale, because of very low acetate forma-tion, high replication rates [9–14], as well as the possibil-ity of protein secretion into the fermentation broth due to a type 2 secretion protein [15–17]. For expression of the recombinant protein, the lac operon is still one of the most favored promotors in pET-expression-systems using integrated T7-polymerase for high transcrip-tional rates [3, 12, 18]. The repressor protein can only be blocked by allolactose or a structural analogue [19], e.g. the well-known expensive inducer isopropyl β-d-1 thi-ogalactopyranoside (IPTG) [3, 13]. However, induction with IPTG stresses the cells, as IPTG in higher concen-trations is known to be toxic [13, 18, 20].
Recombinant proteins are often expressed as inclusion bodies (IB). IBs have originally been believed to be waste products by bacteria [21], until it was realized that they are formed as a stress reaction by the cells resulting in a biologically inactive precipitated protein [22–24]. Such stress reactions can be caused by high temperatures, pH-shifts or occur due to high feeding rates. These factors tend to result in higher yields of product [1], which of course are advantageous combined with the possibility of expressing toxic proteins [6]. Still, the DSP and especially the refolding unit operation suffers in robustness and is the most time-consuming step in gaining the correctly folded product from E. coli cultivations [21–24], which requires significantly more technology and time, when purifying IBs [22, 25, 26].
Quality attributes (or key performance indicator) of IBs, such as titer and morphology changes during extrac-tion procedures have already been studied and show that IBs are dynamic structures depending on the cultiva-tion and extraccultiva-tion condicultiva-tions [27–29]. First approaches towards IB sizing in the upstream process have already been made within our group by Reichelt et al. [30] using transmission electron microscopy [31] in combination with nanoparticle tracking analysis (NTA) revealing gen-eral trends of IB growth during cultivation. Further stud-ies show that IBs consist of up to 50% correctly folded protein in contrast to the general perception of IBs as inactive structures [29, 32]. Combined with the fact
that IBs can be produced in high concentration (so that the amount of generated product often outweighs the additional downstream steps), IB based processes are believed to fundamentally boost time/space yields for recombinant protein production [1, 6, 7, 21]. Knowledge about the state of IB QAs during a cultivation process is therefore of utmost importance. Three IB QAs are gen-erally of importance: bead size, titer and purity, as those three quality attributes were already defined elsewhere [21, 30, 33, 34]. It has been reported that inclusion body sizes can be measured with different methods, e.g. AFM (atomic force microscopy), TEM and NTA [21, 30, 33]. SDS-pages and ELISA-methods have been often reported as tool to determine impurities and titer in the IB prod-uct samples [35]. The impact of single process parameters like pH on IB QAs has already been investigated in litera-ture [36, 37]. Reichelt et al. [34] showed that alterations of (qs,glu) influence the behavior of common IB-processes,
using IPTG as an inducer. The impact of the feeding rate onto product formation in E. coli BL21(DE3) has been investigated recently, though lactose was used as inducer instead of IPTG [38]. However, no monitoring of all IB-QAs over induction time has been performed in any of the previous studies.
In this study we performed cultivations with a BL21(DE3) strain, producing a recombinant protein cou-pled to a N-pro-fusion protein [39]—strain 1—and a non N-Pro fused protein—strain 2-, both exclusively express-ing IBs, as the products are highly toxic for the cell. Clas-sical process parameters were monitored as a function of induction time. The impact of process parameters on IB bead size in combination with purity and titer as a func-tion of time has not been investigated in depth. Second-ary structure of different IB sizes were analyzed using IR and showed no differences for IB beads of different size compared to the standard. Based on these results, the physiological parameter of the specific substrate uptake rate (qs,glu) is altered at constant pH and T for strain 1
and QAs are analyzed time-dependently. In this current study we collected time resolved results, which are used to optimize the USP. In conclusion, it is demonstrated that low T and low pH in combination with high qs,glu are
beneficial for increasing the productivity and robustness of IB based processes for the two tested proteins.
Methods Strains
Strain 1 was an E. coli BL21(DE3) with the pET[30a] plas-mid system (kanamycin resistance) for recombinant pro-tein production. The target propro-tein was linked to a N-pro fusion protein used for purification [39]. Strain 2, E. coli
protein occurs only as IB since the product is toxic to the cell. No N-Pro tag is fused to this product.
Bioreactor cultivations Strain 1
All bioreactor and preculture cultivations for strain 1 were carried out using a defined minimal medium referred to DeLisa et al. [5]. Batch media and the pre-culture media had the same composition with different amounts of glucose respectively. The glucose concentra-tions for the phases were: 8 g/L for the preculture, 20 g/L for the batch phase. The feed for fed-batch and induction had a concentration of 300 g/L glucose.
Antibiotic was added throughout all fermentations, resulting in a final concentration of 0.02 g/L of kanamy-cin. All precultures were performed using 500 mL high yield flasks. They were inoculated with 1.5 mL of bacte-ria solution stored in cryos at − 80 °C and subsequently cultivated for 20 h at 230 rpm in an Infors HR Multitron shaker (Infors, Bottmingen Switzerland) at 37 °C.
All cultivations were either performed in a stainless-steel Sartorius Biostat Cplus bioreactor (Sartorius, Göttingen, Germany) with 10 L working volume or in a DASGIP Mini bioreactor-4-parallel fermenter sys-tem (max. working volume: 2.5 L; Eppendorf, Ham-burg, Germany). Cultivation off gas was analyzed by gas
sensors—IR for CO2 and ZrO2 based for O2 (Blue Sens
Gas analytics, Herten, Germany).
Process control was established using the PIMS Lucul-lus and the DAS-GIP-control system, DASware-control, which logged the process parameters. During batch-phase and fedbatch batch-phase pH was kept constant at 7.2 and controlled with base only (12.5% NH4OH), while acid
(5% H3PO4) was added manually, when necessary. The
pH was monitored using an EasyFerm Plus pH-sensor (Hamilton, Reno, NV, USA). The reactors were continu-ously stirred at 1400 rpm and aerated using a mixture of pressurized air and pure oxygen at 2 vvm. Dissolved oxy-gen (dO2) was always kept higher than 30% by
increas-ing the ratio of oxygen in the increas-ingas. The dissolved oxygen was monitored using a fluorescence dissolved oxygen electrode Visiferm DO (Hamilton, Reno, NV, USA). The fed-batch phase for biomass generation was followed by an induction phase using a feed medium with glucose as primary carbon source.
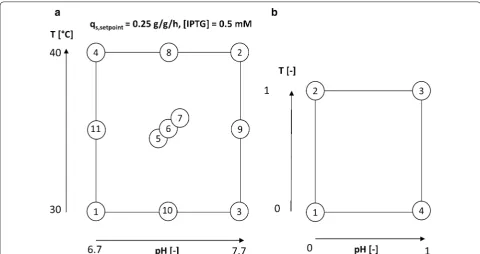
0.5 mM IPTG was added as an inducer once to start the induction of the cells. pH and temperature in the induc-tion phase was adapted according to the design of experi-ments (DoE) given in Fig. 1a. pH was altered between 6.7 and 7.7 and temperature between 30 and 40 °C. The center point at 35 °C and pH 7.2 was cultivated in tripli-cate in order to assess statistical experimental error.
Strain 2
Strain 2 was cultivated at our industrial partner. The cul-tivation was similar to strain 1 using chemically defined medium containing 15 g/L glucose in seed and 10 g/L glucose in main stage fermentations, respectively. Inocu-lum preparation and respective antibiotic selection were similar to strain 1, though during the main culture stage kanamycin was added. Seed and main culture cultiva-tions were carried out in custom built 50 L stainless steel vessels with custom made fermentation software for pro-cess control. Throughout the seed and main fermentation stages the pH was adjusted to fit the parameters of the second DoE (Fig. 1b) using 150 g/L sulphuric acid or 25% ammonia. Temperature was adjusted to the correspond-ing values in main culture. Dissolved oxygen was adjusted to 30% using aeration with up to 2 vvm, 2 bar backpres-sure and stirring up to 500 rpm. Optical DO probes Visipro DO (Hamilton, Reno, NV, USA) and EasyFerm Plus pH probes (Mettler Toledo, Columbus, Ohio; USA) were used for monitoring and control. Off-gas analysis was conducted using a custom-built mass spectrometer facility. At OD600 > 8.5 in seed culture, main culture was
inoculated using 8.6% (v/v). Upon glucose depletion a glucose feed was initiated using a µ of 0.3 h−1 for 6 h and
was kept constant at a final rate of exponential feed pat-tern until process termination. Expression was induced 2 h after the end of exponential feeding for biomass pro-duction using 1 mM IPTG for 12 h in a reduced design space given in Fig. 1b. As high temperatures and alkaline pH (fermentation conditions 2 in Fig. 1a) showed pro-nounced lysis during the study, the design space for strain 2 was reduced to a more reasonable pH and temperature window which is commonly used for multiple E. coli cul-tivations. Absolute values for pH and T cannot be given due to confidential reasons by our industrial partner.
Cultivation analytics Biomass
For dry cell weight (DCW) measurements 1 mL of the cultivation broth was centrifuged at 9000 rpm, subse-quently washed with 0.9% NaCl solution and centrifuged again under the same conditions. After drying the cells at 105 °C for 48 h the pellet was evaluated gravimetri-cally. DCW measurements were performed in five repli-cates and the mean error for DCW was about 3%. Offline OD600 measurements were performed in duplicates in
a UV/VIS photometer Genisys 20 (Thermo Scientific, Waltham, MA, US).
Flow cytometry
Flow cytometry (FCM) was carried out according to Langemann et al. [36]. We used a CyFlow® Cube 6 flow cytometer (Partec, Münster, Germany) with 488-nm
blue solid-state lasers. Three fluorescence channels were available (FL1, 536/40 nm bandpass; FL2, 570/50 nm bandpass; FL3, 675 nm longpass) alongside forward scat-ter (trigger paramescat-ter) and side scatscat-ter detection. This device featured true absolute volumetric counting with a sample size of 50–100 μL. Data were collected using the software CyView 13 (Cube 6; Partec) and analyzed with the software FCS Express V.4.07.0001 (DeNovo Software, Los Angeles, CA, USA). Membrane potential-sensitive dye DiBAC4(3) (abs./em. 493/516 nm) was used for the
assessment of viability. Fluorescent dye RH414 (abs./em. 532/760 nm) was used for staining of plasma membranes yielding strong red fluorescent enhancement for the anal-ysis of total cell number. Combining those two dyes it was possible to quantify the viable cell concentration. Stocks of 0.5 mM (DiBAC4(3)) and 2 mM RH414 were
pre-pared in dimethyl sulfoxide and stored at − 20 °C. Both dyes were purchased from AnaSpec (Fremont CA, USA). 1.5 μL of both stocks were added to 1 mL diluted sam-ple resulting in final concentrations of 0.5 μM DiBAC4(3)
and 2.0 μM RH414, respectively. Samples were meas-ured directly after addition of the dyes, without further incubation.
Sugar analytics
Sugar concentrations in the filtered fermentation broth were determined using a Supelco C-610H HPLC col-umn (Supelco, Bellefonte, PA, USA) on an Ultimate 300 HPLC system (Thermo Scientific, Waltham, MA, US) using 0.1% H3PO4 as running buffer at 0.5 mL/min or an
Aminex HPLC column (Biorad, Hercules; CA, USA) on an Agilent 1100 System (Agilent Systems, Santa Clara, CA, USA) with 4 mM H2SO4 as running buffer at 0.6 mL/
min.
Product analytics IB preparation
5 mL fermentation broth samples were centrifuged at 4800 rpm at 4 °C. The supernatant is discarded and the pellet is resuspended to a DCW of about 4 g/L in lysis buffer (100 mM Tris, 10 mM EDTA at pH 7.4). After-wards the sample was homogenized using a high-pres-sure homogenizer at 1500 bar for 10 passages (Emulsiflex C3; Avestin, Ottawa, Canada). After centrifugation at 10,000 rpm and 4 °C the supernatant was discarded and the resulting IB pellet was washed twice with ultrapure water and aliquoted into pellets à 2 mL broth, centrifuged (14,000 rpm, 10 min 4 °C) and stored at − 20 °C.
IB size
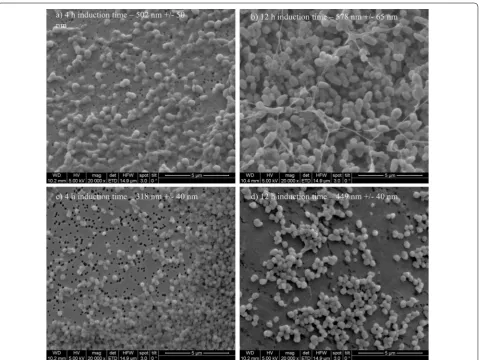
polycarbonate filter (Millipore-Merck, Darmstadt, Ger-many) using reusable syringe filter holders with a diame-ter of 13 mm (Sartorius, Göttingen, Germany). 100 µL of ultrapure water were added and pressurized air was used for subsequent filtration. Additional 200 µL of ultrapure water were used for washing. The wet filters were fixed on a SEM sample holder using graphite adhesive tape and subsequently sputtered with gold to increase the contrast of the sample. SEM was performed using a QUANTA FEI SEM (Thermo Fisher, Waltham, MA, US) with a second-ary electron detector [40]. The acceleration voltage of the electron beam was set between 3 and 5 kV. To deter-mine the diameter of the IBs, 50 IBs on SEM pictures were measured using the ImageJ plugin Fiji [Laboratory for Optical and Computational Instrumentation (LOCI), University of Wisconsin-Madison, US]. SEM analytics of two different time points for both strains are given in Fig. 2.
IB titer for strain 1
For titer measurements IB pellets were solubilized using solubilization buffer (7.5 M guanidine hydro-chloride, 62 mM Tris at pH 8). The filtered samples are quantified by HPLC analysis (UltiMate 3000; Thermo Fisher, Waltham, MA, USA) using a reversed phase col-umn (EC 150/4.6 Nucleosil 300-5 C8; Macherey–Nagel, Düren, Germany). The product was quantified with an UV detector (Thermo Fisher, Waltham, MA, USA) at 214 nm using Novartis BVS Ref. 02 as standard. Mobile phase was composed of acetonitrile and water both supplemented with 0.1% (v/v) trifluoride acetic acid. A linear gradient from 30% (v/v) acetonitrile to 100% acetonitrile (ACN) was applied. A steep linear gradient from 10% ACN to 30% ACN in 60 s was followed by a long linear gradient from 30 to 55% and by three regen-eration steps.
IB titer for strain 2
IB titer was also determined by reversed phase HPLC at Sandoz GmbH (Process Analytics, Kundl, Tirol, Austria). Pellets were defrosted at room temperature and solubi-lized by addition of dilution buffer [36] (6 M guanidine hydrochloride, 50 mM Tris, pH 7.5) and sonication (Branson Ultrasonics, Danbury, Connecticut, USA). The filtered samples were analyzed by HPLC with a reversed phase column (Acquity UPLC BEH 300, C4, 1.7 µm, 2.1 × 50 mm). Quantification was performed by UV detection at 214 nm wavelength and calibration with a purified product standard. Mobile phases were com-posed of (A) water and (B) acetonitrile/pentanol (95/5, v/v) both supplemented with 0.1% (v/v) tetrafluoride ace-tic acid. The elution of the product was achieved with a linear gradient of both solvents.
IB purity
Purity measurements were performed using chip-based protein assays with 2100 Bioanalyzer (Agilent Technolo-gies, Santa Clara, CA, USA. The chip-based assay is based on SDS-PAGE and therefore separates molecules accord-ing to their size. Washed and homogenized IBs were dis-solved in 3 M urea, 25 mM Tris at pH 7 and measured subsequently. The electropherogram was afterwards ana-lyzed using OriginPro 2016 (Northampton, MA, USA) integrating the peak area of the protein of interest and normalizing the area in respect to the total area of the electropherogram.
IB conformational analysis by IR spectroscopy
Infrared (IR) spectra were recorded by an external-cav-ity quantum cascade laser-based IR transmission setup described in detail by Schwaighofer et al. [31]. A water-cooled external-cavity quantum cascade laser (Hedgehog, Daylight Solutions Inc., San Diego, USA) was used oper-ating at a repetition rate of 100 kHz and a pulse width of 5000 ns. All spectra were recorded in the spectral tun-ing range between 1730 and 1470 cm−1, covering the
amide I and amide II region of proteins, at a scan speed of 1200 cm−1 s−1. The MIR light was focused on the
detector element by a gold plated off-axis parabolic mir-ror with a focal length of 43 mm. A thermoelectrically-cooled MCT detector operating at − 78 °C (PCI-10.6, Vigo Systems S.A., Poland) was used as IR detector. To reduce the influence of water vapor, the setup was placed in a housing of polyethylene foil and constantly flushed with dry air. The measured signal was processed by a lock-in amplifier (Stanford Research Systems, CA, USA) and digitized by a NI DAQ 9239 24-bit ADC (National Instruments Corp., Austin, USA). Each single beam spec-trum consisting of 6000 data points was recorded during the tuning time for one scan of approx. 250 µs. A total
of 100 scans were recorded for background and sample single beam spectra at a total acquisition time of 53 s. All measurements were carried out using a custom-built, temperature-controlled flow cell equipped with two MIR transparent CaF2 windows and 31 µm-thick spacer, at
20 °C.
The laser was controlled by Daylight Solution driver software; data acquisition and temperature control were performed using a custom-made LabView-based GUI (National Instruments Corp., Austin, USA). Two IB sam-ples with distinct size of 400 nm and 600 nm were com-pared with the finished formulated protein standard of
strain 1 (without N-Pro Taq).
Results and discussion
The goal of this study was to investigate and to under-stand if and how IB attributes can be changed and tuned by upstream bioprocess (USP) technological methods. We tested the classical process parameters pH and tem-perature and the physiological parameter specific sub-strate uptake rate. The impact of specific USP parameters can be investigated using IB QAs as response for data evaluation. With knowledge about the tunability of IB QAs in the upstream, it is possible to simplify the sub-sequent downstream steps. Therefore, we tested two different proteins, with completely different structure including N-Pro fusion tag for strain 1 and no fusion tag for strain 2. Both products have a high toxicity for the cell in common and are only expressed as IBs. The results constitute the key to custom made IBs and may be used as platform technology for the development of the USP for new products.
Impact of classical process parameters on IB QAs using strain 1 (N‑Pro fused protein)
As IPTG based induction imposes a metabolic stress to the host organism, time dependent analysis of IB QAs is of utmost importance to identify critical process time points (e.g. cell death, product degradation) within individual cultivation runs. Therefore, IB QAs were analyzed every 2 h within a maximum of 12 h induction time. pH and T were altered based on the experimen-tal plan, while specific substrate uptake rate (qs,Glu) and
inducer concentration were kept constant in all experi-ments. In Table 1 the applied parameters for T, pH and qs,Glu for all performed cultivations in the DoE are
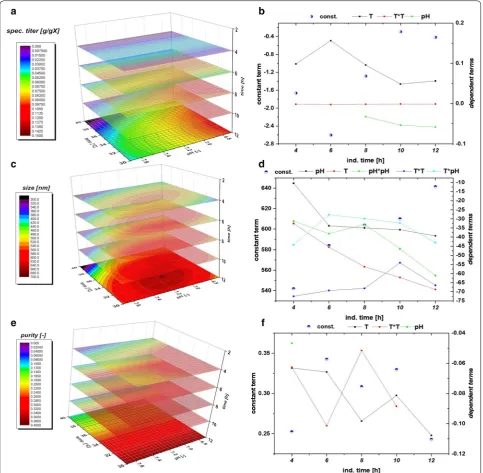
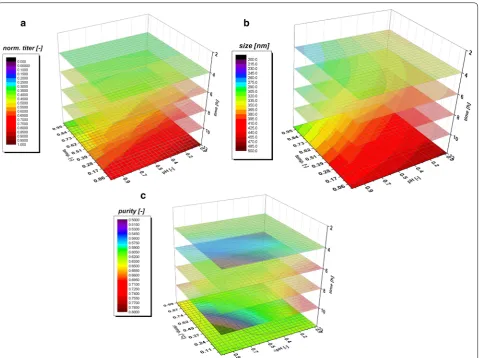
model quality. A clear dependence for the applied vari-ations in pH and T were found and visualized against induction time giving a time dependent analysis of the QAs. The evaluation of the specific titer [based on titer (g/L) divided by the biomass at the given timepoint (gX/L, resulting in g/g)] against the induction time and pH and T showed a clear dependence. The specific titer was used in order to compensate for deviations in the biomass after the non-induced fed batch, which yielded 25–30 g/L DCW. The maximum of spec. titer (not nec-essarily the spec. productivity at certain time point) was found at low T and low pH, shown in Fig. 4a. pH dependence got significant after 6 h of induction time and impacted (Fig. 4b) the spec. titer. The maximum of recombinant protein was produced between 8 and 10 h. This fact is well reflected by the const. parameter in
Fig. 4b. After 10 h cell death leads to a degradation and reduction of the produced protein, also clearly deduc-ible from the constant term, visdeduc-ible in FCM measure-ments and in pronounced glucose accumulation (data not shown).
Within single cultivation runs titer and IB bead size showed a very linear relationship in the mean diameter and the standard deviation until the onset of cell death. Process parameters pH and T affected the growth of IB beads significantly. Generally, the largest IB bead size could be found close to the center point of the DoE in the beginning of induction. The shift to lower T and pH can be spotted after 6 h of induction time (compare to Fig. 4c). Effects of cell death and product degradation in titer could also be spotted in the IB bead size espe-cially at 12 h. General trends of the fitting parameters are visualized in Fig. 4d. The constant model parameter is increased over time which also indicates the growth of IB beads over induction time. Linear terms pH and T and quadratic pH term showed increased impact on the model with elevated time, while interaction term and quadratic T-term stayed rather constant. A similar behavior for IB bead growth had already been obtained for a recombinant produced green fluorescent protein (GFP) in our group by Wurm et al. [33]. Instead of alter-ing pH and T like in this study, the induction strength using mixed feed systems with lactose as inducer was varied. Induction time and strength had a high impact on the IB bead size during these cultivations. In our model a certain deregulation of size compared to titer could be dedicated from the given data driven models. This fact is beneficial for regulation of individual parameters to increase the performance in the DSP process chain in a further aspect since size and titer can be varied separately to a certain extend. As third QA IB purity, as important factor for quality in the DSP, was analyzed.
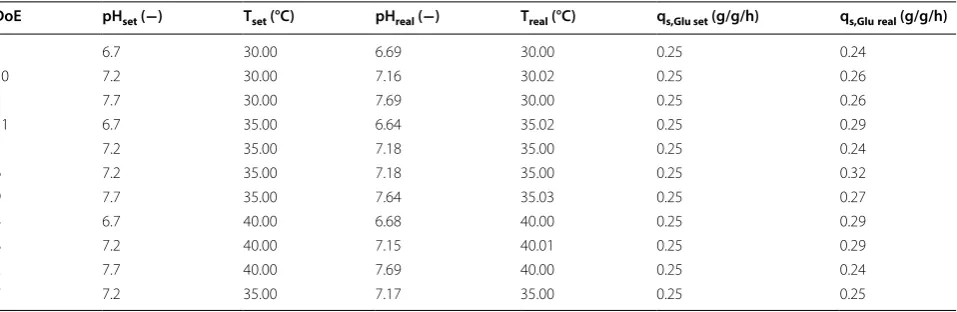
Table 1 Analysis of applied process parameters compared to set points in all DoE runs during induction phase
DoE pHset (−) Tset (°C) pHreal (−) Treal (°C) qs,Glu set (g/g/h) qs,Glureal (g/g/h)
1 6.7 30.00 6.69 30.00 0.25 0.24
10 7.2 30.00 7.16 30.02 0.25 0.26
3 7.7 30.00 7.69 30.00 0.25 0.26
11 6.7 35.00 6.64 35.02 0.25 0.29
5 7.2 35.00 7.18 35.00 0.25 0.24
6 7.2 35.00 7.18 35.00 0.25 0.32
9 7.7 35.00 7.64 35.03 0.25 0.27
4 6.7 40.00 6.68 40.00 0.25 0.29
8 7.2 40.00 7.15 40.01 0.25 0.29
2 7.7 40.00 7.69 40.00 0.25 0.24
7 7.2 35.00 7.17 35.00 0.25 0.25
The three-dimensional plot for purity determination is presented in Fig. 4e. At times, up to 4 h of induction pH influenced the purity of the IB samples. After 4 h, a sole dependence on temperature was found indicating that low temperatures (30 °C in the design) favor cleaner IBs. Since titer and size maximum could be found at low tem-peratures and pH, purity after homogenization may be
model fit beyond 4 h (only one point given). Tempera-ture has a major influence on the duration of the induc-tion time, which can already be detected in early stages of induction time. As purity is affected by the washing steps after homogenization different washing procedures may impact the value of absolute purity and the kind of impurity. Generally, porin structures and phospholipids from the outer membrane are the major part of impuri-ties in the IB after homogenization [41, 42]. In literature IB beads had already been analyzed by SEM and AFM in order to get insight into morphology [43] and into wash-ing procedures and dependence of pH and T within [44]. Different washing procedure had also been analyzed in this work. Buffer based washing tends to show little influ-ence in shape and morphology of IBs but has an effect on the analyzed purity value (Additional file 1: Figure S1). This may be attributed to phospholipid content, result-ing from homogenization of the cells, as buffer treatment successfully increases purity. Effects of washing on phos-pholipid content is also reported in [45]. Generally, SDS-PAGE techniques are used to separate different protein sizes. A few impurity peaks are found near the respective fusion protein size of 28.8 kDa and about 60 kDa (Addi-tional file 2: Figure S2 an IB purity for 4 h and 12 h of the validation run). These impurities correlating well to the size-range of a magnitude of outer membrane (e.g. ompA with 35.1 kDA [46]). To determine the extent of DNA in IB as impurities, we treated solubilized IB samples prior to an SDS-PAGE with DNAse 30 min at 37 °C (DNAse 1, Thermo Scientific, Waltham, MA, US). No differences in the gel could be spotted between untreated and treated samples (Additional file 2: Figure S2b). Therefore, we suppose little content of residual DNA within the IB sam-ples, which was also described in [45]. A higher IB purity is based on our model generally attributed to larger IB sizes. Since volume/surface ratio differs drastically com-pared to small beads less host cell structures can attach to the surface after homogenization. Buffer washing suc-cessfully removes a higher content of these impurities.
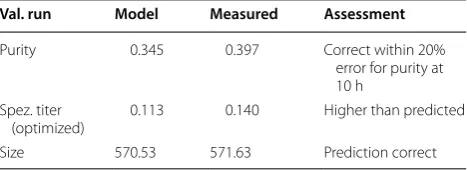
To evaluate the three data driven model approaches, we performed a verification run, aiming to achieve a maximum in titer of the recombinant protein including prediction of the respective attributes size and purity. Since the maximum of the titer could be found after 10 h of induction time, optimization is performed for this time stage. The process parameters received from the optimization algorithm for the induction phase were pH 6.7, T = 31.5 °C. Table 2 shows the comparison of the model prediction vs. the real measured values received after 10 h of induction. Standard cultivation reproduc-ibility based on center point cultivations of strain 1 are strongly time dependent, especially for titer and purity
assessment. Differences in the real qs,Glu during these
three runs may affect the reproducibility, especially in the beginning of the cultivations as will be shown in the forthcoming chapter. Mean values and deviations for the center point runs of strain 1 are given in Additional file 3: Figure S3. The standard deviation for size is below 10% until 10 h of induction, heading to about 15% at 12 h. Purity shows an error of about 30% for until 8 h reducing to values below 20% afterwards. Low titer values are gen-erally highly defective at early time stages of the induc-tion phase as a result of the onset of producinduc-tion. These high errors of about 30% reduce to about 10% after 8 h of induction. Using these assumptions for evaluation of the model clearly shown that model assumptions for size and purity QAs are correct within the given stand-ard deviations. The IB bead size range after 10 h is pre-dicted correctly, despite the general uncertainty of about 10% in the measurement statistics. Purity was correct within the 20% deviation at this time stage. Even slightly better results could be obtained for titer but are off the 10% deviation. This may be based on the slight higher qs, Glu of 0.3 g/g/h applied in this cultivation (overestimation
of biomass after the fed-batch phase). Production of the protein of interest and the expression rate seems to be strongly correlated to the induction stress level of the cell. Lower temperatures seem to be favorable for the survival of the E. coli cells and positively influenced all three ana-lyzed quality attributes. pH shifts to low pH increased the titer to a high degree at later induction stages and may be a result of a higher transmembrane potential, boost-ing the TCA and the energy metabolism [47]. As E. coli
can grow on a pH between 6.0 and 8.0, with an internal pH of 7.6 [48], the rather acid pH-optimum is surpris-ing at a first glance, but when investigated it is likely that the pH of 6.7 could be causing less precipitate of diverse trace elements, which are added in the DeLisa media [5]. Having access to more co-factors could positively influ-ence the IB-formation. pH shifts from 7.2 to 6.7 may also effect different enzymes in the cell, e.g. phosphofructoki-nase in glycolysis [48].
Table 2 Prediction vs. measured QA of IBs for model validation run
Val. run Model Measured Assessment
Purity 0.345 0.397 Correct within 20% error for purity at 10 h
Spez. titer
Secondary structure analysis of IBs exhibiting different size
In order to understand the impact of different IB size (produced in USP) on the secondary structure, IR meas-urements in the MIR range were performed and com-pared to the correctly folded protein standard of strain 1
for two distinct sizes exemplarily. Figure 5 shows the IR spectra of the reference sample and IB beads with 400 and 600 nm in size from the same cultivation run. The IB samples were resuspended in MQ water and subse-quently measured. The reference standard was measured in the formulated buffer. The IR spectrum of the refer-ence shows a band maximum at 1645 cm−1 in the amide I
region as well as a narrow band at 1545 cm−1 in the amide
II region that are characteristic for α-helical structures. In the reference sample, the native secondary structure of the protein is fully formed. Throughout the fermentation process, 400 nm size sample was taken after 4 h and the 600 nm sample was taken after 8 h. These samples also predominately feature α-helical secondary structure indi-cated by the amide I band maximum close to 1650 cm−1
[49]. However, these samples also contain different, non-native secondary structure as denoted by the band shoul-ders at approx. 1625 and 1680 cm−1 that suggest β-sheet
secondary structures. The IR spectra show that the extent of these non-native secondary structure components is different for the two samples taken from the cultiva-tion and that the amount is lower in the sample that was taken at a later point in time. This is in accordance with the purity measurements and indicates that later cultiva-tion times and larger IB sizes do not affect the secondary
structure of the IBs negatively. These results can be com-pared to the work of Wurm et al. [33] and corresponds to the data, that impurity content drastically decreases with IB size in solubilization and refolding.
Validation of the impact of classical process parameters on IB QAs using strain 2
For application of the proposed QA dependence used for strain 1, a reduced design space (compare to Fig. 1b) for strain 2 was applied and quality attributes were ana-lyzed as described for strain 1. Strain 2 also produces a toxic protein for the cells and is consequently expressed only as IBs but lacking the N-Pro fusion tag. As only four cultivations were performed, no statistical evaluation is used and fits were performed in order to have a rea-sonable model description and to reveal general trends during those cultivations. Estimation on standard devia-tions for the given QAs are already given in the previous section. In comparison to strain 1 higher titers could be achieved during the cultivation. (Figure 6a—normalized to the highest achieved titer in these cultivations, given in 1 [−]). Time dependent analysis of the IB bead size is shown in Fig. 6b and reveals the same trend as already valid for titer and purity. Low pH and low temperatures lead to increased IB bead size in those cultivations. How-ever, IB bead size is generally smaller in strain 2, when compared to strain 1 respectively (N-Pro based protein, clearly visible by comparing Fig. 2b, d). The dimension-less value of purity is generally very high as well, exceed-ing values of 0.5 even after 4 h of induction, compare to Fig. 6c. In accordance to strain 1 the highest titers and purities are found at a low pH and low temperatures.
Different IB bead size for a broad number of pro-teins was already presented in literature: A GFP model protein, expressing IBs as well as soluble protein [33] showed IB bead size of a maximum of 600 nm at extended induction times using mixed feed systems with glucose and lactose. Since, GFP also is expressed as soluble protein, only the ratio between IB and solu-ble protein is altered based on the feeding strategies. Producing a maximum size of 600 nm, the GFP-model protein forms an intermediate between the meas-ured maximum of strain 1 (N-Pro) and strain 2 in this work. Other works report IB sizes between 502 nm for DnaK-IBs and 580 nm for ClpA-IBs [27] and approxi-mately 600 nm for G-CSF IBs [28] and are in a reason-able range compared with our products in this work. IB bead size is strongly dependent on the produced prod-uct, on the polypeptide sequence and on hydrophobic-ity of the protein structure. IB QAs can accordingly be altered with the used classical process parameter T and pH, but morphological considerations have gener-ally to be taken into account and can be product-based Fig. 5 IR spectra of the two distinct bead sizes of 400 and 600 nm,
very different. Since IPTG concentration of 0.5 mM is high enough to induce all present cells, the second-ary structure of the expressed proteins of strain 2 has to inhere in higher density in their structure regard-ing the titers. Denser structures are much easier to be separated in centrifugation processes in the down-stream, since the difference of the density compared to the host cell debris is far higher. This fact may also affect the purity and results in those high purity values for strain 2. Computer tomographic analysis of trans-mission electron microscopy (not shown) of strain 1
reveal cavities within single inclusion bodies in the cell and may be the result for density variations of differ-ent IB products. Based on the findings for both strains in this study, time-resolved analytics of the IB QAs can be used to optimize the USP. Knowledge of titer as key
performance indicator is important for determination of the harvest time point. The resulting IB bead size (and purity) is beneficial for planning of further neces-sary steps in the downstream for a given product.
Impact of the physiological process parameter qs,Glu on IB
quality attributes of strain 1 (N‑Pro fused protein)
Classical process parameters showed a high impact on IB properties during induction phase. The knowledge for optimized parameters for strain 1—was used for alter-ing the physiological parameter qs,Glu. Temperature was
decreased to 31.5 °C and pH was adapted to 6.7, while different setpoints for qs,Glu were established during
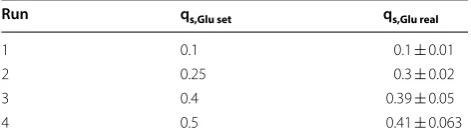
induction phase. Setpoints and real values for the qs,Glu
accumulation and percentage of dead cells for the four performed cultivations. It was already investigated in lit-erature that the correlation of growth rate and the pro-duction of recombinant protein resulted in a decrease in µ the more recombinant protein is produced [50]. This correlation could be clearly monitored in our study dur-ing induction phase when high titers of recombinant protein were produced. As consequence the growth rate (not shown) decreased, leading to sugar accumulations as the feed-rate over the whole induction phase was applied constantly [50]. Higher applied qs,Glu resulted in early
sugar accumulation and in increased number of dead cells in the cultivation and decreased the real qs,Glu
exten-sively even after some hours. After 12 h of induction 50% of the culture died at applied qs,Glu of 0.4 and 0.5 g/g/h,
while very low qs,Glu showed neither cell death nor sugar
accumulation. The time resolved titer measurements are given in Fig. 7b. Very high specific titers could be found at qs,Glu-set= 0.5 g/g/h at 6 h of induction with highest
volumetric productivities exceeding 1 g/L/h. However, the increased cell stress resulted in cell death and deg-radation of the product as could be seen in the decease of the titers at later time stages, respectively. After 12 h titers were almost identical irrespective of applied qs,Glu
for high setpoints (0.3–0.5 g/g/h). That indicated, time dependent analysis of QAs is therefore of utmost impor-tance, especially at physiological process control. The peak value of the volumetric productivities (before deg-radation) showed a rising trend based on the mean qs,Glu
values which were applied (Additional file 4: Figure S4) and clearly indicated that the increased feeding rate is really beneficial for high productivity. The IB bead size given in Fig. 7c was generally very similar at qs,Glu= 0.3–
0.5 g/g/h applied values, with qs,Glu= 0.3 g/g/h
show-ing smaller diameters at later time stages. IB beads at
qs,Glu= 0.1 g/g/h were not detectable with SEM until 10 h
of induction time. Low qs,Glu yielded very small IB sizes
and low titers in Fig. 7b as only low energy is available for production of the recombinant protein. A steep increase in the beginning of the induction time was generally accompanied by leveling off in diameter at later stages. Trends for IB purity are given in Fig. 7d. Higher qs,Glu
val-ues were beneficial for protein purity, which were in rea-sonable accordance with trends for titer and size already seen in the previous chapter.
Based on these findings improved control strategies for IB production could be established in further develop-ment steps using the optimized process parameters for the two used strains in combination with physiological process control (time dependent adaption of the specific substrate uptake rate) during the induction phase.
Conclusions
IB quality attributes were analyzed in respect of changes in classical process parameters pH and T in the induction phase. Pronounced changes in QAs could be found in the analysis of IB titer, IB bead size and IB purity. Optimized process conditions for strain 1 were found to be at pH 6.7 and 31.5 °C during induction in respect of the produced maximum IB titer. These findings were checked using a second industrial relevant strain, revealing that low tem-peratures and low pH is highly beneficial for production of IBs. Therefore, we would like to hypothesize that yields of exclusively IB based products can be improved by applying low temperatures and a relatively low pH value during the induction phase as analyzed in this study for two very different products. Despite of this platform knowledge, absolute values for size, titer and purity were strongly product dependent and exhibit very different values for every produced product.
The sweet spot conditions (pH 6.7, T = 31.5 °C) for
strain 1 were used to show the impact of physiological control onto IB quality attributes. The four performed cultivations exhibited different specific substrate uptake rates (qs,Glu) and revealed high impact on analyzed IB
QAs. High constantly applied qs,Glu boosted titer, bead
size and purity very early in the induction phase, but resulted generally in high glucose accumulation and cell death, while low qs,Glu did not stress the cells, but lead to
very low production of IBs. Physiological control based on these findings may be highly industrially relevant in
Table 3 Applied qs,Glu vs. real qs,Glu values after reverse
analysis of the cultivation data
Sugar accumulation and cell death at higher applied values result in higher standard deviations
Run qs,Glu set qs,Glu real
1 0.1 0.1 ± 0.01
2 0.25 0.3 ± 0.02
3 0.4 0.39 ± 0.05
order to find IB parameters with high productivity, but also low contamination of host cell proteins and DNA.
We would also like to highlight that time dependent monitoring of the here defined IB-QAs can be used as
a tool to optimize process parameters such as pH, tem-perature and (qs,Glu). By improving the upstream
condi-tions, we aim to trigger robust downstream procedures, increasing the overall time/space yield of IB-processes. Fig. 7 a Sugar-accumulation and cell death measured by FCM for three cultivations at different qs,Glu. Lowest qs,Glu shows no cell lysis and
accumulation; b specific titer of the recombinant protein fused to N-pro. Very high expression can be seen for the high qs,Glu until 6 h with
decreasing qs,Glu also decreases product titer; c size of the IB beads. qs,Glu = 0.41 g/g/h and qs,Glu= 0.39 g/g/h are very similar. A very steep increase
is followed by a steady state; qs,Glu= 0.30 g/g/h shows increase over time, while size for qs,Glu= 0.10 g/g/h is only detectable at 10 and 12 h of
Additional files
Additional file 1: Figure S1. Analysis of the first center point run repre-senting IB purity. Buffer washed samples showed generally higher purity. Differences in size and titer are within the given standard deviation. Additional file 2: Figure S2. a) Electropherogram for two different timepoints during a cultivation (4 h and 12 h). A clear visibility of impurity pattern near the protein of interest (high peak after 28 kDa) is given; b) SDS-Page for visualization of DNA related impurities. No distinct differen-tiation can be made between DNase treatment and virgin sample. Additional file 3: Figure S3. a) Mean value for size and deviations of the three individual center point runs. Error stays constant; b) purity-based analysis, with decreasing error over time; c) titer-based analysis. Error decreases drastically in later time stages (range of constant titer or even proteolytic degradation).
Additional file 4: Figure S4. qs,real with standard deviation based on the
reverse analysis. The higher the qs the higher is the error, due to onset of
degradation and sugar accumulation in the broth. A rising trend can be dedicated from these measurements.
Abbreviations
ACN: acetonitrile; AFM: atomic force microscopy; DCW: dry cell weight; dO2:
dissolved oxygen; DoE: design of experiments; DSP: downstream process-ing; FCM: flow cytometry; GFP: green fluorescent protein; IB: inclusion body; IPTG: isopropyl β-d-1 thiogalactopyranoside; IR: infrared; MQ: ultrapure water; QA: quality attribute; qs,Glu (g/g/h): specific substrate uptake rate (glucose); rp
(g/L/h): volumetric productivity; SEM: scanning electron microscopy; TCA : tri-carboxylic acid (cycle); TEM: transmission electron microscopy; USP: upstream processing; UV: ultraviolet.
Authors’ contributions
CS, SH, and CH designed the study. CS, JK, MS and DS conducted the experiments and analyzed the data at TU Wien. SH supervised the cultiva-tions at Sandoz GmbH for strain 2. EE conducted the SEM measurements. AS performed IR measurements and data analysis. CS, SH and CH drafted the manuscript. All authors read and approved the final manuscript.
Author details
1 Christian Doppler Laboratory for Mechanistic and Physiological
Meth-ods for Improved Bioprocesses, Institute of Chemical Engineering, Vienna University of Technology, Vienna, Austria. 2 Sandoz GmbH, Biochemiestrasse
10, 6250 Kundl, Tirol, Austria. 3 Institute of Chemical Technology and Analytics,
Getreidemarkt 9/164, 1060 Vienna, Austria. 4 Institute of Chemical,
Environ-mental and Bioscience Engineering, Research Area Biochemical Engineering, Vienna University of Technology, Gumpendorfer Strasse 1a, 1060 Vienna, Austria.
Acknowledgements
The authors acknowledge the TU Wien University Library for financial support through its Open Access Funding Program. The authors want to thank the coworkers at Novartis GmbH, especially Mareike Jakobs, who helped with the analysis of the conducted experiments and did proofreading of the manuscript.
Competing interests
The authors declare that they have no competing interests.
Availability of data and materials
The datasets used analyzed during the current study are available from the corresponding author on reasonable request. Additional given information is added as three additional figures in this manuscript.
Consent for publication
Not applicable.
Ethics approval and consent to participate
Not applicable.
Funding
The authors acknowledge the Christian Doppler society for funding of this project.
Publisher’s Note
Springer Nature remains neutral with regard to jurisdictional claims in pub-lished maps and institutional affiliations.
Received: 14 May 2018 Accepted: 14 September 2018
References
1. Gupta SK, Shukla P. Microbial platform technology for recombinant anti-body fragment production: a review. Crit Rev Microbiol. 2017;43:31–42. 2. Walsh G. Biopharmaceutical benchmarks 2010. Nat Biotechnol.
2010;28:917–24.
3. Wurm DJ, Veiter L, Ulonska S, Eggenreich B, Herwig C, Spadiut O. The E. coli pET expression system revisited-mechanistic correlation between glucose and lactose uptake. Appl Microbiol Biotechnol. 2016;100:8721–9. 4. Meuris L, Santens F, Elson G, Festjens N, Boone M, Dos Santos A, Devos
S, Rousseau F, Plets E, Houthuys E, et al. GlycoDelete engineering of mammalian cells simplifies N-glycosylation of recombinant proteins. Nat Biotechnol. 2014;32:485–9.
5. DeLisa MP, Li J, Rao G, Weigand WA, Bentley WE. Monitoring GFP-operon fusion protein expression during high cell density cultivation of Escherichia coli using an on-line optical sensor. Biotechnol Bioeng. 1999;65:54–64.
6. Berlec A, Strukelj B. Current state and recent advances in biopharma-ceutical production in Escherichia coli, yeasts and mammalian cells. J Ind Microbiol Biotechnol. 2013;40:257–74.
7. Baeshen MN, Al-Hejin AM, Bora RS, Ahmed MM, Ramadan HA, Saini KS, Baeshen NA, Redwan EM. Production of biopharmaceuticals in E. coli: current scenario and future perspectives. J Microbiol Biotechnol. 2015;25:953–62.
8. Spadiut O, Capone S, Krainer F, Glieder A, Herwig C. Microbials for the production of monoclonal antibodies and antibody fragments. Trends Biotechnol. 2014;32:54–60.
9. Studier FW, Moffatt BA. Use of bacteriophage T7 RNA polymerase to direct selective high-level expression of cloned genes. J Mol Biol. 1986;189:113–30.
10. Steen R, Dahlberg AE, Lade BN, Studier FW, Dunn JJ. T7 RNA polymer-ase directed expression of the Escherichia coli rrnB operon. EMBO J. 1986;5:1099–103.
11. Studier FW, Rosenberg AH, Dunn JJ, Dubendorff JW. Use of T7 RNA polymerase to direct expression of cloned genes. Methods Enzymol. 1990;185:60–89.
12. Dubendorff JW, Studier FW. Controlling basal expression in an inducible T7 expression system by blocking the target T7 promoter with lac repres-sor. J Mol Biol. 1991;219:45–59.
13. Neubauer P, Hofmann K. Efficient use of lactose for the lac promoter-controlled overexpression of the main antigenic protein of the foot and mouth disease virus in Escherichia coli under fed-batch fermentation conditions. FEMS Microbiol Rev. 1994;14:99–102.
14. Lyakhov DL, He B, Zhang X, Studier FW, Dunn JJ, McAllister WT. Paus-ing and termination by bacteriophage T7 RNA polymerase. J Mol Biol. 1998;280:201–13.
15. Jeong H, Barbe V, Lee CH, Vallenet D, Yu DS, Choi SH, Couloux A, Lee SW, Yoon SH, Cattolico L, et al. Genome sequences of Escherichia coli B strains REL606 and BL21 (DE3). J Mol Biol. 2009;394:644–52.
16. Jeong H, Kim HJ, Lee SJ. Complete genome sequence of Escherichia coli strain BL21. Genome Announc. 2015;3:e00134-15.
•fast, convenient online submission •
thorough peer review by experienced researchers in your field • rapid publication on acceptance
• support for research data, including large and complex data types •
gold Open Access which fosters wider collaboration and increased citations maximum visibility for your research: over 100M website views per year •
At BMC, research is always in progress.
Learn more biomedcentral.com/submissions
Ready to submit your research? Choose BMC and benefit from: 18. Marbach A, Bettenbrock K. lac operon induction in Escherichia coli:
systematic comparison of IPTG and TMG induction and influence of the transacetylase LacA. J Biotechnol. 2012;157:82–8.
19. Keiler KC. Biology of trans-translation. Annu Rev Microbiol. 2008;62:133–51.
20. Viitanen MI, Vasala A, Neubauer P, Alatossava T. Cheese whey-induced high-cell-density production of recombinant proteins in Escherichia coli. Microb Cell Fact. 2003;2:2.
21. García-Fruitós E, Vázquez E, Díez-Gil C, Corchero JL, Seras-Franzoso J, Ratera I, Veciana J, Villaverde A. Bacterial inclusion bodies: making gold from waste. Trends Biotechnol. 2012;30:65–70.
22. Palmer I, Wingfield PT. Preparation and extraction of insoluble (inclusion-body) proteins from Escherichia coli. Curr Protoc Protein Sci. 2012;70:6.3.1. 23. Ramón A, Señorale-Pose M, Marín M. Inclusion bodies: not that bad….
Front Microbiol. 2014;5:56.
24. Villaverde A, Corchero JL, Seras-Franzoso J, Garcia-Fruitós E. Functional protein aggregates: just the tip of the iceberg. Nanomedicine (Lond). 2015;10:2881–91.
25. Wingfield PT, Palmer I, Liang SM. Folding and purification of insoluble (inclusion body) proteins from Escherichia coli. Curr Protoc Protein Sci. 2014;78:6.5.1–5.30.
26. Wingfield PT. Preparation of soluble proteins from Escherichia coli. Curr Protoc Protein Sci. 2014;78:6.2.1–2.22.
27. Díez-Gil C, Krabbenborg S, García-Fruitós E, Vazquez E, Rodríguez-Carmona E, Ratera I, Ventosa N, Seras-Franzoso J, Cano-Garrido O, Ferrer-Miralles N, et al. The nanoscale properties of bacterial inclusion bodies and their effect on mammalian cell proliferation. Biomaterials. 2010;31:5805–12.
28. Peternel Š, Jevševar S, Bele M, Gaberc-Porekar V, Menart V. New properties of inclusion bodies with implications for biotechnology. Biotechnol Appl Biochem. 2008;49:239–46.
29. Peternel Š, Grdadolnik J, Gaberc-Porekar V, Komel R. Engineering inclusion bodies for non denaturing extraction of functional proteins. Microb Cell Fact. 2008;7:34.
30. Reichelt WN, Kaineder A, Brillmann M, Neutsch L, Taschauer A, Lohninger H, Herwig C. High throughput inclusion body sizing: Nano particle track-ing analysis. Biotechnol J. 2017;12:1600471.
31. Schwaighofer A, Montemurro M, Freitag S, Kristament C, Culzoni MJ, Lendl B. Beyond FT-IR spectroscopy: EC-QCL based mid-IR transmission spectroscopy of proteins in the amide I and amide II region. Anal Chem. 2018;90:7072–9.
32. Jevševar S, Gaberc-Porekar V, Fonda I, Podobnik B, Grdadolnik J, Menart V. Production of nonclassical inclusion bodies from which correctly folded protein can be extracted. Biotechnol Prog. 2005;21:632–9.
33. Wurm DJ, Quehenberger J, Mildner J, Eggenreich B, Slouka C, Schwaig-hofer A, Wieland K, Lendl B, Rajamanickam V, Herwig C, Spadiut O. Teaching an old pET new tricks: tuning of inclusion body formation and properties by a mixed feed system in E. coli. Appl Microbiol Biotechnol. 2017;102:667–76.
34. Reichelt WN, Brillmann M, Thurrold P, Keil P, Fricke J, Herwig C. Physiologi-cal capacities decline during induced bioprocesses leading to substrate accumulation. Biotechnol J. 2017;12:1600547.
35. Kischnick S, Weber B, Verdino P, Keller W, Sanders EA, Anspach FB, Fiebig H, Cromwell O, Suck R. Bacterial fermentation of recombinant major wasp
allergen Antigen 5 using oxygen limiting growth conditions improves yield and quality of inclusion bodies. Protein Expr Purif. 2006;47:621–8. 36. Langemann T, Mayr UB, Meitz A, Lubitz W, Herwig C: Multi-parameter
flow cytometry as a process analytical technology (PAT) approach for the assessment of bacterial ghost production. Appl Microbiol Biotechnol. 2016;100:409–18.
37. Castellanos-Mendoza A, Castro-Acosta RM, Olvera A, Zavala G, Mendoza-Vera M, García-Hernández E, Alagón A, Trujillo-Roldán MA, Valdez-Cruz NA. Influence of pH control in the formation of inclusion bodies during production of recombinant sphingomyelinase-D in Escherichia coli. Microb Cell Fact. 2014;13:137.
38. Kopp J, Slouka C, Ulonska S, Kager J, Fricke J, Spadiut O, Herwig C. Impact of glycerol as carbon source onto specific sugar and inducer uptake rates and inclusion body productivity in E. coli BL21 (DE3). Bioengineering (Basel). 2017;5:1.
39. Achmüller C, Kaar W, Ahrer K, Wechner P, Hahn R, Werther F, Schmidinger H, Cserjan-Puschmann M, Clementschitsch F, Striedner G, et al. N(pro) fusion technology to produce proteins with authentic N termini in E. coli. Nat Methods. 2007;4:1037–43.
40. Dvorak P, Chrast L, Nikel PI, Fedr R, Soucek K, Sedlackova M, Chaloupkova R, de Lorenzo V, Prokop Z, Damborsky J. Exacerbation of substrate toxicity by IPTG in Escherichia coli BL21 (DE3) carrying a synthetic metabolic pathway. Microb Cell Fact. 2015;14:201.
41. Rinas U, Boone TC, Bailey JE. Characterization of inclusion bodies in recombinant Escherichia coli producing high levels of porcine somatotro-pin. J Biotechnol. 1993;28:313–20.
42. Rinas U, Bailey JE. Protein compositional analysis of inclusion bodies produced in recombinant Escherichia coli. Appl Microbiol Biotechnol. 1992;37:609–14.
43. García-Fruitós E, Rodríguez-Carmona E, Díez-Gil C, Ferraz RM, Vázquez E, Corchero JL, Cano-Sarabia M, Ratera I, Ventosa N, Veciana J. Surface cell growth engineering assisted by a novel bacterial nanomaterial. Adv Mater. 2009;21:4249–53.
44. Rodríguez-Carmona E, Cano-Garrido O, Seras-Franzoso J, Villaverde A, García-Fruitós E. Isolation of cell-free bacterial inclusion bodies. Microb Cell Fact. 2010;9:1.
45. Valax P, Georgiou G. Molecular characterization of β-lactamase inclusion bodies produced in Escherichia coli. 1. Composition. Biotechnol Prog. 1993;9:539–47.
46. Molloy MP, Herbert BR, Slade MB, Rabilloud T, Nouwens AS, Williams KL, Gooley AA. Proteomic analysis of the Escherichia coli outer membrane. FEBS J. 2000;267:2871–81.
47. Stancik LM, Stancik DM, Schmidt B, Barnhart DM, Yoncheva YN, Slonc-zewski JL. pH-dependent expression of periplasmic proteins and amino acid catabolism in Escherichia coli. J Bacteriol. 2002;184:4246–58. 48. Padan E, Zilberstein D, Schuldiner S. pH homesstasis in bacteria. Biochim
Biophys Acta (BBA) Rev Biomembr. 1981;650:151–66.
49. Barth A. Infrared spectroscopy of proteins. Biochim Biophys Acta (BBA) Bioenerg. 2007;1767:1073–101.