Open Access
Research
Physiologically-based testing system for the mechanical
characterization of prosthetic vein valves
Stanley E Rittgers*, Matt T Oberdier and Sharath Pottala
Address: Department of Biomedical Engineering, The University of Akron, Akron, OH 44325, USA
Email: Stanley E Rittgers* - [email protected]; Matt T Oberdier - [email protected]; Sharath Pottala - [email protected] * Corresponding author
Abstract
Due to the relatively limited amount of work done to date on developing prosthetic vein (as opposed to cardiac) valves, advances in this topic require progress in three distinct areas: 1) improved device design, 2) relevant device testing conditions, and, 3) appropriate parameters for evaluation of results. It is the purpose of this paper to address two of these issues (#2 and #3) by: 1) performing a study of normal volunteers to quantify the anatomy and hemodynamic features of healthy venous valves, 2) construction of a 2-step, in vitro testing procedure, which simulates both physiologic and postural conditions seen in the lower extremity venous system, and, 3) defining several modified and new parameters which quantify dynamic valve characteristics.
Background
Although over 50 designs for prosthetic cardiac valves have been put forward over the past 40+ years and exten-sive testing performed on many of these devices resulting in millions of valves being implanted in patients [1], only a handful of concepts have been put forward for a pros-thetic venous valve [2-7] and only 1 or two devices have reached clinical trials as yet [8]. Simultaneously, it is esti-mated that between 6–7 million patients suffer from chronic venous insufficiency [CVI] of the legs with approximately 900,000 new patients be diagnosed annu-ally in the United States [9]. Of these, about 1–2% will develop venous stasis ulcers of the lower extremities with many of them potentially benefiting from a satisfactory venous implant.
Thus, there remains a large, unmet demand for a function-ing prosthetic vein valve, particularly one designed for implant into the proximal veins. The overall objectives of this study, then, were to create a prosthetic vein valve
capable of successful clinical implantation which would: 1) provide minimal resistance to antegrade flow, 2) re-establish prevention of reflux flow, and, 3) remain patent for a minimum time period. To accomplish this, several novel designs of a valve frame and leaflet component were conceived which then required evaluation under relevant venous conditions. Thus, in vitro testing systems were developed to provide physiologic conditions under typi-cal postural positions appropriate for a valve in the com-mon femoral vein (CFV) position. Measurements were made of standard dynamic variables and both traditional and novel parameters were also derived from these data.
Previous related work was done by Hasaniya who used a rudimentary system to evaluate a vein valve constructed out of bovine jugular vein [7]. His approach was to simply place the construct vertically into a closed dynamic flow system such that the leaflet operation could be observed under ultrasound imaging. The valve system was
"evalu-Published: 13 July 2007
BioMedical Engineering OnLine 2007, 6:29 doi:10.1186/1475-925X-6-29
Received: 8 March 2007 Accepted: 13 July 2007 This article is available from: http://www.biomedical-engineering-online.com/content/6/1/29
© 2007 Rittgers et al; licensee BioMed Central Ltd.
ated continuously at various pressures", including 200– 260 mmHg.
One of the more detailed systems was described by Qui et al. [10] who evaluated the fluid dynamics of two venous valve models made from bovine jugular vein valves. The system had the ability to control the steady forward flow through a horizontally mounted, 25 mm ID valve test sec-tion by adjusting the height of a downstream reservoir (up to 20 cm) relative to that of an upstream reservoir (fixed at 30 cm). Oscillatory effects were introduced by a third tank placed downstream and mounted on a rotary wheel such that it induced an additional backpressure from 0 to 13.5 cm H2O. This feature was designed to simulate respi-ratory and/or muscle pump actions. Flow was measured using an EMF, pressure was monitored at a single point immediately downstream of the valve and a glycerin in water blood analog fluid was used. Valve opening area was measured using the electric current generated by a photo detector that sensed the amount of light intensity from a He-Ne laser beam expanded to 15 mm diameter that was able to pass through the valve along its axis. Axial velocities upstream of the valve, at the valve exit, and 2 cm downstream of the valve exit were measured with a 4 W Argon-ion laser Doppler anemometer. This system was used to test a stented, formaldehyde treated bovine jugu-lar vein valve and a stentless bovine jugujugu-lar vein valve conduit. Their results confirmed the theory that vein valves are operated by a pressure differential rather than flow and that no reflux is needed to completely close the valve. Additionally, it was shown that the vein valve sinus expands rapidly upon backpressure, which was deemed to be a critical characteristic to consider when designing prosthetic venous valves.
A number of other studies have been performed where compliant tubing was used to contain the valve [11-14]. In particular, Raju et al. [15,16] showed that a collapsible tube helps to buffer pressure variations in the vein and, upon closure of the valve, the tube below the valve col-lapses, producing venous pressure reduction. More recently, Buescher et al. [17] tested thin-walled latex and polyurethane film vein valves placed in a 12.7 mm latex tube which was mounted vertically and exposed to flow moving in either the antegrade or retrograde directions (depending upon input/output connections) between an arterial and a venous reservoir. A fluid medium (either 0.9% saline or 42 wt% glycerin solution) was gradually drained from the arterial reservoir into the venous reser-voir over a height variation that produced flow rates from 0 to 15 ml/s. Measurements were made of the mass flow rate, various pressures including the differential pressure across the valve, and cross-sectional images from an arthroscopic camera. The primary output variable ana-lyzed was the competency, C, which was defined as the
percent ratio of the antegrade minus the retrograde flow rate divided by the antegrade flow rate to evaluate the effects of leaflet gap widths and sinus sizes.
Methods
A study was first performed on normal volunteers to quantify the anatomy and dynamics of healthy venous valves (The University of Akron Institutional Review Board, Application #20040140). A total of eleven superfi-cial (SFV) and common femoral veins (CFV) in eight indi-viduals were non-invasively examined using a Duplex ultrasound scanner (Siemens Medical System Incorpo-rated, Ultrasound Group, Issaquah, WA). Because venous dynamics are a function of both hydrostatic and transmu-ral pressures, measurements were taken under a combina-tion of postural posicombina-tions and physiologic condicombina-tions. For example, venous pressures significantly increase by: 1) elevating from a supine to a standing position, 2) induc-ing gait via the activation of the skeletal muscle pump, and, 3) breathing through changes in intrathoracic pres-sure. Thus, measurements were taken under various pos-tural and dynamic conditions, including supine breathing, supine ankle flexion, standing breathing, and standing ankle flexion. Measurements were also taken during a Valsalva maneuver, which is defined as an attempt to forcibly exhale while keeping the glottis closed. This is an extreme condition in which the thoracic vena cava collapses leading to the application of a high retro-grade pressure to the most proximal venous valves. Parameters obtained using B-mode imaging included CFV diameter, presence or absence of valve sinuses, SFV diam-eter, leaflet length, and SFV leaflet to wall angle. Peak SFV augmentation velocity and cycle period were obtained from the single channel pulse Doppler mode. Other parameters were derived from the raw data and included: leaflet to SFV diameter ratio, SFV area, SFV flow rate, SFV peak Reynolds number, and SFV Womersley number. Although these data are too extensive to report here, the average values were used as a guide for designing an in vitro flow test system and the first generation of proto-typic, prosthetic valves.
testing. Thus, two test systems were built, one of which provided first-cut information about the valve's respon-siveness to basic flow conditions (forward steady flow and step reverse flow) and the second of which provided more realistic physiologic conditions. Because of the rough, observational nature of the first testing protocol, the devices and test system were scaled up by a factor of 2:1 in order to better observe device operation. Those devices which passed this vertical column Mock-up Steady Flow System testing were then re-fabricated as 1:1 scale devices and more thoroughly evaluated in the horizontal Physio-logic Flow System.
a. 2:1 Mock-Up System
The main purpose of the 2:1 Mock-Up System was to mimic conditions in the standing position where demands on the valve were most extreme. Therefore, a vertical column was constructed in which the candidate devices were placed (Fig. 1). The outlet of the column was at a height of 55 cm above the test specimen to simulate the elevation of the heart above a proximal vein valve in the standing position. For simplicity, a constant flow pump (IWAKI PULSA Feeder, Interpace Corporation, Rochester, NY) was used to provide the driving pressure and tap water was used as the test fluid. Initially, valve misalignment within the test section and system leakage at the valve connection were commonly experienced. Both of these conditions were corrected through the use of a threaded adaptor to secure the valve Mock-ups in place. Matching threading was added to each of the prototype valves, which could then be screwed into the system after the application of Teflon® tape. The flow loop was closed
by lowering a one-inch inner diameter Tygon® tube over
the valve and securing it with a clamp. Upstream of the test section was a reservoir with a submersible pump (Model 1, Little Giant Pump Company, Oklahoma City, OK) that filled a constant elevation (20 cm) reservoir (Tower I) that, in turn, functioned to prime the constant flow pump. The output of the constant flow pump to the test section was regulated by a variable resistor placed in a recycle stream to the reservoir. This allowed the flow rate delivered to the test section to be set without altering the pump output.
Upon scaling up to the 2:1 Mock-up system, a balance of viscous and inertial forces was maintained by matching the Reynolds numbers of the system to that obtained in the Normal Volunteer Study:
where Re = characteristic Reynolds number, ρ= the fluid density, v = the fluid velocity, D = the tubing diameter,
and, μ= the fluid viscosity; NL subscripts denote parame-ters of the normal volunteer study while MU denotes those of the Mock-up flow system.
The densities of both systems were assumed to be equal (ρNL = ρMU) while the diameter of the Mock-up system was twice that of the average normal volunteer vessel diameter (DMU = 2.0DNL). Furthermore, the viscosity of blood was three and a half times greater than the tap water in the Mock-up system (μNL = 3.5 μMU). These relationships allowed for the velocity of the Mock-up system to be determined relative to that of the normal volunteer study:
Next, the value of VMU was applied to the continuity equa-tion as seen in Equaequa-tion 3:
where QMU = the volumetric flow rate in the Mock-up test system (L/min) and AMU = the cross-sectional area of the test section in the Mock-up system (cm2). This required
that for VNL = 14.2 cm/s and DNL = 1.25 cm that QMU = 0.599 L/min (corresponding to a mean Re = 146).
Testing of a given valve consisted of recording differential pressure and flow while adjusting the variable resistor in the recycle stream to obtain the desired flow to the test section. After the flow rate to the test section stabilized at the desired value for a few seconds, the pump was turned off and the flow allowed to recede under the force of grav-ity. The pump remained off until the level of the water reached an equilibrium point with the height of the fluid in Tower I. This protocol was repeated five times for each valve. Data recordings consisted of analog differential pressure and flow waveforms. Differential pressure was measured with a transducer (Model P305D, Validyne Engineering Corporation, Northridge, CA) whose ports were connected to the test section at a distance of 27 cm above and below the test valve to allow for placement of the device inside a view box. The transducer itself was set at a height of 23 cm above the reference tubing to match the elevation of the device. Flow was measured with a 16 mm inner diameter transonic flow probe connected to the system just proximal to the recycle stream. The signal was processed by a transonic flow meter (Model T108, Tran-sonic Systems, Ithaca, NY). UltraTran-sonic reflectors for the flow transducer were not needed because of the mineral particles in the tap water. Both differential pressure and flow waveforms were relayed to a PC interface system
(WINDAQ™, DATAQ® Instruments Incorporated, Akron,
Re= ρ =
μ
ρ μ NL NL NL
NL
MU MU MU
MU
v D v D
(1)
V D
D V
V
MU MU NL
NL MU
NL NL
= μ =
μ 7 0. (2)
QMU =VMUAMU = VNL ⎛ DNL VNLD
⎝⎜
⎞
⎠⎟ = ⋅
7 0 2 0
2 0 449
2
. .
.
π NL 2
OH) for recording and display. The waveforms for the Mock-up flow system were converted from a voltage sig-nal to either their corresponding average differential pres-sure or flow values via linear calibration curves based on known data points. Through the acquisition system, data were obtained to the nearest 0.001 V with a temporal res-olution of 1 ms at a sampling rate of 1000 Hz. Using the calibration equations, this corresponded to a resolution of 0.0345 mm Hg and 0.00264 L/min for differential pres-sure and flow rate, respectively.
Measured parameters for the 2:1 Mock-up system included mean flow rate, average differential pressure, valve closing time, reflux, and leakage. Each variable was defined by isolating a specific region in the time domain based on characteristic features of the differential pressure and flow waveforms. Mean flow rate and average differen-tial pressure were time averaged over the period of one second before the constant flow pump was turned off. This provided the dynamic conditions that were acting on the valve as valve closure occurred. The time marker for the pump shut-off was defined as an initial sharp decrease in the flow waveform. The pump shut-off time was also used as the start marker for both the valve closing time and reflux parameters whereas the end marker was defined using the first rebound spike of the differential
pressure waveform. Physically, the Valve Closing Time,
VCT, was the time it took for the valve leaflets to first approximate one another after cessation of the forward driving pressure source. Correspondingly, Reflux Volume, , was defined as the volume of fluid that passed retro-grade through the valve during the closing time period. The time interval over one second following the end marker was defined as the "1st Leakage Interval" where the
volume of fluid that leaked distally through the valve was the leakage. The same thing was done over the next sec-ond, which was the "2nd Leakage Interval".
The only calculated parameter associated with the 2:1
Mock-up system was valve resistance, R, which was
defined as the ratio of the average differential pressure to the mean flow rate. This value quantitatively described how much of a frictional effect the valve had on antegrade flow.
b. 1:1 Physiologic Flow System
The 1:1 Physiologic Flow System (Fig. 2) was intended to mimic the more complex conditions observed in the nor-mal volunteer study. It combined steady and pulsatile flow components where steady flow was provided by a constant elevation (20 cm) reservoir (Tower I) and pulsa-tile flow was provided by a roller pump (Drake-Willock, Hemodialysis Systems, Oregon), which had been
modi-VR
A schematic of the vertical column 2:1 Mock-Up System Figure 1
fied by the removal of one of the two rollers acting upon a compliant tube (bicycle inner tube). Cyclic flow output of the roller pump was superimposed onto the steady component by placing it in series with the output of Tower I and operating it at frequencies of 15 and 30 rpms to simulate ankle flexion and breathing conditions, respectively. A second constant elevation (55 cm) reser-voir (Tower II) was also placed downstream of the valve. The purpose of Tower I was to simulate the residual arte-rial pressure entering the venous system while the purpose of Tower II was to simulate the hydrostatic backpressure induced in the standing position. The test section again contained a threaded adaptor similar to that of the Mock-up flow system, which facilitated valve installation and alignment while simultaneously preventing system leak-age. The system was filled with a blood analog fluid com-posed of a mixture of tap water and 3.45% Dextran (SIGMA Chemical Company, St. Louis, MO). As with the 2:1 Mock-up system, data recordings consisted of analog differential pressure and flow waveforms with the only difference being that differential pressure was measured across ports separated by 31 cm on either side of the test valve, again to allow for mounting within a view box.
Testing of a given valve was performed by recording differ-ential pressure and flow over each combination of body position (Supine or Standing) and dynamic condition (Breathing or Ankle Flexion) over forty cycles (Table 1). Procedurally, this was done by adjusting the steady flow rate to 0.35 L/min (Re = 170) using the variable resistance valve proximal to the test section while the pulsatile pump was off and the valve to Tower II closed. With the roller pump set at 15 rpm, the supine breathing (SUBR) simula-tion was created. After the first forty cycles, the standing breathing (STBR) condition was produced by opening the valve to Tower II. Halfway through the testing protocol, the roller pump was shut off, the steady flow rate set to 0.75 L/min (Re = 364), the roller pump reset to 30 rpm, and the valve to Tower II closed resulting in the supine ankle flexion (SUAF) simulation. Finally, after the 120th
cycle, standing ankle flexion (STAF) was created by open-ing the valve to Tower II. This protocol was repeated for each valve. Again, the waveforms for the physiological flow system were converted from voltage signals to either their corresponding average differential pressure or flow values via linear calibration curves with resolutions simi-lar to those of the 2:1 Mock-up system.
Measured parameters obtained in the supine position included cycle period, mean flow rate, and average differ-ential pressure. Valve closed time, reflux volume, and for-ward volume were the measured parameters for the simulated standing position. Again, each variable was defined by isolating a specific region in the time domain
based on characteristic features of the differential pressure and flow waveforms. Extracting direct parameters of inter-est from the supine position data consisted of isolating a single flow cycle and running the statistics function of the data processing software. Doing so provided cycle period, mean flow rate, average differential pressure, and root mean square flow rate. Obtaining measured parameters from the standing position data was somewhat more complex in that it required dividing the flow waveform into two distinct temporal regions per cycle. The first region was the period in which flow was negative and was referred to as the "Valve Closed Time." The volume change during this period was considered the Reflux Vol-ume, , while the volume change during the remainder of the cycle in which flow was positive was considered the
Antegrade Volume, .
In the supine position, valve closure did not occur for either physiologic condition because the flow never reversed. Thus, the calculated parameters for this position evaluated the valve's influence on forward flow through the computation of Resistance, R, and Effective Orifice Area, EOA. Resistance was defined the same way as with the Mock-up flow system – the ratio of average differential pressure to mean flow rate and is only appropriate for describing steady flow systems. On the other hand, EOA
(cm2) is a measure of the valve's orifice area based on a
modified Venturi contraction and is a standard quantita-tive descriptor used for cardiac valves. It takes into account all of the losses associated with the valve under pulsatile flow conditions and is defined as:
where Qrms = the RMS flow rate in cm3/s, C
d = the
experi-mentally determined constant in and,
= the average difference between systolic and diastolic pressures in mmHg.
While there is extensive experience in applying EOA to cardiac valve testing, it was felt that using the RMS flow rate and systolic and diastolic pressures was not appropri-ate for the venous system, particularly since more direct input measures were available. Thus, mean flow rate and differential pressure were used along with an empirical constant that was determined by measuring flow and dif-ferential pressure in the open tube (i.e. with 'No Device' in place), which corresponded to a known orifice area. Thus, the constant, Cd, was solved for using Equation 4 for both the supine breathing and ankle flexion simulations.
VR
VA
EOA Q
C P
rms
d =
Δ (4)
cm mmHg⋅ ⋅s−
1
2 1
Since valve closure and reflux only occurred in the simu-lated standing positions, all calcusimu-lated parameters
regard-ing reflux were obtained only for STBR and STAF
conditions. The first of these was the Percent Reflux,
%Ref, which was defined as the ratio of reflux volume to forward volume during one cycle so that it would be inde-pendent of small, yet distinct, deviations in the antegrade volume. The energy required to re-pump the reflux fluid through the valve, the Reflux Energy Loss, REL (J), was defined as:
where F = force (N), d = distance (m), ρ= water density (kg/m3), = Reflux volume (m3), g = the gravitational
constant (m/s2), and, A = the cross sectional area of the
test section (m2).
Another term, the Antegrade Energy, AE, was defined sim-ilar to REL, where AE (J) quantified the energy produced by the pump in propelling the fluid proximally:
where = the Antegrade volume (m3).
REL
Fd
V g
V
A
g
A
V
R R
=
=
(
)
⎛
⎝⎜
⎞
⎠⎟
=
ρ
ρ
R 2 (5)VR
AE
g
A
V
=
ρ
A 2 (6)VA
A schematic of the horizontal 1:1 Pulsatile Flow System Figure 2
Finally, the REL was compared to the AE to provide the Energy Retention, η:
Statistical analysis for the Mock-up data consisted of a one-way analysis of variance (ANOVA) at a significance level of 0.05 performed on mean flow rate, which was the controlled variable, and a linear regression was performed between Valve Closure Time and Reflux. For the physio-logic data, a series of one-way ANOVA tests were run at a significance level of 0.05 on the variables that were most relevant to valve selection. These parameters included average ΔP, R, EOA, , %Ref, REL, and η. The analysis was performed for both dynamic conditions in which the respective parameter was measured. When a significant difference existed, grouping was provided by the SNK pro-cedure and was performed by a computer program (SAS, SAS Institute Incorporated, Cary, NC). To determine the repeatability of the system, one prototype valve was tested, removed and then re-inserted into the system for repeat testing. Those results were then evaluated to test for any statistical differences.
Results
Results of the normal volunteer study were extremely val-uable in defining both typical dimensions and anatomy of veins in the proximal lower extremity, but also in quan-tifying the velocities, flow rates, and cycle periods under various postural and physiologic conditions. Specifically, over the 11 subjects, the common femoral vein diameter was 1.04 ± 0.14 cm and peak flow rates (derived from peak velocities) were 0.6 L/min, 1.34 L/min, 0.78 L/min and 1.6 L/min for the cases SUBR, SUAF, STBR and STAF, respectively. Based on these data, a diameter of 1.25 cm was chosen for the prosthetic valve design to allow for some distention of the vein upon insertion. Representa-tive values for peak flow rate under breathing and ankle flexion conditions were taken (0.69 L/min and 1.5 L/min, respectively) as the average values measured in the two postural positions (Supine and Standing), since the breathing and ankle flexion movements acted as the pri-mary driving forces in each case. These peak values were
then obtained in the 1:1 Pulsatile Flow System by setting the steady flow component to 50% of those values (0.35 L/min and 0.75 L/min, respectively) and allowing the roller pump to superimpose an additional unsteady com-ponent. Pumping frequencies were based upon typical breathing (~15 breaths/min = 15 rpm, or 0.25 Hz) and walking (~30 steps/limb/min = 30 rpm, or 0.5 Hz) cycles.
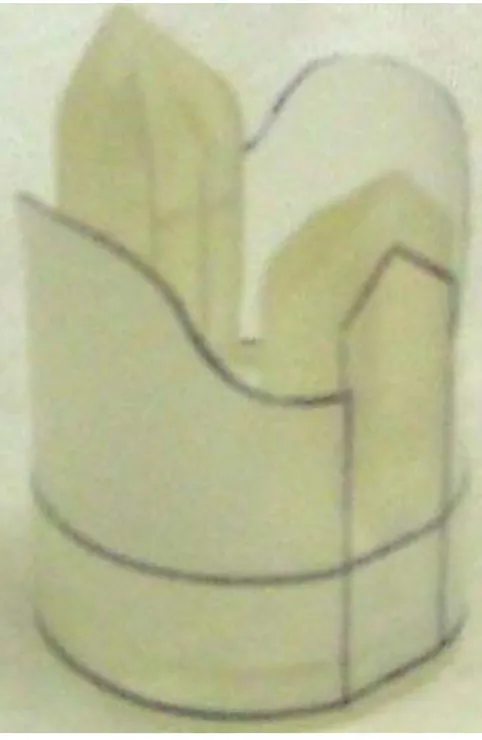
To illustrate the overall testing procedure, a preliminary vein valve design was developed (Fig. 3). This device has several novel features [18] and was conceived in order to allow for a normally open device that fully closes upon application of backpressure. A 2:1 scale device was built using SLA fabrication techniques and incorporating the threaded extension as described earlier. The device frame was then wrapped with a 5 mil (127 μm) thick sheet of Biospan® (Polymer Technology Group, Berkeley, CA) to
serve as leaflets. These were cut to a shape such that the closed leaflet edges contacted along a straight line across the valve lumen.
a. 2:1 Mock-Up System
The prototype device was then installed in the 2:1 Mock-up system and evaluated as described earlier. Initial obser-vations showed that the leaflet had a natural tendency to fold inwardly along a nearly diagonal line between the tip of the flange and a point halfway between the two flanges along the base. Additional observations also showed that, for the leaflets to close quickly and reliably, they needed to have some initial inward deflection. These two issues were resolved by modifications to the side of the frames and means of attachment of the leaflet to the base. A threaded extension was also added at this point to improve axial alignment of the device and to reduce leak-age around connectors (Fig. 4).
A set of these devices was fabricated and a series of tests were then made on these designs in the 2:1 Mock-up Sys-tem. Key results for the prototype device were that it had a forward steady flow pressure drop of 1.25 ± 0.153 mmHg and a resistance of 1.92 ± 0.578 mmHg*min/L. Under sudden hydrostatic backpressure conditions, the valve required 1.38 ± 0.0447 s to close and allowed 19.9 ± 4.40 cm3 of reflux followed by 4.36 ± 1.48 cm3 and 1.23
± 1.02 cm3 of leakage during the 1st and 2nd one second
post-closure intervals, respectively. η = −1 REL
AE (7)
VR
Table 1: 1:1 Pulsatile Flow System Testing Protocol.
Test Condition Steady Flow rate (L/min) Pulse Frequency (rpm) Hydrostatic Backpressure
SUBR 0.35 15 OFF
SUAF 0.75 30 OFF
STBR 0.35 15 ON
b. 1:1 Physiologic Flow System
After completion of tests on a series of such devices, 1:1 prototypes were similarly constructed and evaluated in the pulsatile flow system to see what differences dimen-sional scale and test conditions would make. Results of these tests are shown for the 'No Device' case and one valve prototype under supine and standing conditions in Tables 2 and 3, respectively. The purpose of the 'No Device' case was: 1) to quantify losses in the system (i.e. tubing, connectors, etc.) which were not related to the test device itself, and, 2) to serve as a baseline for worst case values that would be seen with a completely incompetent valve. [Note: For the EOA calculations, values for Cd under
the 'No Device' case were 2.32 ± 0.03
and 6.38 ± 0.142 for the SUBR and
SUAF conditions, respectively.] Finally, the results from repeatability testing of these variables over two runs on the same prototype valve design under supine and stand-ing conditions are shown in Tables 4 and 5, respectively.
Discussion
a) 2:1 Mock-Up System
From a procedural standpoint, the Mock-up flow system proved to be an essential element in the development of second-generation optimized valve designs. The 2:1 scale and the steady flow component allowed for detailed
observations to be made over the course of an extended time period, which would have been much more difficult to make on the 1:1 Physiologic Flow System alone. Simi-larly, the vertical column arrangement provided the abil-ity to study the valve when it was subjected to the most extreme clinical condition. The Mock-up system was par-ticularly valuable in providing information about frame-leaflet interactions and how the frame-leaflet collapsed under a uniform reversing pressure. These capabilities led to observations that initiated the incorporation of features that were essential to the dynamic performance of the leaflets. Thus, it was concluded that the Mock-up was a necessary intermediate step in the design and develop-ment of the optimally designed valves.
Although dynamic similarity was maintained, the data obtained from the Mock-up flow system were not used to select the best performing second-generation optimized design. However, these results were able to indicate that the test device did have low forward resistance and reason-ably low reflux. [Note: It was at this point in the design process that consideration was given to: 1) devise out-come parameters which were more specific to vein valve operation, and, 2) include recordings of tests with 'No Device' installed so that direct comparisons could be made of the prototype as a measure of relative effective-ness versus a totally incompetent valve.]
b) 1:1 Physiologic Flow System
The 1:1 Physiologic Flow System was valuable in simulat-ing four realistic postural and physiologic conditions
cm mmHg⋅ ⋅s−
1
2 1
cm mmHg⋅ ⋅s−
1
2 1
Prototype design of venous valve in the Open (left) and Closed (right) positions consisting of a solid circular base, frame struts with uniquely shaped flanges, and a flexible leaflet material
Figure 3
Prototype design of venous valve in the Open (left) and Closed (right) positions consisting of a solid circular base, frame struts with uniquely shaped flanges, and a flexible leaflet material.
Base
Frame Strut
Flange
Commissure
(SUBR, SUAF, STBR, and STAF) for vein valve testing, which provided data to evaluate the second-generation, optimally designed valves. The physiologic system was relevant to the dynamic conditions of the veins in the leg,
which were necessary for a full evaluation of the different valves of the second generation, optimized design.
More specifically, by reducing the prosthetic devices to life-size (i.e. 1:1 scale) models, it was possible to obtain more realistic results and to confirm whether the devices would operate as well under physiologic conditions. However, this scale reduction also magnified some of the limitations in function of the device such as increased flow resistance and greater reflux due to decreased ability of the leaflet material to conform to the strut shapes. The smaller size also reduced precision of the fabrication proc-ess and, therefore, increased the relative impact of any incurred defects. Furthermore, by testing in a pulsatile flow system, it was possible to evaluate the effects of larger inertial forces and cyclical flexion on the device. This was important because opening and closing of the valve is strongly dependent upon the peak dynamic forces of the fluid and because of possible deformation or failure responses of the device after repeated operation. It was observed that the shorter durations of the opening and closing phases produced by the oscillatory flow condi-tions resulted in some designs not being able to close quickly enough and that the leaflets tended to achieve a more repeatable mode of operation after several cycles.
Unfortunately, there are virtually no comparable data from other prosthetic vein valves and it is unrealistic to compare these values to those of prosthetic cardiac valves due to large differences in test conditions – i.e. higher operating pressures (~2×), flow rates (~10×) and shorter, more abrupt cycles. As mentioned earlier, however, sev-eral outcome parameters were either modified or devised during this procedure in order to better quantify certain important device characteristics. For example, EOA was included because of its widespread use in evaluating car-diac valves. However, the standard definition of EOA is based on input data readily available to clinicians, i.e. systolic and diastolic pressures and root-mean-square flow, rather than more direct measures of pressure differ-ence and flow rate per se. Furthermore, while the reflux volume is important, the question arose as to "how much reflux is too much?" Since it was difficult to estimate the amount of excess volume that the lower limb could
toler-Actual 2:1 scale device with optimized frame and shaped Biospan® leaflet
Figure 4
Actual 2:1 scale device with optimized frame and shaped Biospan® leaflet. A threaded extension from the base (not
shown) screwed into the test section fixture to improve alignment and prevent leakage.
Table 2: 1:1 Pulsatile Flow Results for Prototype vs. 'No Device' in Supine Position.
Test Condition Device ΔP (mmHg) R (mmHg*min/L) EOA (cm2)
SUBR None 13.3 ± 0.0272 21.3 ± 0.271 1.23*
Prototype 14.6 ± 0.0012 23.5 ± 0.0338 1.12 ± 0.0166
Change 1.33 2.23 0.11
SUAF None 7.97 ± 0.0935 6.00 ± 0.163 1.23*
Prototype 8.81 ± 0.157 7.37 ± 0.110 1.09 ± 0.0111
Change 1.84 1.37 0.14
ate over a given period of time, an alternate approach to this issue was taken by simply looking at the energy 'cost' of re-pumping the reflux flow. This, then, led to the Reflux Energy Loss (REL) parameter, which measured the work needed to lift the reflux volume of fluid against gravity the equivalent height of one point just distal to one point just proximal to the valve. Finally, collection of data with 'No Device' installed proved very useful for making compari-sons of a given device (regardless of its overall ranking) against the worst possible case to determine the improve-ment it provided versus a totally defective valve (i.e. the clinical equivalent of CVI). These measurements also helped to establish the full-scale range of a given parame-ter.
Ultimately, the pulsatile flow system provided all of the data used for valve selection. In particular, the SUBR and
SUAF conditions allowed for the evaluation of valves in terms of R and EOA while the STBR and STAF simulations characterized valves according to , %Ref, REL, and η. Both supine simulations were found to produce fairly realistic conditions but neither induced valve closure. This was consistent with observations made earlier during the normal volunteer study and focused the value of these tests on resistance-based, rather than reflux-based, param-eters. The results obtained under the SUBR condition were considered particularly relevant since this case had a longer cycle period (4 s versus 2 s) and, thus, was more 'quasi-steady'. Reflux, on the other hand, was observed with both standing positions. However, the STAF simula-tion did not allow as much reflux as the STBR condition because of the higher frequency of the roller pump, which
acted as an effective valve and, thus, limited reflux. For example, in the 'No Device' case, only 24.6% reflux was observed under the STAF condition as compared to 205% reflux in the STBR condition. Therefore, it was concluded that test valves would not be exposed to reversing flows under the STAF condition, which are large enough to dis-tinguish between valve designs. The finding that %Ref
exceeded 100% and ηexceeded -300% for STBR under-scores the fact that back flow in the veins is not primarily dependent upon the amount of forward flow per se but rather, upon the backpressure acting on the valve. In other words, a successful vein valve should first be able to pre-vent backflow of blood from the entire proximal vein and then, secondly, it should limit backflow beyond the point where the net forward flow is less than that required to maintain normal flow through the vessel.
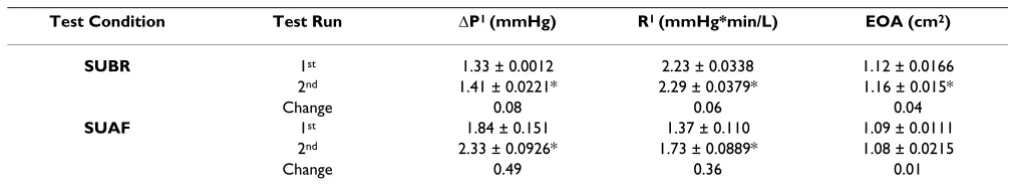
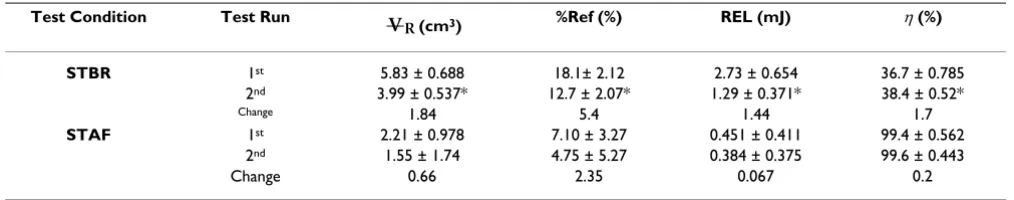
Repeatability testing showed that, for a representative device, there were some statistically different values in the measured and computed variables between runs. These differences existed for all parameters under simulated 'breathing' conditions (i.e. SUBR and STBR) but only 2 of 7 parameters (ΔP and R) under simulated 'ankle flexion' conditions (i.e. SUAF and STAF). While these differences will limit the test system's ability to distinguish one valve design from another to some extent, most of the variabil-ity is relatively small compared to the 'No Device' case [Tables 2 and 3], and thus, should accurately reflect the improvement expected compared to a completely defec-tive valve.
VR
Table 4: 1:1 Pulsatile Flow Results for Repeat Measurements in Supine Position.
Test Condition Test Run ΔP1 (mmHg) R1 (mmHg*min/L) EOA (cm2)
SUBR 1st 1.33 ± 0.0012 2.23 ± 0.0338 1.12 ± 0.0166
2nd 1.41 ± 0.0221* 2.29 ± 0.0379* 1.16 ± 0.015*
Change 0.08 0.06 0.04
SUAF 1st 1.84 ± 0.151 1.37 ± 0.110 1.09 ± 0.0111
2nd 2.33 ± 0.0926* 1.73 ± 0.0889* 1.08 ± 0.0215
Change 0.49 0.36 0.01
1 Relative to 'No Device' value
* p < 0.05 vs. 1st Test Run
Table 3: 1:1 Pulsatile Flow Results for Prototype vs. 'No Device' in Standing Position.
Test Condition Device
(cm3) %Ref (%) REL (mJ) η (%)
STBR None 59.6 ± 0.830 205 ± 5.37 283 ± 7.93 -319 ± 22.1 Prototype 5.83 ± 0.688 18.1 ± 2.12 2.73 ± 0.654 36.7 ± 0.785
STAF None 7.35 ± 0.28 24.6 ± 0.859 4.30 ± 0.333 93.9 ± 0.429 Prototype 2.21 ± 0.978 7.10 ± 3.27 0.451 ± 0.411 99.4 ± 0.562
Finally, it is important to note that neither of these in vitro
test systems used collapsible tubing in the test section as some earlier studies had done (15–17). While this feature would clearly have altered the results obtained, and espe-cially the reflux flow data, it was felt that during the initial design testing phase, it was best to use a system which would evaluate the capabilities of the various devices themselves independent of other factors. Based on those results, then, appropriate improvements could be incor-porated and/or final selections made between competing designs. Once optimized, the final design could then be re-tested with the addition of collapsible tubing to deter-mine the physiologic response of the prototypic valve + vein combination.
Conclusion
From these results, it was concluded that the initial test device produced only a small increases in ΔP (<0.15
mmHg) and R (<0.25 mmHg*min/L) and a small
decrease in EOA (<8%) relative to 'No Device'.
Further-more, it allowed <2% of and <6% of the REL
observed with 'No Device'. Thus, the overall test systems and procedures used proved quite valuable in carrying out this phase of the design process. Further studies are now planned to evaluate biocompatibility concerns such as thrombogenicity and intimal hyperplasia of these devices
in vivo.
Competing interests
The author(s) declare that they have no competing inter-ests.
Authors' contributions
SER designed the normal volunteer study and participated in the data analysis, conceived of the overall design and construction of the in vitro model system, specified the testing protocol and definition of measured variables, and participated in the data collection. MTO prepared design drawings of new devices, assisted in test data collection, and performed the data analysis. SP assisted in the normal volunteer study, performed the data analysis and assisted in construction of the in vitro model system. Each author
has read and approved the final version of this manu-script.
Acknowledgements
The authors would like to acknowledge Ms. Shelly Burns, Coordinator of the Surgical Non-Invasive Laboratory, for performing the ultrasound exam-inations of all the normal volunteers. This study was supported by a grant from the NIH STTR Program (1 R41 HL077984-01).
References
1. Yoganathan AP, Chandran KB, Sotiropoulos F: Flow in prosthetic heart valves: State-of-the-art and future directions. Ann Biomed Engr 2005, 33:1689-94.
2. Taheri SA, Schultz RO: Experimental prosthetic vein valve: Long term results. Angiology 1995, 46:299-303.
3. Delaria GA, Phifer T, Joy J, Tu R, Thyagarajan K, Quijano RC: Hemo-dynamic evaluation of a bioprosthetic venous prosthesis. J Vasc Surg 1993, 18:577-86.
4. Pavcnik D: Chronic venous insufficiency and bioprosthetic bicuspid square stent based venous valve for transcatheter placement. Acta Clin Croatia 2002, 41:93-7.
5. Pavcnik D, Uchida BT, Timmermans HA, Corless CL, O'Hara M, Toy-ota N, Moneta GL, Keller FS, Rosch J: Percutaneous biopros-thetic venous valve: A long-term study in sheep. J Vasc Surg
2002, 35:598-602.
6. Pavcnik D, Kaufman J, Uchida B, Correa L, Hiraki T, Kyu SC, Keller FS, Rosch J: Second-generation percutaneous bioprosthetic valve: A short-term study in sheep. J Vasc Surg 2004, 40:1223-7. 7. Hasaniya NW: In vitro construction of totally autogenous
venous valve: Early experience. Phlebology 2002, 16:142-4. 8. Venpro announces the first worldwide human implant of
percutaneous venous valve bioprosthesis for the treatment of chronic venous insufficiency. Irvine, CA. October 14, 2001
[http://www.venpro.com/pages/archive.html]
9. Kerstein MD, Gahtan V: Outcomes of venous ulcer care: Results of a longitudinal study. Ost/Wound Manag 2000, 46:22-9. 10. Qui Y, Quijano RC, Wang SK, Hwang NHC: Fluid dynamics of
venous valve closure. Ann Biomed Engr 1995, 23:750-9.
11. Kamm RD, Shapiro AH: Unsteady flow in collapsible tubes sub-jected to external pressure of body forces. J Fluid Mech 1979,
95:1-78.
12. Matsuzaki Y, Matusmoto T: Flow in a two-dimensional collapsi-ble channel with rigid inlet and outlet. J Biomech Eng 1989,
111:180-4.
13. Olson DA, Kamm RD, Shapiro AH: Bioengineering studies of periodic external compression as prophylaxis against deep vein thrombosis. Part II: Experimental studies on a simu-lated leg. J Biomech Eng 1982, 104:96-104.
14. Lee D, Abolfathi AH, DeLaria GA, Phifer TJ, Nashef AS, Quijano RC:
In vitro testing of venous valves. ASAIO Trans 1991, 37:M266-8. 15. Raju S, Green AB, Fredericks RK, Neglen PN, Hudson CA, Keonig K:
Tube collapse and valve closure in ambulatory venous pres-sure regulation: Studies with a mechanical model. J Endovasc Surg 1998, 5:42-51.
16. Raju S, Hudson CA, Fredericks R, Neglen P, Greene AB, Meydrech EF: Studies in calf venous pump function utilizing a two-valve experimental model. Eur J Vasc Endovasc Surg 1999, 17:521-32.
VR
Table 5: 1:1 Pulsatile Flow Results for Repeat Measurements in Standing Position.
Test Condition Test Run
(cm3) %Ref (%) REL (mJ) η (%)
STBR 1st 5.83 ± 0.688 18.1± 2.12 2.73 ± 0.654 36.7 ± 0.785
2nd 3.99 ± 0.537* 12.7 ± 2.07* 1.29 ± 0.371* 38.4 ± 0.52*
Change 1.84 5.4 1.44 1.7
STAF 1st 2.21 ± 0.978 7.10 ± 3.27 0.451 ± 0.411 99.4 ± 0.562
2nd 1.55 ± 1.74 4.75 ± 5.27 0.384 ± 0.375 99.6 ± 0.443
Change 0.66 2.35 0.067 0.2
* p < 0.05 vs. 1st Test Run
Publish with BioMed Central and every scientist can read your work free of charge "BioMed Central will be the most significant development for disseminating the results of biomedical researc h in our lifetime."
Sir Paul Nurse, Cancer Research UK
Your research papers will be:
available free of charge to the entire biomedical community
peer reviewed and published immediately upon acceptance
cited in PubMed and archived on PubMed Central
yours — you keep the copyright
Submit your manuscript here:
http://www.biomedcentral.com/info/publishing_adv.asp
BioMedcentral
17. Buescher CD, Nachiappan B, Brumbaugh JM, Hoo KA, Janssen HF:
Experimental studies of the effects of abnormal venous valves on fluid flow. Biotechnol Prog 2005, 21:938-45.