Professor of Neurology, Shahid Beheshti
University of Medical Sciences,
Tehran, Iran
Professor of Neurology,
Shariati Hospital, Tehran University of
Medical Sciences, Tehran, Iran
Associate Professor of Neurology, Neurology Department, Tehran University of
Medical Sciences, Tehran, Iran
,
Tehran
University of Medical Sciences
Email: [email protected]
http://ijnl.tums.ac.ir
Copy Edit, Layout Edit, Proof Reading, Design, Print and Online Support: FaRa Publishing House (Farzanegan Radandish) http://farapub.com Email: [email protected]
Tel/fax: +98 31 32224335, +98 31 32224382
Indexed in
PubMed, PubMed Central, Academic Keys,
Cite Factor (Directory Indexing of International Research Journals),
Directory of Open Access Journals (DOAJ), Directory of Research Journal Indexing (DRJI), Ebsco,
Electronic Journals Library,
Google Scholar, InfoBase Index,
Islamic World Science Citation Center (ISC), LocatorPlus,
Scientific Information Database (SID), Ulrichsweb Global Serials Directory, Universal Impact Factor,
The submission file is in Microsoft Word document file format.
The Iranian Journal of Neurology is dedicated to the Iranian Neurological Association. The journal is a peer- reviewed journal published quarterly and publishes neurological experiences in basic or clinical fields in English Language. The Iranian Journal of Neurology aims to publish manuscripts of a high scientific quality representing original clinical, diagnostic or experimental works or observations in neurological sciences. Papers in English are welcomed, particularly those which bring novel information and researches in clinical or basic fields from the neurological disorders. All received manuscripts coving the scope of the journal will be evaluated by properly competent referees.
Submissions should be accompanied by a cover letter including a declaration by the first author on behalf of the others to the effect that
(1) The paper has not been published to date (except for abstracts of conference materials).
(2) The paper has not been accepted for publication elsewhere.
(3) All persons listed as the authors have read it and approved it for publication. The cover letters should be submitted in section "Comments for the Editor".
Articles must be written in accurate scientific English appropriate for publication. The articles are subject to review and editing; however, the authors are responsible for the correctness the manuscript's English language. The articles must be submitted only online: ijnl.tums.ac.ir
The Editorial Board reserves the right to reject a paper without seeking reviewers’ opinion provide the content or the form of the paper does not meet minimum acceptance criteria or if the subject of the paper is beyond the aims and scope of the journal.
Everyone listed as the author of a paper is responsible for the reliability and completeness of data presented in the paper.
Do not submit papers that copy fully or partially previously published papers.
Indicate that this submission is ready to be considered by this journal by checking off the following:
The submission has not been previously published, nor is it before another journal for consideration (or an explanation has been provided in Comments to the Editor).
Where available, URLs for the references have been provided.
The text is double-spaced; uses an Arial 12-point font; and all illustrations, figures, and tables are placed within the text at the appropriate points, rather than at the end.
The text adheres to the stylistic and bibliographic requirements outlined in the Author Guidelines, which is found in About the Journal.
If the Editorial Board is not notified in advance and the paper is found to have been copied during editorial work, the paper shall be rejected.
We expect that all studies reported in the journal conform to the requirements of the Declaration of Helsinki (1989). Information on the consent of a relevant ethics committee to perform the trial and the informed consent of the patients to participate in the trial should be given in the Material and methods section of each paper in which diagnostic or therapeutic intervention does not follow from the standard procedure. Authors of case reports must not disclose personal data of patients described.
The journal publishes: Original Article Review Article Case Report
Short Communication Clinical Notes Editorial Letters to Editor Neurological Images Neurological Videos Iranian Neurological Events Clinical Quiz
Details
Original and review papers: The maximum length of original and review papers (including tables and figures materials) is 3000 words.
Case reports: Case reports will be accepted only as Letter to the Editor.
Short communications: The maximum word number of short communications should be below 1200 words with maximum one table or figure and 10 references. The manuscript should be structured including introduction, materials and methods, results, discussion, and conclusion with a structured abstracts as original articles.
neurological images or videos are welcome. They should be maximally 400 words with legends without abstract and unstructured. The videos should be uploaded as supplementary files.
Letter to the Editor: May concern short scientific reports and comments. The maximum number of words should be below 800 words with maximum 5 references, no abstract, no table or figure, and unstructured.
Clinical notes: Refer to important interesting observations which are imperative for reminders in clinical practice. The maximum number is 1000 words with maximum 5 references, 1 table and 1 figure with no abstract.
Iranian neurological events: Include the brief description of major regional events (congresses or seminar) implemented in Iran.
Manuscripts should be submitted in 12 points, Arial font, with double line spacing and sufficient margins of 2.5 cm.
The text should not be formatted.
Each section of the paper should begin on a new page
Page 1: Title Page
Page 2: Abstract and Key Words
Page 3 and subsequent pages: manuscript body including Introduction, Materials and Methods, Results, Discussion, Conclusion, References, Tables, Figures 1. Title page:
Title page should contain paper title, full names of authors, authors’ place of work, full name and address of the corresponding author (including e-mail address and telephone number), given in that order.
2. Abstract page:
The length of the abstract should be at least 200 and not more than 250 words for original papers and not more than 150 words for review papers and case reports. Abstracts of original papers should be structured to include the background, methods, results and conclusion.
Below the abstract authors should provide between three and six keywords conforming to Medical Subject Headings (Index Medicus).
3. Page three and subsequent pages of the original paper and short communication should include the text arranged in the following order (for other manuscript type, see above):
1. Introduction: The introduction should be as concise as possible and introduce the context of the paper to the reader; the paper should clearly state the research hypothesis and the objective of the study.
2.Materials and Methods: Description of the studied population or material should be detailed and include all information necessary to assess the reliability of results obtained in the study and/or allow the experiment to be repeated by other researchers; the section related to statistical analysis should have information on applied statistical tests and programs.
3. Results: Present results directly related to the topic of the paper only; tables and/or figures are recommended.
4.Discussion
5. Conclusions: These should be brief, follow directly from results presented above and correspond to the aim of the paper outlined in the introduction.
6.Acknowledgements: Should comprise information on sources of funding (grant numbers); acknowledgements should concern those who made a significant contribution to the paper, but who did not meet the criteria to be listed as authors.
7.References: References should be listed in the order quoted in the paper. Please cite source and major papers that offer interested readers an opportunity to obtain more detailed information. Avoid citing review papers and conference reports, if they are not the only materials on a given topic.
In the paper references should be given in superscripts with no space between the comma and the consecutive number.
Authors are advised to carefully verify citation details. Give names of first six authors; if there are more authors, add “et al.“. Use Index Medicus abbreviations for journal titles. Then mention the volume and the issue of the journal.
The recommended style for journal references is as follows:
[Reference number][Authors]. [Article title]. [Journal Name] [Year of publication]; [volume](issue): [Pages range].
For Journal Example:
1. Janghorbani M, Amini M, Willett WC, Mehdi Gouya M, Delavari A, Alikhani S, et al. First nationwide survey of prevalence of overweight, underweight, and abdominal obesity in Iranian adults. Obesity (Silver Spring) 2007; 15(11): 2797-808.
For Books Example:
2. Ropper AH, Brown RJ. Adams and Victors principles of neurology. 8th ed. New York, NY: McGraw Hill Professional; 2005. p. 271.
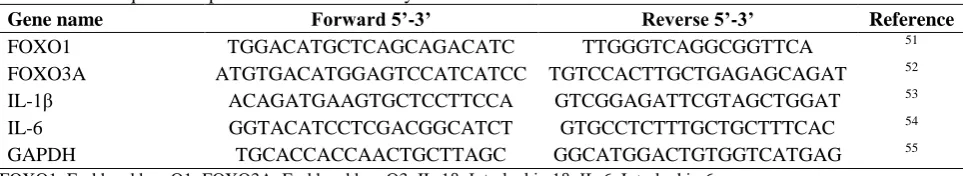
Tables: Each table should be placed on a separate page. Tables should be numbered with Arabic numerals in the order in which they appear in the text. Authors should indicate the position of tables in the paper. Titles and headings of tables should be given in English. Information given in tables should not be repeated in the body of the text. Explanations concerning tables, e.g. full names of abbreviations should be given in footers below tables and should be consecutively marked: “*”,“**”,“***” etc. Figures: Figures and photographs should be numbered with Arabic numerals and attached as separate printouts (in the electronic version, as separate files). Figures should be saved in one of the following formats: .jpg.
delivered, so they must be prepared carefully. Please indicate where they should be placed in the text.
Abbreviations should be always clarified when used for the first time in the text (including the abstract). Abbreviations should not be used in paper titles, unless in exceptional circumstances.
Review process: All papers submitted for publication in the journal are assessed by two independent reviewers with the mutual anonymity rule as to the names of reviewers and authors observed.
Plagiarism policy: According to the plagiarism policy of Iranian Journal of Neurology, plagiarism is defined as a paper which replicates another publication with as a minimum 25% resemblance and devoid of citation.
In any time the evidence of plagiarism is detected, the manuscript will be withdrawn and the author will be sanctioned from publishing papers permanently.
Table of Contents
Original Article(s)
Determination of cut-off point of cross-sectional area of median nerve at the wrist for
diagnosing carpal tunnel syndrome
Majid Ghasemi, Sanaz Masoumi, Behnaz Ansari, Mahboobeh Fereidan-Esfahani,
Seyed Morteza Mousavi ... 164-167
The relationship of multiple sclerosis and cerebral developmental venous anomaly with
an advantageous role in the multiple sclerosis diagnosis
Mohammad Reza Sasani, Ali Reza Dehghan, Ali Reza Nikseresht ... 168-172
Analysis of apolipoprotein E genetic variation in patients with Alzheimer disease
referred to Imam Reza Clinic, Rasht, Iran, in 2015
Amir Reza Ghayeghran, Maryam Akbarshahi, Zivar Salehi, Ali Davoudi-Kiakalayeh ... 173-177
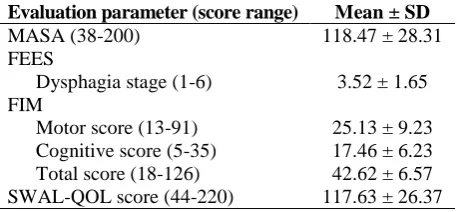
The effect of swallowing rehabilitation on quality of life of the dysphagic patients with
cortical ischemic stroke
Kadir Bahcecı, Ebru Umay, Ibrahim Gundogdu, Eda Gurcay, Erhan Ozturk, Sibel Alıcura ... 178-184
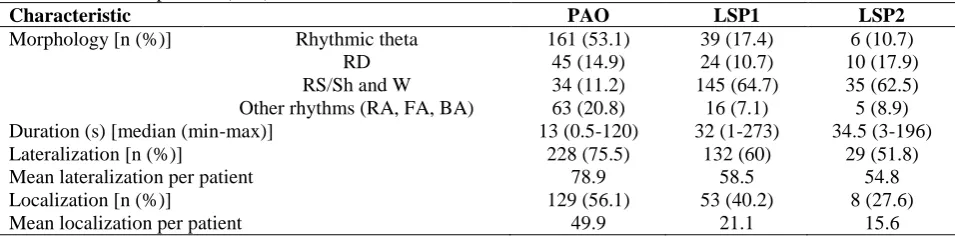
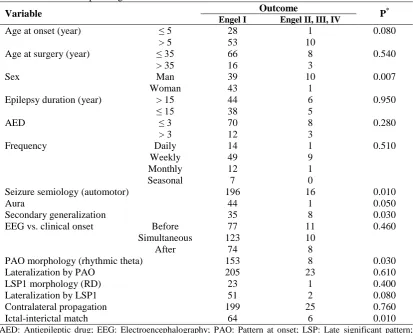
Prognostic value of ictal onset patterns in postsurgical outcome of temporal lobe epilepsy
Jafar Mehvari-Habibabadi, Reza Basiratnia, Houshang Moein, Mohammad Zare,
Majid Barakatain, Yahya Aghakhani, Nasim Tabrizi ... 185-191
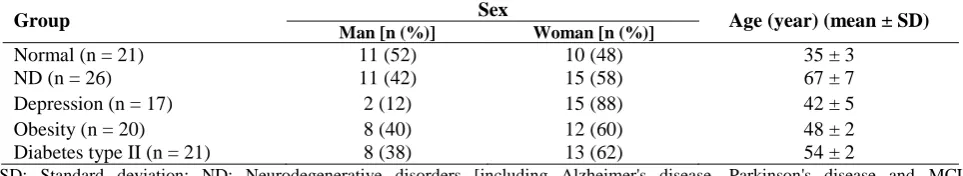
Molecular changes in obese and depressive patients are similar to neurodegenerative
disorders
Laleh
Habibi,
Abbas
Tafakhori,
Rasoul
Hadiani,
Maryam
Maserat-Mashhadi,
Zeinab Kafrash, Shahla Torabi, Mohammad Azhdarzadeh, Seyed Mohammad Akrami,
Morteza Mahmoudi, Rasoul Dinarvand ... 192-200
Ten-year trend in stroke incidence and its subtypes in Isfahan, Iran during 2003-2013
Ahmad Bahonar, Alireza Khosravi, Fariborz Khorvash, Mohammadreza Maracy,
Shahram Oveisgharan, Noushin Mohammadifard, Mohammad Saadatnia, Fatemeh Nouri,
Nizal Sarrafzadegan ... 201-209
Review Article
Molecular mechanisms of omega-3 fatty acids in the migraine headache
Neda Soveyd, Mina Abdolahi, Sama Bitarafan, Abbas Tafakhori, Payam Sarraf,
Mansoureh Togha, Ali Asghar Okhovat, Mahsa Hatami, Mohsen Sedighiyan,
Mahmoud Djalali, Niyaz Mohammadzadeh-Honarvar ... 210-217
Short Communication
Height, shape and anterior-posterior diameter of pituitary gland on magnetic resonance
imaging among patients with multiple sclerosis compared to normal individuals
Mohammad Saba, Hossein Ali Ebrahimi, Habibeh Ahmadi-Pour, Mohammad Khodadoust ....218-220
Clinical Note
Vertebral artery occlusion after anterior cervical discectomy with fusion
Iranian Journal of Neurology © 2017 Corresponding Author: Sanaz Masoumi
Email: [email protected] Email: [email protected]
http://ijnl.tums.ac.ir 7 October
Original Paper
Iran J Neurol 2017; 16(4): 164-7
Determination of cut-off point of
cross-sectional area of median nerve
at the wrist for diagnosing carpal
tunnel syndrome
Majid Ghasemi1, Sanaz Masoumi1, Behnaz Ansari1, Mahboobeh Fereidan-Esfahani1, Seyed Morteza Mousavi2
1 Department of Neurology, School of Medicine, Isfahan University of Medical Sciences, Isfahan, Iran
2 Department of Life Science, School of Sciences, University of British Colombia, Vancouver, Canada
Keywords
Carpal Tunnel Syndrome; Electrophysiology; Ultrasonography
Abstract
Background: The most common entrapment
mononeuropathy of the upper extremity is carpal tunnel syndrome (CTS). It consists 90% of entrapment neuropathies. The purpose of this study was to compare cross-sectional area (CSA) of the median nerve at the wrist in CTS patients and healthy controls and define the best cut-off point of CSA to differentiate patients and controls in Iranian population.
Methods: In this study, 45 patients with confirmed idiopathic CTS and 62 healthy controls were evaluated. Based on electrophysiological findings, patients were divided based on CTS severity into three groups of mild, moderate and severe. The largest CSA was measured at the level of distal wrist crease which is consistent with carpal tunnel inlet. Results: Mean CSA was 0.124 ± 0.031 mm2, 0.146 ± 0.028 mm2 and 0.194 ± 0.062 mm2 in mild, moderate and severe CTS patients respectively, and 0.077 ± 0.011 mm2 in controls. Our results showed
that participants with CSA > 0.010 had CTS with 100% specificity and 83.12% sensitivity.
Conclusion: It is possible to diagnose CTS by measuring CSA and using above-mentioned cut-off point.
Introduction
The most frequent entrapment neuropathy is the neuropathy of median nerve at the wrist, called carpal tunnel syndrome (CTS), which occurs as a result of compression of the median nerve at the carpal tunnel. CTS is one of the leading causes of hand dysfunction. Median nerve entrapment in the carpal tunnel causes clinical symptoms such as
pain, numbness, and tingling.1-4 The prevalence of
CTS has been shown to be 5.8% and 0.6% in
women and men, respectively.5 A few studies
conducted in the United States of America showed
0.2% of all outpatient visits had been due to CTS.6
Although electrophysiological tests have been considered as the gold standard for CTS diagnosis and distinguishing the different severities of
disease,7,8 their sensitivity ranges from 49% to 86%
and their false negative range is between 16% and
34%.9,10 This variability seems to be attributed to
different study methods and measurement
Iranian Journal
of Neurology
M. Ghasemi, et al.
Iran J Neurol, Vol. 16, No. 4 (2017) 165 techniques, in addition to demographic factors
such as gender, age and weight.11
In the last few years, it has been shown that ultrasonography is a useful diagnostic tool for CTS diagnosis because of its noninvasiveness,
lower cost and wide availability.3,12 The
cross-sectional area (CSA) of the median nerve at different locations, can be measured for this aim. Different studies showed that CSAs of the median nerve at different levels of the carpal tunnel are significantly greater in CTS patients as compared to normal population. Various studies suggested different cut-off points for the diagnosis of CTS.13,14 In previous studies, cuto-ff point of
cross-sectional area at tunnel inlet in CTS patients
ranged from 6.5 to 15 mm2.15-18
The aim of this study was to compare CSA of the median nerve at the wrist in patients with CTS and normal controls and define the best cut-off point of CSA to differentiate patients and controls in Iranian population.
Materials and Methods
This case-control study was conducted in a one-year period in the neuromuscular department of teaching hospitals of Isfahan, Iran. According to sample size estimation, at least 14 patients were needed to be enrolled in each group, but for more accurate results we enrolled 45 patients with established idiopathic CTS (within two weeks of electrophysiological examination) in 77 of their wrists and 62 healthy controls, with 124 normal wrists.
All electrodiagnostic (EDX) studies were done before ultrasonography evaluation by a neurologist with neuromuscular expertise. According to EDX results, patients were categorized as mild, moderate, and severe CTS
based on the following criteria.8 Mild: Prolonged
distal sensory nerve action potential-latency (SNAP-L) and/or median mixed nerve action potential-latency (MNAP-L), and normal distal compound muscle action potential-latency (CMAP-L), and normal amplitudes of all responses. Moderate: Prolonged SNAP-L and CMAP-L, and with or without diminished amplitudes of all tested responses. Severe: Unobtainable median sensory nerve action potential plus low-amplitude or unobtainable median compound muscle action potential and, if present, prolonged CMAP-L.
Patients with underlying diseases that may affect CSA of median nerve independent of CTS, such as wrist trauma, cervical radiculopathy,
polyneuropathy, and CTS patients with previous corticosteroid injection were excluded.
All participants filled out an informed consent before the study. All ultrasonography evaluations were done by means of a 13-MHz (SonoSite) linear array Transducer. The examiner was blinded to clinical symptoms and EDX results. Patients were asked to lie on the bed while their forearms are extended. They were rested in the supine position on a smooth surface, and their fingers were semi-extended. The largest CSA was measured at the wrist as described by Ziswiler,
et al.,19 at the beginning of the examination by
performing gray scale examination.
Data were analyzed by using SPSS software (version 18, SPSS Inc., Chicago, IL, USA), presented as the mean ± standard deviation (SD). The analysis of variance (ANOVA) was applied for comparing continuous variables. Receiver operating characteristic (ROC) curve was used to determine optimal cut-off values of the median nerve inlet CSA. In addition, we used analysis of covariance (ANCOVA) to neutralize the confounding effects of different factors on CSA. The area under the curve (AUC) was calculated.
P ≤ 0.050 was statistically considered significant.
Results
Table 1 and figure 1 both show the descriptive statistics of the median nerve CSA at the wrist.
Table 1. Descriptive statistics of median nerve cross-sectional area (CSA) at the level of carpal tunnel inlet in mild, moderate, and severe carpal tunnel syndrome (CTS)
Subjects Mean ± SD Range
Control 0.077 ± 0.012 0.05-0.10 Mild 0.124 ± 0.032 0.08-0.18 Moderate 0.147 ± 0.028 0.08-0.19 Severe 0.195 ± 0.063 0.11-0.32 Total 0.106 ± 0.049 0.05-0.32
SD: Standard deviation
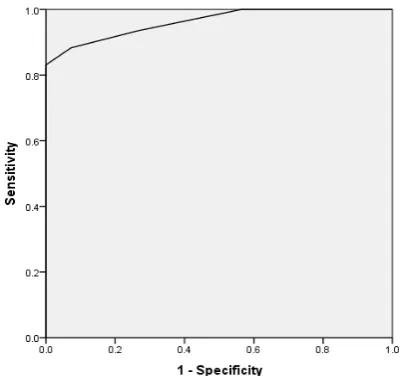
As the aim of our study was a differentiation between healthy controls and CTS patients using CSA, ROC curve was used to define a cut-off point for the diagnosis of CTS. Different values of CSA were considered as cut-off points. Sensitivity and specificity (percent of correct detection of controls and patients) were determined for each cut-off point (Figure 2).
Determination of median nerve for diagnosing CTS
166 Iran J Neurol, Vol. 16, No. 4 (2017)
http://ijnl.tums.ac.ir 7 October
point. So our results showed that participants
with CSA > 0.01 had CTS with 83.12% sensitivity and 100% specificity. AUC of ROC curve was calculated equal to 0.962, which is statistically significant (P < 0.001), and showed the prediction ability of CSA is not based on chance.
Figure 1. Mean cross-sectional area (CSA) of median nerve in different groups
ANOVA showed that mean CSA-D has a statistically significant difference between controls and different groups of patients (P < 0.001). Our analyses showed that the mean age has a significant difference between case and control groups; therefore, ANCOVA was used to adjust this difference. However, there was still a significant difference of mean CSA-D between two groups with adjusting to age (P < 0.001).
Figure 2. Receiver operating characteristic (ROC) curve
Discussion
Our results demonstrated that the largest mean
value of CSA is (0.194 mm2) in severe CTS
patients and the smallest mean value is
(0.124 mm2) in mild CTS patients. Thus, there is
the statistically significant difference between the mean CSA in severe and mild CTS patients. In addition, the results of this study showed that mean CSA of the median nerve at the wrist in CTS patients was significantly different from healthy controls and the best cut-off point of CSA for
diagnosing CTS is 0.543 mm2, which is an
appropriate value.
Mohammadi, et al. studied the diagnostic significance of median nerve CSA in severity grading of CTS. Unlike our results, they found that the difference in CSA of the median nerve in different severities of CTS was not statistically significant in either the tunnel inlet or outlet. They also concluded that ultrasonography does not have any diagnostic value for grading the severity
of CTS.16
Similar to our study, Sarraf, et al. studied the best cut-off point for the median nerve CSA at the level of carpal tunnel Inlet. According to their results, mean CSA and perimeter in patients and healthy controls were significantly different and
the best cut-off point for CSA was 10.5 mm2 with
80% and 76% sensitivity and specificity, respectively. Ultimately, they believed that median nerve CSA at the wrist is helpful as a
diagnostic tool for CTS.18
Dalili, et al. concluded that the CSA of median nerve at both inlet and outlet of the carpal tunnel has a considerable association with CTS diagnosis and could be used for diagnosis of CTS, which is
similar to our findings.7
Also, we found that the sensitivity and specificity of CSA equal to 0.105 for diagnosing CTS is 83.1%, 100%, respectively.
In contrast to our results, Yazdchi, et al. concluded that the sensitivity and specificity of the median nerve ultrasonography for diagnosing CTS were low and ultrasonography could not replace nerve conduction study which is the gold standard of this diagnosis, but it might provide
useful information.13
Ziswiler, et al. investigated the largest CSA of the median nerve at the wrist and found a mean
value of 12.2 mm2 in CTS patients and 7.9 mm2 in
controls. Moreover, a cut-off point of 10 mm2
showed 82% and 87% sensitivity and specificity,
respectively.19
In Nakamichi and Tachibana study, with the
median nerve CSA cut-off point value of 12 mm2,
67% sensitivity, 97% specificity, and 82% accuracy
were reported.20
Ulasli, et al. studied the reasons for using
0.08
0.12 0.15
0.20
0.00 0.05 0.10 0.15 0.20 0.25
Cross-sectional
area m
ean
M. Ghasemi, et al.
Iran J Neurol, Vol. 16, No. 4 (2017) 167 swelling ratio in sonographic diagnosis of CTS
and a liable method for its calculation. Their results showed that the greatest sensitivity (99%) of the median nerve CSA is where the cut-off
point is considered 10 mm2. However, it had a
low specificity value (71%), which increased the
false positive rate.21
Conclusion
The current study showed that diagnosis of CTS is possible by measuring CSA. According to our findings, the most excellent cut-off point of median nerve CSA at the the wrist is 0.105 (with 100% specificity and 83.1% sensitivity) and 0.095 (more sensitive than the first cut-off point). It is an appropriate method in order to diagnose CTS.
Conflict of Interests
The authors declare no conflict of interest in this study.
Acknowledgments
We are grateful to all of those with whom we have had the pleasure to work during this and other related projects, especially our patients for their great cooperation.
How to cite this article: Ghasemi M, Masoumi S, Ansari B, Fereidan-Esfahani M, Mousavi SM. Determination of cut-off point of cross-sectional area of median nerve at the wrist for diagnosing carpal tunnel syndrome. Iran J Neurol 2017; 16(4): 164-7.
References
1. Atroshi I, Gummesson C, Johnsson R, Ornstein E, Ranstam J, Rosen I. Prevalence of carpal tunnel syndrome in a general population. JAMA 1999; 282(2): 153-8.
2. Aroori S, Spence RA. Carpal tunnel syndrome. Ulster Med J 2008; 77(1): 6-17. 3. Schappert SM, Rechtsteiner EA.
Ambulatory medical care utilization estimates for 2006. Natl Health Stat Report 2008; (8): 1-29.
4. Deniz FE, Oksuz E, Sarikaya B, Kurt S, Erkorkmaz U, Ulusoy H, et al. Comparison of the diagnostic utility of electromyography, ultrasonography, computed tomography, and magnetic resonance imaging in idiopathic carpal tunnel syndrome determined by clinical findings. Neurosurgery 2012; 70(3): 610-6. 5. de Krom MC, Knipschild PG, Kester AD, Thijs CT, Boekkooi PF, Spaans F. Carpal tunnel syndrome: Prevalence in the general population. J Clin Epidemiol 1992; 45(4): 373-6.
6. Moran L, Perez M, Esteban A, Bellon J, Arranz B, del Cerro M. Sonographic measurement of cross-sectional area of the median nerve in the diagnosis of carpal tunnel syndrome: Correlation with nerve conduction studies. J Clin Ultrasound 2009; 37(3): 125-31. 7. Dalili A, Mardani-kivi M, Alizadeh A,
Hatamian H, Hoseininejad M, Peyrazm H, et al. Comparison between Sonography and Electrodiagnostic Testing in the Diagnosis of Carpal Tunnel Syndrome. J Anesth Pain 2011; 2(5): 43-51.
8. Sucher BM. Grading severity of carpal tunnel syndrome in electrodiagnostic
reports: Why grading is recommended. Muscle Nerve 2013; 48(3): 331-3. 9. Jablecki CK, Andary MT, So YT,
Wilkins DE, Williams FH. Literature review of the usefulness of nerve conduction studies and electromyography for the evaluation of patients with carpal tunnel syndrome. AAEM Quality Assurance Committee. Muscle Nerve 1993; 16(12): 1392-414.
10. Witt JC, Hentz JG, Stevens JC. Carpal tunnel syndrome with normal nerve conduction studies. Muscle Nerve 2004; 29(4): 515-22.
11. Fu T, Cao M, Liu F, Zhu J, Ye D, Feng X, et al. Carpal tunnel syndrome assessment with ultrasonography: Value of inlet-to-outlet median nerve area ratio in patients versus healthy volunteers. PLoS One 2015; 10(1): e0116777. 12. Karadag YS, Karadag O, Cicekli E,
Ozturk S, Kiraz S, Ozbakir S, et al. Severity of Carpal tunnel syndrome assessed with high frequency ultrasonography. Rheumatol Int 2010; 30(6): 761-5.
13. Yazdchi M, Tarzemani MK, Mikaeili H, Ayromlu H, Ebadi H. Sensitivity and specificity of median nerve ultrasonography in diagnosis of carpal tunnel syndrome. Int J Gen Med 2012; 5: 99-103.
14. Sarria L, Cabada T, Cozcolluela R, Martinez-Berganza T, Garcia S. Carpal tunnel syndrome: usefulness of sonography. Eur Radiol 2000; 10(12): 1920-5.
15. Pinilla I, Martin-Hervas C, Sordo G, Santiago S. The usefulness of
ultrasonography in the diagnosis of carpal tunnel syndrome. J Hand Surg Eur Vol 2008; 33(4): 435-9.
16. Mohammadi A, Afshar A, Etemadi A, Masoudi S, Baghizadeh A. Diagnostic value of cross-sectional area of median nerve in grading severity of carpal tunnel syndrome. Arch Iran Med 2010; 13(6): 516-21.
17. Lee D, van Holsbeeck MT, Janevski PK, Ganos DL, Ditmars DM, Darian VB. Diagnosis of carpal tunnel syndrome. Ultrasound versus electromyography. Radiol Clin North Am 1999; 37(4): 859-72, x.
18. Sarraf P, Malek M, Ghajarzadeh M, Miri S, Parhizgar E, Emami-Razavi SZ. The best cutoff point for median nerve cross sectional area at the level of carpal tunnel inlet. Acta Med Iran 2014; 52(8): 613-8.
19. Ziswiler HR, Reichenbach S, Vogelin E, Bachmann LM, Villiger PM, Juni P. Diagnostic value of sonography in patients with suspected carpal tunnel syndrome: A prospective study. Arthritis Rheum 2005; 52(1): 304-11.
20. Nakamichi K, Tachibana S. Ultrasonographic measurement of median nerve cross-sectional area in idiopathic carpal tunnel syndrome: Diagnostic accuracy. Muscle Nerve 2002; 26(6): 798-803.
Iranian Journal of Neurology © 2017 Corresponding Author: Mohammad Reza Sasani
Email: [email protected] Email: [email protected]
http://ijnl.tums.ac.ir 7 October
Original Paper
Iran J Neurol 2017; 16(4): 168-72
The relationship of multiple sclerosis
and cerebral developmental venous
anomaly with an advantageous role
in the multiple sclerosis diagnosis
Mohammad Reza Sasani1,2, Ali Reza Dehghan2, Ali Reza Nikseresht3,4
1 Medical Imaging Research Center, Shiraz University of Medical Sciences, Shiraz, Iran
2 Department of Radiology, School of Medicine, Shiraz University of Medical Sciences, Shiraz, Iran 3Autoimmune Diseases Research Center, Shiraz University of Medical Sciences, Shiraz, Iran 4 Department of Neurology, School of Medicine, Shiraz University of Medical Sciences, Shiraz, Iran
Keywords
Multiple Sclerosis; Cerebral Venous Angioma; Pathogenesis; Intracranial Central Nervous System Disorders; Venous Insufficiency; Magnetic Resonance Imaging
Abstract
Background: There is a suggestion for a role of abnormal cranial venous drainage in the etiopathogenesis of multiple sclerosis (MS). Moreover, it seems that cerebral developmental venous anomaly (DVA), a cerebrovascular malformation, is frequently seen in the magnetic resonance imaging (MRI) of MS patients. This study is set out to evaluate the relationship between MS and cerebral DVA, with its possible role in the MS diagnosis.
Methods: We compared MRI of 172 MS patients and of 172 age- and sex-matched subjects without MS. Then, we recorded and analyzed the presence, number, and location of developmental venous anomalies.
Results: Frequency of DVA did not have a significant statistical difference (P = 0.148) in subjects with MS
(12.21%) and without MS (7.55%). Moreover, a difference of anatomic distribution of supratentorial developmental venous anomalies was not statistically significant (P = 0.690, for juxtacortical, P = 0.510 for subcortical, and P = 0.420 for periventricular DVAs) in two groups.
Conclusion: Our investigation does not provide supporting evidence for a relationship between etiopathogenesis of MS and DVA. Furthermore, it may not be possible to use cerebral DVA as ancillary MRI finding to make MS diagnosis simpler and more accurate.
Introduction
Multiple sclerosis (MS) is an inflammatory
demyelinating disease of central nervous
system,1,2 identified from more than one century,3
but its etiology is still in doubt.4 Recently,
abnormal cranial venous drainage has been described to have a possible role in the etiopathogenesis of MS. On the other hand, it has been suggested that the area of brain affected by developmental venous anomaly (DVA), also
Iranian Journal
of Neurology
M.R. Sasani, et al.
Iran J Neurol, Vol. 16, No. 4 (2017) 169 known as venous angioma, does not have normal
venous drainage.5 Additionally, it seems that
cerebral DVAs are frequently seen in the brain magnetic resonance imaging (MRI) of MS patients. These explanations raise the question whether MS and DVA have any association. Furthermore, there is an issue about the coincidence of MS and DVA as well as an advantageous role of DVA (as an ancillary finding in brain MRI) in the diagnosis of MS.
Histopathologically, there is perivenular
inflammation and demyelination in MS plaques,6,7
which are located characteristically in juxtacortical, periventricular, or infratentorial
regions of the brain.8 Moreover, categorization of
DVAs into three groups of juxtacortical, subcortical, periventricular is relevant to their
location and drainage pattern.9 In fact, these
explanations may support the relationship of MS and DVA.
Another area for consideration is the era of MS diagnosis. MRI is salient imaging modality for diagnosing MS with the use of McDonald
criteria.1,10 Although MRI is a sensitive tool to find
MS plaques, its specificity is low and might lead to a fault in the diagnosis especially in the early
period of MS.1,7,10 The reason is that the other
conditions such as a migraine and microvascular disease, which have hypersignal white matter
foci, could simulate MS plaques.7 Consequently,
the recognition of ancillary findings in brain MRI might help to diagnose MS simpler and more accurately. During our daily work, the DVAs have been frequently encountered in brain MRI of patients with lesions suspicious to MS. It has been proposed the idea that one of the ancillary findings may be the presence of cerebral DVA. We believe that it is essential to conduct a study to address questions about the possible relationship and the coincidence of MS and DVA.
Although several studies have been carried out to evaluate the possible relationship between abnormal cerebral venous flow and MS, there is a controversy about this topic. Furthermore, it has been suggested that the coincidence of vascular malformation and MS might happen but little attention has been drawn to this topic in the
literature.11 A research, using transcranial color
duplex sonography, concluded that altered venous flow could have a possible role in MS
inflammatory process.12 Another multicenter
study with use of color Doppler sonography reported that there is a relationship between chronic cerebrospinal venous insufficiency and
MS.13 However, they have suggested using more
reliable imaging modality due to variable data about the diagnosis of chronic cerebrospinal
venous insufficiency in different centers.13 By
contrast, another study utilizing magnetic resonance venography (MRV) and MR flow quantification showed equal distribution of anomalous cranial venous outflow in MS patients
and healthy subjects.14 They finally concluded
that mentioned anomalous cranial venous outflow probably stand for anatomical variations of venous drainage rather than abnormalities that
might have relationship with MS.14
The purpose of this study is to compare the frequency and anatomical distribution of cerebral DVA in MS patients and healthy subjects in order to emphasize on the relationship of their etiopathogenesis along with identification of DVA as an ancillary MR finding. It may help to make MS diagnosis simpler and more accurate.
Materials and Methods
This case-control study was conducted to compare the frequency and anatomic distribution of DVAs in patients with MS and subjects without MS. A total of 344 participants were recruited for this study. Eligible cases consisted of 172 patients with definite diagnosis of MS were referred from neurology clinic. Control group consisted of 172 subjects without MS were referred to perform MRI with non-specific reason. Subject demographics are presented in table 1. The mean age ± standard deviation (SD) of the case group was 32.75 ± 0.57 years, while it was 32.44 ± 0.58 years for the control group (age range in both groups was 18-50 years). Case and control groups were matched by age and sex. The local ethical committee approved this study and written informed consent was obtained from the participants.
Table 1. Sex and age distribution in case and control groups
Group Man [n (%)] Woman [n (%)] Age (year) (mean ± SD) Age range (year)
MS and cerebral DVA
170 Iran J Neurol, Vol. 16, No. 4 (2017)
http://ijnl.tums.ac.ir 7 October
Exclusion criteria for case group were the
presence of pathologies other than MS, such as malignancy, meningoencephalitis, vasculitis, hematopoietic disorders and history of other immunological diseases. Exclusion criteria for the control group were suspicious MS (clinically or radiologically); the presence of any abnormality (except for DVA) in MRI, or previous history of malignancy, meningoencephalitis, vasculitis, hematopoietic disorders, and other immunological diseases.
Brain MRI images were acquired using MRI systems operating with a magnetic field strength of 1.5 Tesla (Magnetom Avanto mobile MRI 02.05, software version: Syngo MR B15; Siemens Ltd, Erlangen, Germany) and the following sequences were obtained: Axial and coronal T2-weighted sequences, axial FLAIR (fluid attenuated inversion recovery) sequence, sagittal proton density-weighted sequence, axial and sagittal pre-contrast T1-weighted sequences as well as axial, sagittal and coronal post contrast T1-weighted sequences after administration of 0.1 mmol/kg of gadolinium contrast agents including Magnevist (gadopentetate dimeglumine, Germany) or Omniscan (gadodiamide, Ireland) or Dotarem (gadoteric acid, France).
All the MRI images studied by one radiologist and the presence, number, and location of DVAs were recorded. The diagnosis of DVA was based on its appearance on MRI images as multiple enlarged enhancing vessels with star-like configuration draining into a collecting vessel. The DVAs were assorted as supratentorial and infratentorial. In addition, supratentorial DVAs were categorized into three subgroups as juxtacortical (within a gray matter or at the junction of gray and white matter), periventricular (adjacent to ventricles), subcortical (between the juxtacortical and periventricular area).
Data analysis was performed using SPSS software (version 17, SPSS Inc., Chicago, IL, USA). The case and control groups were compared to each other by using the chi-square test and different variables were correlated with Pearson correlation. P less than 0.050 were regarded as statistically significant.
Results
A total of 344 participants (172 cases and 172 controls) were recruited for this study. Case and control subjects had similar age and sex distribution
without significant difference (P = 0.070).
Twenty-one (12.21%) patients of the case group and 13 (7.55%) subjects of the control group had DVAs. There was no significant difference between the two groups regarding frequency of DVAs (P = 0.148).
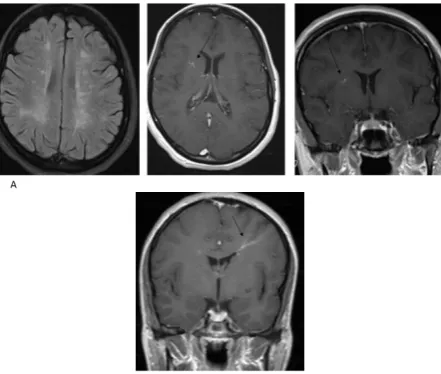
Of the 21 DVAs in the cases, 18 were supratentorial (Figure 1) and three were infratentorial. In the control group, three subjects had more than one DVA and a total of 17 DVAs (16 supratentorial, 1 infratentorial) detected in this group. The analysis did not reveal a significant difference between two groups on the subject of supratentorial DVAs (P = 0.400). Because of a limited number of infratentorial DVAs, they were not analyzed.
Figure 1. Developmental venous anomaly (DVA) in a patient with multiple sclerosis (MS). Axial fluid-attenuated inversion recovery image shows MS (multiple sclerosis) plaques and post-contrast T1-weighted images show enhancing vessels joining the collecting vein (arrows) (A), Developmental venous anomaly (DVA) in a control subject. Post-contrast T1-weighted image shows enhancing vessels joining the collecting vein (arrow) (B).
Table 2 summarizes the anatomical distribution of supratentorial DVAs. The difference between cases and controls on the subject of juxtacortical, subcortical, and periventricular DVAs was tested. P for juxtacortical DVAs was 0.690, for subcortical ones was 0.510, and for periventricular ones was 0.420. None of these differences was statistically significant.
Discussion
M.R. Sasani, et al.
Iran J Neurol, Vol. 16, No. 4 (2017) 171 significant statistically. Moreover, there was no
statistically significant difference between cases and controls in terms of anatomic distribution of DVAs. We were surprised to find higher value for DVA frequency in subjects without MS, approximately 7.55%, as compared to previously reported frequency of DVA in the literature,
which had been less than 2%.5,15,16
Table 2. Anatomical distribution of supratentorial
developmental venous anomaly (DVA) in case and control groups
Supratentorial DVA [n (%)] Case Control [n (%)] P*
Juxtacortical 3 (16.6) 3 (18.8) 0.690 Subcortical 7 (38.9) 8 (50.0) 0.510 Periventricular 8 (44.5) 5 (31.2) 0.420
*Chi-square test
DVA: Developmental venous anomaly
This investigation does not provide additional support for the association between anomalous cranial venous drainage and MS. Although the frequency of DVA in cases and controls was different, it was not statistically significant indicating that DVA is not more common in MS patients. Accordingly, it may not be possible to utilize cerebral DVA as ancillary MR finding for the diagnosis of MS. Moreover, anatomical distribution of DVA in the brain shows no significant correlation with the characteristic location of MS plaques. In fact, our results do not reinforce the association of MS and DVA, as an example of anomalous venous drainage.
Our results are consistent with previous works that claimed there is no relationship between chronic cerebrospinal venous insufficiency and etiopathogenesis of MS. In a study, using phase contrast MRI and with focus on the internal jugular vein, there was no supporting evidence
for vascular MS hypothesis.17 In another study, no
association between chronic cerebrospinal venous insufficiency and lesion burden in MS patients
could be found.18 Results of another investigation
were against the significant role of venous
congestion in MS pathogenesis.19
As noted, this study shows a higher value for the frequency of DVA in subjects without MS.
This finding can be justified in part by our study population, which control subjects were not selected from the general population. Another possible explanation for this may be that some DVA cases were not diagnosed in the past years due to the lower magnetic field strength of MRI systems or lower quality of their images. Therefore, we recommend that further research should be undertaken in this area.
A limitation of our research is that controls were not selected from the general population and they consisted of subjects without MS who referred to perform MRI with non-specific reason. However, we excluded subjects with suspicious MS (clinically or radiologically), those with any abnormality in MRI, and those with positive past history (as previously mentioned).
Conclusion
Frequency and anatomical distribution of cerebral DVA in patients with MS do not reveal a significant difference in comparison with subjects without MS. Consequently, our investigation does not provide supporting evidence for the relationship of the etiopathogenesis of MS and DVA, as an example of anomalous venous drainage. Furthermore, it may not be possible to utilize cerebral DVA as ancillary MR finding to make MS diagnosis simpler and more accurate.
Conflict of Interests
The authors declare no conflict of interest in this study.
Acknowledgments
The present article was extracted from the thesis written by Ali Reza Dehghan and was financially supported by Shiraz University of Medical Sciences, Iran (grant number 5527).
How to cite this article: Sasani MR, Dehghan AR, Nikseresht AR. The relationship of multiple sclerosis and cerebral developmental venous anomaly with an advantageous role in the multiple sclerosis diagnosis. Iran J Neurol 2017; 16(4): 168-72.
References
1. Milo R, Miller A. Revised diagnostic criteria of multiple sclerosis. Autoimmun Rev 2014; 13(4-5): 518-24.
2. Brinar VV, Barun B. Challenges in multiple sclerosis; how to define
occurence of progression. Clin Neurol Neurosurg 2013; 115(Suppl 1): S30-S34. 3. Poser CM, Brinar VV. Diagnostic criteria
for multiple sclerosis: An historical review. Clin Neurol Neurosurg 2004;
106(3): 147-58.
MS and cerebral DVA
172 Iran J Neurol, Vol. 16, No. 4 (2017)
http://ijnl.tums.ac.ir 7 October
PA: Lippincott Williams & Wilkins;
2012. p. 170-93.
5. Larson TC 3rd. Cerebral aneurysms and
cerebrovascular malformations. In: Haaga JR, Editor. CT and MRI of the whole body. 5th ed. Philadelphia, PA:
Mosby/Elsevier; 2009. p. 229-94. 6. Grossman RI, McGowan JC. Perspectives
on multiple sclerosis. AJNR Am J Neuroradiol 1998; 19(7): 1251-65. 7. Karussis D. The diagnosis of multiple
sclerosis and the various related demyelinating syndromes: A critical review. J Autoimmun 2014; 48-49: 134-42.
8. Polman CH, Reingold SC, Banwell B, Clanet M, Cohen JA, Filippi M, et al. Diagnostic criteria for multiple sclerosis: 2010 revisions to the McDonald criteria. Ann Neurol 2011; 69(2): 292-302. 9. Lee C, Pennington MA, Kenney CM 3rd.
MR evaluation of developmental venous anomalies: Medullary venous anatomy of venous angiomas. AJNR Am J Neuroradiol 1996; 17(1): 61-70. 10. Wattjes MP, Steenwijk MD, Stangel M.
MRI in the diagnosis and monitoring of
multiple sclerosis: An update. Clin Neuroradiol 2015; 25(Suppl 2): 157-65. 11. Prenc LR, Telarovic S, Vidovic I, Sepcic
J. Concurrence of multiple sclerosis and vascular malformation of the brainstem: Case report. Neurol Croat 2012; 61(3-4): 63-6.
12. Zamboni P, Menegatti E, Bartolomei I, Galeotti R, Malagoni AM, Tacconi G, et al. Intracranial venous haemodynamics in multiple sclerosis. Curr Neurovasc Res 2007; 4(4): 252-8.
13. Bastianello S, Romani A, Viselner G, Tibaldi EC, Giugni E, Altieri M, et al. Chronic cerebrospinal venous insufficiency in multiple sclerosis: Clinical correlates from a multicentre study. BMC Neurol 2011; 11: 132. 14. Wattjes MP, van Oosten BW, de Graaf
WL, Seewann A, Bot JC, van den Berg R, et al. No association of abnormal cranial venous drainage with multiple sclerosis: A magnetic resonance venography and flow-quantification study. J Neurol Neurosurg Psychiatry 2011; 82(4): 429-35.
15. Topper R, Jurgens E, Reul J, Thron A. Clinical significance of intracranial
developmental venous anomalies. J Neurol Neurosurg Psychiatry 1999; 67(2): 234-8.
16. Wilms G, Demaerel P, Robberecht W, Plets C, Goffin J, Carton H, et al. Coincidence of developmental venous
anomalies and other brain lesions: A clinical study. Eur Radiol 1995; 5(5): 495-500.
17. Sundstrom P, Wahlin A, Ambarki K, Birgander R, Eklund A, Malm J. Venous and cerebrospinal fluid flow in multiple sclerosis: A case-control study. Ann Neurol 2010; 68(2): 255-9.
18. Zivadinov R, Cutter G, Marr K, Ramanathan M, Benedict RH, Bergsland N, et al. No association between conventional brain MR imaging and chronic cerebrospinal venous insufficiency in multiple sclerosis. AJNR Am J Neuroradiol 2012; 33(10): 1913-7. 19. Doepp F, Paul F, Valdueza JM,
Iranian Journal of Neurology © 2017 Corresponding Author: Maryam Akbarshahi
Email: [email protected] Email: [email protected]
Original Paper
Iran J Neurol 2017; 16(4): 173-7
Analysis of apolipoprotein E genetic
variation in patients with Alzheimer
disease referred to Imam Reza
Clinic, Rasht, Iran, in 2015
Amir Reza Ghayeghran1, Maryam Akbarshahi1, Zivar Salehi2, Ali Davoudi-Kiakalayeh3
1 Department of Neurology, School of Medicine, Guilan University of Medical Sciences, Rasht, Iran
2 Department of Biology, School of Sciences, University of Guilan, Rasht, Iran 3Road Trauma Research Center, Guilan University of Medical Sciences, Rasht, Iran
Keywords
Alzheimer Disease; Apolipoprotein E; Genetic Variation
Abstract
Background: Alzheimer disease (AD) is a progressive neurological degenerative disorder and the most common form of dementia. There are about 100 genes linked to AD including apolipoprotein E (ApoE). This gene exists in the form of three allele polymorphisms of ε2, ε3 and ε4 and six genotypes of ε2ε3, ε2ε2, ε3ε3, ε2ε4, ε3ε4, and ε4ε4. We aimed to study the association of ApoE polymorphism with AD in Guilan province, Iran.
Methods: The study group consisted of 70 AD
patients and 100 healthy individuals as a control group. All subjects were recruited from 21 March to 22 September 2015 at Imam Reza Clinic, Rasht, Iran. The genomic deoxyribonucleic acid (DNA) was extracted from peripheral blood leucocytes, and subsequently, subjects were genotyped for ApoE using tetra-primer amplification refractory mutation system-polymerase chain reaction (ARMS-PCR). The association between the risk allele and AD was
assessed using the MedCalc software.
Results: The distributions of ε3ε3, ε3ε4, ε2ε2, ε2ε4, ε4ε4 and ε2ε3 Genotypes among patients were 55.7%, 30.0%, 1.4%, 2.9%, 8.6%, 1.4% and in the controls were 79.0%, 8.0%, 0%, 1.0%, 1.0%, 11.0%, respectively. The genotype frequencies were significantly different between cases and the controls (P < 0.001). The individuals with the ε4ε4 and ε3ε4 genotypes had a greater risk for AD as compared to others; odds ratio (OR) = 12.15, 95% confidence interval (CI): 1.41-104.50, P = 0.020; OR = 5.32, 95% CI: 2.16-13.08, P = 0.003. In addition, the ε4 allele is significantly associated with higher AD risk among the studied population (OR = 5.63, 95% CI: 2.74-11.58, P < 0.001).
Conclusion: This case-control study suggests that the subjects with ε4ε4 and ε3ε4 genotypes had an increased risk for AD in Iranian population.
Introduction
Alzheimer Disease (AD) is a progressive neurological degenerative disease and the most common form of dementia. It accounts for 50%-60% of dementia cases and affects quality of
life in elderly people.1-3 According to the
Iranian Journal
of Neurology
Apolipoprotein E genetic variation in Alzheimer disease
174 Iran J Neurol, Vol. 16, No. 4 (2017)
http://ijnl.tums.ac.ir 7 October
Alzheimer’s Disease International, it is estimated
that there are currently 30 million people with dementia in the world which will increase to 100
million by 2050.4 It is also estimated that almost
13% of people over 65 years are affected, and its prevalence increases with age, so that 1% of people with 65 years old and younger, and 40% of persons aged over 90 years suffer from this
disease.5 Less than 1% of all patients with AD
experience early onset (before the age of 60-65
years) and 60% of the early AD is familial.6,7 It is
proved that no environmental factors (e.g. head injury, viruses, toxins, lower education level) have a direct role in the pathogenesis of AD. Therefore, it seems that AD late onset results from unknown environmental factors on a predisposed genetic
background.8,9
There are about 100 genes linked to AD including apolipoprotein E (ApoE), a risk factor
for AD that has attracted much attention.10,11
ApoE gene, located on chromosome 19, is the genetic source of the most common form of AD with late onset. This gene is in the form of three
alleles of ε2, ε3, and ε4, and six genotypes of ε2ε3,
ε2ε2, ε3ε3, ε2ε4, ε3ε4, and ε4ε4.12 ApoE protein is
expressed by all tissues, and is effective in the regulation of cell function of different tissues and
organs in addition to lipid transfer.13 Human and
animal studies clearly have shown that ApoE isoforms differentially affect the assembly and
clean-up of β-amyloid. Evidence from genetic,
pathologic and functional studies has shown that
the imbalanced production and clearance of β
-amyloid peptide in the brain leads to its accumulation, and eventually nerve degeneration
and dementia.2,6 Many studies on genome have
confirmed that ε4 allele of ApoE gene is the
strongest genetic risk factor for AD. This allele is associated with an increased risk of both early
and late AD. β-amyloid deposits in the form of
senile plaques in ApoE ε4 carriers as compared to
non-carriers.14 Therefore, ApoE genotypes
strongly influence β-amyloid deposits in the form
of senile plaques and lead to cerebral amyloid
angiopathy.15 Clinical autopsy-based
meta-analysis studies have shown that the risk of AD in
individuals with one copy of ε4 allele (ε3ε4, ε2ε4) or
two copies (ε4ε4) was higher among whites as
compared to patients with genotype ε3ε3.16
Although ε3 allele is the most common one,
various studies have shown that ε4 allele in people
with late family history and sporadic AD, in comparison with control group, has a higher
frequency. ε3 allele has a moderate effect, and its
impact on the disease pathology is a basic
comparison for ε4 and ε2 isoforms due to a very
high frequency. ε2 allele of the ApoE gene has a
lower frequency and possesses protective effects
against AD.12
In the view of the above-mentioned facts, the purpose of conducting this case-control study is to evaluate the association of ApoE polymorphism with the susceptibility to AD in Iranian population.
Materials and Methods
The case-control study was conducted on 70 cases and 100 healthy controls. A questionnaire including information such as age, sex, family history of AD, and the race was used. All subjects were native Iranian living in the north of Iran, Guilan province. Patients’ mean age ± standard deviation (SD) was 77.1 ± 9.4, ranging from 65 to 89 years. Patients, diagnosed with AD, were recruited from 21 March to 22 September 2015, at Imam Reza Clinic of Guilan, Rasht. Identification and diagnosis of AD were performed based on National Institute of Neurological Disorders and Stroke-Alzheimer's Disease and Related Disorders Association (NINCDS-ADRDA) criteria. Patients diagnosed with Parkinson's disease or Parkinsonism at any time before the onset of dementia, patients with a history of stroke, history of alcohol abuse, or conclusive clinical history of schizophrenia or schizoaffective disorder before dementia onset were excluded from the study. Controls with the mean age of 74.7 ± 10.3 years (ranging from 65 to 87 years) were nonrelated and healthy individuals. Cases and controls were matched for age, and there were no significant differences between two groups (case and control) in terms of sex, race and family history of AD (P > 0.050). The characteristics of the cases and controls are shown in table 1. Informed consent for the genetic analysis was obtained from all participants. The study was conducted in accordance with the Declaration of Helsinki regarding the use of human samples.
A.R. Ghayeghran, et al.
Iran J Neurol, Vol. 16, No. 4 (2017) 175 Table 1. Characteristics of cases and controls
Characteristics Case (n = 70) Control (n = 100) P*
Sex [n (%)] Man 32 (45.7) 47 (47.0) 0.990
Woman 38 (54.3) 53 (53.0)
Family history of AD [n (%)] Yes 19 (27.1) 23 (23.0) 0.660
No 51 (72.9) 77 (77.0)
Race [n (%)] Gilak 51 (72.9) 74 (74.0) 0.810
Talesh 9 (12.8) 14 (14.0)
Turk 6 (8.6) 5 (5.0)
Tat 4 (5.7) 7 (7.0)
*Chi-square test
AD: Alzheimer disease
Genomic DNA quality was assessed by electrophoresis with 1% agarose gel. The gel was visualized by the gel documentation system.
The ApoE genotypes were determined by tetra-primer amplification-refractory mutation system-polymerase chain reaction (ARMS-PCR). The extracted DNA was used as a template for PCR. Amplifications were carried out using primers designed by Oligo software (version 7.54, Molecular Biology Insights Inc., Cascade, CO, USA). The reaction was performed for all samples after optimization of PCR conditions for amplification of the desired allele. PCR amplifications were carried out in a total volume of 25 µl containing 30 ng genomic DNA, 1x PCR
buffer, 1.5 mM MgCl2, 0.2 mM deoxynucleotide
triphosphate (dNTP), 0.5 mM each primer, and 1.5 U of superTaq DNA polymerase. At the end, PCR products were analyzed by agarose gel electrophoresis, and alleles and genotypes were identified based on the length of the used fragments and primers.
The statistical significance of differences between groups was calculated by the chi-square test. A P of less than 0.050 was considered statistically significant. The odds ratios (OR) and
95% confidence intervals (95% CI) were calculated
using logistic regression to estimate the strength of the association between ApoE genetic variation and susceptibility to AD. All statistical analyses were conducted using the MedCalc software (version 12.1).
Results
This case-control study included 70 patients with AD and 100 healthy controls. The distributions of
ε3ε3, ε3ε4, ε2ε2, ε2ε4, ε4ε4 and ε2ε3 genotypes among
patients were 55.7%, 30.0%, 1.4%, 2.9%, 8.6%, 1.4%, and in the controls were 79.0%, 8.0%, 0%, 1.0%, 1.0%, 11.0%, respectively. The genotype frequencies were significantly different between cases and the controls (P < 0.001). It was observed
that the individuals with ε4ε4 and ε3ε4 genotypes
had a greater risk of AD compared to others (OR = 12.15, 95% CI: 1.41-104.50, P = 0.020; OR = 5.32, 95% CI: 2.16-13.08, P = 0.003). The allele
frequencies of ApoE were 71.4% ε3, 3.6% ε2 and
25.0% ε4 in the AD cases and 88.5% ε3, 6.0% ε2 and
5.5% ε4 in the controls. We observed a significant
difference in allele distribution of ApoE between AD patients and the controls (P < 0.001). In
addition, the ε4 allele is significantly associated
with higher AD risk among the studied population (OR = 5.63, 95% CI: 2.74-11.58, P < 0.001) (Table 2).
Table 2. Genotype and allele frequencies of apolipoprotein E (ApoE) and its association with Alzheimer disease (AD)
Genotype Case [n (%)] Control [n (%)] OR (95% CI) P*
ε3ε3 39 (55.7) 79 (79.0) 1.00 (Ref) -
ε4ε4 6 (8.6) 1 (1.0) 12.15 (1.41-104.50) 0.020
ε3ε4 21 (30.0) 8 (8.0) 5.32 (2.16-13.08) 0.003
ε2ε2 1 (1.4) 0 (0) 6.04 (0.24-151.62) 0.270
ε2ε4 2 (2.9) 1 (1.0) 4.05 (0.36-46.06) 0.260
ε2ε3 1 (1.4) 11 (11.0) 0.18 (0.02-1.48) 0.110
Allele
ε3 100 (71.4) 177 (88.5) 1.00 (Ref) -
ε2 5 (3.6) 12 (6.0) 0.74 (0.25-2.15) 0.580
ε4 35 (25.0) 11 (5.5) 5.63 (2.74-11.58) < 0.001
*Chi-square test
Apolipoprotein E genetic variation in Alzheimer disease
176 Iran J Neurol, Vol. 16, No. 4 (2017)
http://ijnl.tums.ac.ir 7 October
Discussion
Studies in human and transgenic mice have
shown that brain β-amyloid levels and amyloid
plaque loads are ApoE isoform-dependent, suggesting an important role of ApoE in
modulating β-amyloid metabolism, aggregation,
and deposition.17 ApoE gene, known to mediate
the regulation of cholesterol and triglyceride metabolism, is immunochemically localized to the senile plaques, vascular amyloid, and
neurofibrillary tangles of AD.18 Genome-wide
association studies confirmed that ε4 allele of
APOE is the strongest genetic risk factor for AD.19
To date, no study has investigated the association between the genotypes of ApoE and the AD risk in the Guilan province. The present study evaluated the effect of ApoE variation on AD in the north of Iran, Guilan. Our findings suggest
that individuals with ε4ε4 genotype have the
highest risks of developing AD. Moreover, the
most frequent genotype was ε3ε3 in patients and
controls in Guilan. Our analysis also confirmed a
significant association of the ε4 allele with AD.
To date, many epidemiological studies have suggested a relationship between ApoE genetic variations and AD risk. In 2013, Sabbagh, et al. in
their study showed that ApoE ε4 carriers had a
significantly higher percentage of frequentscores for plaques and tangles in comparison with ApoE
ε4 non-carriers for several brain regions.12
Furthermore, Altmann, et al. showed that APOE
ε4 confers greater AD risk in women.20 Isbir, et al.
in Turkey showed that there was a significantly
higher frequency of the ApoE ε4 allele in the
group of Alzheimer’s patients than in control
subjects.21 In China, Zhou, et al. studied the
relationship between ApoE gene polymorphism and AD in the case group and control group in Uyghurs and Han populations. The distinction was seen in both ethnic groups so that the
frequency of ε3ε4 genotype and ε4 allele in case
group of Uyghurs and Han were higher than
those in the control group. ApoE ε4 allele was
recognized as a risk factor for AD for both
populations.22
Another study conducted by Gavett, et al.
showed that more ε2 alleles were associated with
less AD pathology and, in turn, with less severe
dementia. In contrast, more ε4 alleles were
associated with more pathology and more severe
dementia.23 Mino, et al. showed that there was no
statistically significant relationship between case
group (with AD and dementia) and control group (without AD and dementia) in terms of sex and
family history and distribution of ApoE alleles.24
A study conducted in 2014 reported that there is a statistically significant relationship between the types of ApoE and patients’ age so that risk
alleles, such as ε4, decrease the age of onset as
3-6 months.5
ApoE ε4 allele frequency varies in different
ethnic groups, and the mean has been estimated as 6.5 ± 13% in all groups. It has been reported that the lowest frequency was observed among Chinese and Japanese people (7.4 ± 0.8%), and the highest frequency was found among Sudanese
(29%),21 and Finnish people (23-24%).25 Shahsavar,
et al. also found that ε3ε3 genotype with a
frequency of 48% was the most common genotype
in their study population.13
Our study includes a small sample size, and
statistically significant results may occur by
chance. It is also unwise to ignore other factors like environment and hereditary conditions that may predispose a person to AD, as there are other genes that may affect the susceptibility to AD. Thus, it will be necessary to assess the relationship between the genetic and environmental factors that influence the risks of AD in other studies.
Conclusion
In conclusion, the results of this study provide
further evidence that ε4 increases the risk of AD.
However, a larger study that includes more samples may be necessary to confirm the findings.
Conflict of Interests
The authors declare no conflict of interest in this study.
Acknowledgments
This research was supported by Guilan University of Medical Sciences, Rasht, Iran. We would like to thank all the volunteers who took part in this study.

![Table 2. Genotype and allele frequencies of apolipoprotein E (ApoE) and its association with Alzheimer disease (AD) Genotype Case [n (%)] Control [n (%)] OR (95% CI) P*](https://thumb-us.123doks.com/thumbv2/123dok_us/8750129.1748337/18.595.71.527.97.202/genotype-frequencies-apolipoprotein-association-alzheimer-disease-genotype-control.webp)