T
T
h
h
e
e
r
r
a
a
n
n
o
o
s
s
t
t
i
i
c
c
s
s
2012; 2(7):631-654. doi: 10.7150/thno.4308Review
Quantum Dot Enabled Molecular Sensing and Diagnostics
Yi Zhang
1and Tza-Huei Wang
2 1. Department of Biomedical Engineering, Johns Hopkins University School of Medicine, Baltimore, MD 21205, USA. 2. Department of Biomedical Engineering, Department of Mechanical Engineering, Sidney Kimmel Comprehensive Cancer
Center, Center of Cancer Nanotechnology Excellence, Johns Hopkins University, Baltimore, MD 21205, USA.
Corresponding author: Dr. Tza-Huei Wang. Address: 3400 North Charles Street, Latrobe 108, Baltimore, MD 21218. Tel: 410-516-7086. Email: [email protected].
© Ivyspring International Publisher. This is an open-access article distributed under the terms of the Creative Commons License (http://creativecommons.org/ licenses/by-nc-nd/3.0/). Reproduction is permitted for personal, noncommercial use, provided that the article is in whole, unmodified, and properly cited.
Received: 2012.03.01; Accepted: 2012.03.31; Published: 2012.07.04
Abstract
Since its emergence, semiconductor nanoparticles known as quantum dots (QDs) have drawn considerable attention and have quickly extended their applicability to numerous fields within the life sciences. This is largely due to their unique optical properties such as high brightness and narrow emission band as well as other advantages over traditional organic fluorophores. New molecular sensing strategies based on QDs have been developed in pursuit of high sensitivity, high throughput, and multiplexing capabilities. For traditional biological applica-tions, QDs have already begun to replace traditional organic fluorophores to serve as simple fluorescent reporters in immunoassays, microarrays, fluorescent imaging applications, and other assay platforms. In addition, smarter, more advanced QD probes such as quantum dot fluorescence resonance energy transfer (QD-FRET) sensors, quenching sensors, and bar-coding systems are paving the way for highly-sensitive genetic and epigenetic detection of diseases, multiplexed identification of infectious pathogens, and tracking of intracellular drug and gene delivery. When combined with microfluidics and confocal fluorescence spectros-copy, the detection limit is further enhanced to single molecule level. Recently, investigations have revealed that QDs participate in series of new phenomena and exhibit interesting non-photoluminescent properties. Some of these new findings are now being incorporated into novel assays for gene copy number variation (CNV) studies and DNA methylation analysis with improved quantification resolution. Herein, we provide a comprehensive review on the latest developments of QD based molecular diagnostic platforms in which QD plays a versatile and essential role.
Key words: Quantum Dot, Diagnostics, Sensing, Nanosensor, Nanoassembly.
INTRODUCTION
One of the main goals in the rapidly growing field of nanotechnology is to develop novel nanoscale functional materials that uniquely differ in their physical and chemical properties as compared to bulk counterparts. Originally created with the motivation to investigate materials’ behavior at molecular level [1], nanocrystals were soon born and have since trig-gered great interest. Semiconductor nanocrystals, or
quantum dots (QDs), are among the most exciting and ubiquitous discoveries that have come out of the nanotechnology field. A QD is a cluster of a few hun-dred to thousands of atoms [2] arranged in binary (e.g.
CdSe, CdTe, GaAs, InAs, AlN, SiC and etc.) or ternary compounds (e.g. InGaN, InGaP, InGaAs and etc.). The size of a QD typically ranges from 1 to 20 nm [2]. At such small scales, QDs exhibit a molecule-like
behav-Ivyspring
ior by interacting with light through electronic transi-tion dipoles [1]. Upon excitatransi-tion by a photon, a single electron is promoted from the valence band to the conduction band, creating an electron-hole pair (i.e.
exciton). As the size of QDs become relatively small as compared to the bulk exciton Bohr radius, which is typically a few nanometer (~5.6 nm for CdSe) [1], the wave function of the exciton is confined in all three spatial dimensions at the QD boundary, thereby leading to a quantized energy level. The shift in en-ergy level, otherwise described as an increase in the QD band gap, increases as the QD size decreases [3-5]. Such strong size dependencies facilitate the ability to fine tune the QD emission wavelength over almost the entire visible spectrum [1]. This amazing attribute of QDs make them ideal substitutes for conventional organic fluorophores [6]. The pros and cons of the QDs compared to the traditional fluorophore s are discussed in details in Ref. [6].
Since the first demonstration of QDs as a fluo-rescent label in biological systems [7, 8], there has been a trend of integrating functional nanomaterials in variety of biomolecular assays. Modern molecular biology techniques lay the foundation for molecular diagnostics which play an essential role in modern medicine [9]. Molecular diagnostics heavily rely on the measurements of physical and chemical parame-ters of clinical samples. This ultimately requires de-tailed inspections of biomolecules as well as their in-teractions with other molecules and the environment [9]. Fluorescence based methods suit the aforemen-tioned goals perfectly by providing sensitive, repro-ducible, and quantitative detection of target mole-cules [6, 10-12].
QDs are able to improve the performance of fluoroassays by offering a number of benefits over traditional organic fluorophores, such as high brightness, longer fluorescence lifetime, better photo-stability, as well as narrow and symmetric emission spectrum. The excitation spectrum of QDs extends far into the UV region and hence multiple QDs can be excited with a single light source. As a result, up to 6 QD emission spectra can be combined without sig-nificant spectral crosstalk, which offers an unprece-dented degree of multiplexing [13]. Also, the excep-tional fluorescent properties of QDs make them an exceptional fluorescence resonance energy transfer (FRET) donor because of the avoidance of acceptor spectral bleed-through [14]. This is due to the fact that the excitation sources of QDs are far apart from the excitation spectrums of FRET acceptors, thereby avoiding direct excitation of the acceptor. Further-more, narrow and symmetric emission spectra of QDs ensure high degree of FRET donor-acceptor spectral
overlap and high FRET efficiencies, meanwhile avoiding donor spectral bleed-though caused by the asymmetric tailing of donor emission spectrum, which often occurs with organic fluorophores [6]. In addition, QDs can also be designed to function as a nanoscaffold, offering a large surface area as solid substrate for molecule adsorption. Consequently, multiple acceptors can be conjugated to a single QD. This increased acceptor to donor ratio gives rise to higher FRET efficiencies and detection sensitivities. The evergrowing interest in QDs also prompts studies on their non-photoluminescence properties, such as electrohydrodynamic [15], electrochemical [16, 17], and photoelectrical [18-20] properties. These new phenomena are carefully investigated and adapted to new molecular assays.
This review comments on the latest development of QD based sensing strategies and their applications towards molecular diagnostics. We begin with a brief discussion on the use of a QD as a "passive" fluores-cent tag that replaces traditional organic fluorophores in many conventional assays. Then we focus on "smart" QD probes, such as quantum dot fluorescence resonance energy transfer (QD-FRET) sensing system, QD electron transfer sensing system, QD photochem-ical sensing system QD single molecule detection (SMD) platform and QD barcode that are designed to achieve high-sensitivity, high-throughput and multi-plexed detection. Other non-photoluminescence properties of QDs are also examined for their appli-cations in unconventional molecular assays. In sum-mary, we provide a detailed evaluation of QD as a versatile participant in various types of molecular sensing platforms.
QD ASSEMBLY AND
FUNCTIONALIZATION
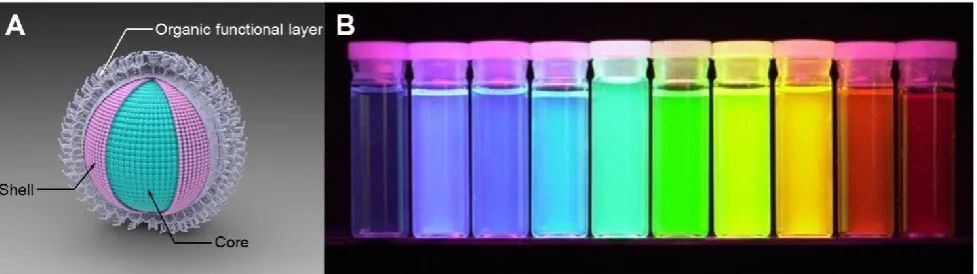
preventing core materials such as Cd and Se from leaching out, thus reducing cytotoxicity [25]. There-fore, to make QDs suitable for biological applications, which are typically in an aqueous environment, the surface of QDs needs to be rendered hydrophilic with an additional organic capping layer with exposed reactive groups for bioconjugation (Fig. 1). (Methods for QD surface modification are reviewed extensively in Refs. [26-29]).
To participate in molecular sensing, simple yet robust conjugation schemes are required to link de-sired probes to QDs. The organic capping layer on a QD surface possesses reactive groups, allowing direct conjugation of target molecules through covalent linkage using variety of chemistries (See Refs. [26-29]
for detailed review). A popular approach uses bio-tin-avidin (including neutravidin and streptavidin) interaction as a universal linkage that connects de-sired probes to the QD [30]. Avidins or biotins are covalently attached to QD surface while probes such as oligonucleotides, antibodies, or aptamers are con-nected to the conjugate. The high affinity of bio-tin-avidin interaction ensures strong linkage between the QD and probes, providing a rapid and strong conjugation. Another widely used tactic is to tag the desired molecule with a polyhistidine peptide by co-expression [31] or chemical ligation [32-34]. Con-jugation is realized through self- assembly of the polyhistidine tag on the zinc-rich QD surface via met-al-affinity coordination [31-35].
Figure 1: A) Schematic illustration of QD structure. B) QDs display distinctive colors under UV excitation. Figure 1b is adapted with permission from [36], copyright 2001 Nature Publishing Group.
QD AS A PASSIVE FLUORESCENT
LABEL
Early QD applications within biological contexts centered on incorporating QDs into traditional bioan-alytical assays as superior substitutes for organic fluorophores. This was done in the hopes that the unique optical properties of QDs such as high brightness and excellent photostability could greatly improve assay performance.
Immunoassay
Chan et al. first demonstrated QDs as fluorescent reporters in an immunoassay [8]. QDs that were con-jugated to immunoglobin G (IgG) showed extensive aggregation in the presence of a specific polyclonal antibody that recognized the Fab fragment of the immunoglobin. In contrast, QD-IgG sensors incubat-ed with bovine serum albumin (BSA) as the negative controls were well dispersed with no signs of aggre-gation. Later, similar approaches were applied to de-tect various other protein targets. Geho et al. used
deconvolution algorithm was implemented to better determine the concentration of each species. This process assumed that the composite spectrum was a superposition of individual QD spectrum. Hu et al.
applied the QD-based immunoassay to detect cancer biomarkers from human serum samples on a micro-fluidic protein array with an estimated detection limit of 250 fM [39]. QDs have also improved the sensitivity of Western blot analysis [40-42]. Ornaberg et al. man-aged to detect 20 pg of p42 mitogen-activated phos-phokinase (p42 MAPK) protein within a Western blot using QD conjugated antibodies [42] and demon-strated excellent quantification capabilities. Shin et al.
replaced QD conjugated antibodies with QD func-tionalized RNA aptamers to detect His-tagged re-combinant proteins using Western blot [43].
Nucleic Acids Detection
QDs have also been effectively conjugated to ol-igonucleotides to serve as fluorescent probes for tar-get specific nucleic acid detection. Gerion et al. suc-cessfully identified single nucleotide polymorphism (SNP) and single base deletion of tumor suppressor gene P53 on a cDNA microarray with QDs conjugated DNA oligonucleotides as hybridization probes [44]. Both hybridization and detection took place at room temperature with the signal-to-noise ratio above 10. On the same platform, the authors also demonstrated multiplexed detection of hepatitis B and C viruses using DNA probes labeled with two different QDs. In another novel application, Karlin-Neumann et al.
combined molecular-inversion probes (MIP) [45, 46], a GeneChip® universal tag array, and QDs to genotype
more than 10,000 SNPs in a single reaction [46]. MIPs with SNP recognition sequences at both termini were hybridized to target genomic DNA, forming an open circular structure adjacent to the SNP site. The gapped MIP was filled upon addition of nucleotides com-plementary to the SNP. The probe was then circular-ized by a ligation reaction, which provided allelic identification. Each MIP contained a unique tag se-quence that hybridized to a specific location on the universal tag array. Four types of QDs were func-tionalized so that each QD only bound specifically to one deoxynucleotide incorporated in the SNP sites (i.e. either A, C, G or T). QDs have served as excellent alternatives to organic dyes in SNP microarray ap-plications due to their high accuracy and improved signal-to-noise ratio. Other groups further enhanced the signal-to-noise ratio of DNA microarrays through surface plasma enhanced QD emission [47, 48].
Imaging
Great effort has been put into adapting QDs as
novel fluorescent tags to imaging applications. Many labeling techniques, whether specific or nonspecific, have been extensively investigated. Detailed reviews on topics regarding QD-based imaging applications can be found in Refs. [26-29].
QD "SMART PROBES"
As a luminescent probe, QDs outperform tradi-tional organic fluorophores in many aspects due to their excellent optical properties. In addition, a QD can act as a nanoscaffold, thereby providing a struc-tural platform and functional solid substrate for mol-ecule adsorption and interaction. Recently, QDs have been used as active components of complex biosens-ing platforms which often rely on nonradiative energy transfer between a QD and other organic fluorophores or nanoparticles. Many of these QD-based nano-biosensing techniques enable homogeneous and wash-free assays, thereby eliminating stringent washing steps to greatly simplify assay protocols.
Quantum Dot Mediated Fluorescence
Reso-nance Energy Transfer
Fluorescence resonance energy transfer (FRET) is an energy transfer process via dipole-dipole interac-tions between a fluorescent donor-acceptor pair. FRET is highly dependent on the distance between the ac-ceptor and donor fluorophores. Only when the donor and acceptor molecules are in very close proximity, is there efficient energy transfer from donor to acceptor (Equation 1). As a result of this spatial relationship, FRET is an invaluable tool for studying molecular interactions.
….(1)
where E is the FRET efficiency that depends on the donor-acceptor separation distance r and the Förster distance R0 .
QDs have highly advantageous properties that make them excellent FRET donors as compared to organic fluorophores. Great effort has been put into understanding the basic physical properties of QD-FRET [27, 49, 50]. To ensure high FRET efficiency, a FRET pair is selected to ensure maximum spectral overlap between the donor emission spectrum and the acceptor excitation spectrum. Due to the small Stokes shift of most organic fluorophores, excitation sources often directly excite acceptors to certain ex-tent. Moreover, the emission spectra of traditional organic donors are usually asymmetric, tailing into the long wavelength spectrum. This usually coincides with the acceptor emission spectrum, causing donor
6 0 6
6 0
R
r
R
E
bleed-through. In both cases, undesired signals in the acceptor channel increase the background noise and impair the sensitivity of FRET-based molecular sens-ing. In contrast, QDs have large "effective" Strokes shift and hence can be excited with a short-wavelength light source. These light sources, which are usually placed in the UV region, are far away from acceptor emission spectrum, thereby sig-nificantly minimizing direct acceptor excitation. Ad-ditionally, because the emission spectrum of QD is narrow and symmetric, it can be placed close to the acceptor excitation spectrum to ensure maximum spectral overlap meanwhile minimizing donor spec-tral bleed-through. On one hand, compared to FRET between two organic fluorophores, the FRET effi-ciency between the QD and the organic fluorophore is relatively low in a single-donor-single-acceptor con-struct due to the large size of the QDs which increases the distance between the donor and the acceptor [51]. On the other hand, QDs offer large surface area for molecular adsorption, allowing multiple acceptors to concentrate on their surface. The increased acceptor to donor ratio significantly enhances the FRET efficien-cy.
Detection of Specific Targets
A wide variety of applications have been derived based on QD-FRET. One major area of interest is im-plementing QD-FRET for genetic and epigenetic analysis. Zhang et al. designed a QD-FRET sensor for sequence-specific DNA detection [52]. Probes labeled with biotin and Cy5 were allowed to hybridize to a DNA target, forming a sandwich hybrid (Fig. 2A) that self assembled on the QD via biotstreptavidin in-teractions. The self-assembled nanosensor detected the presence of targets through FRET signals, which was indicated by a combination of fluorescent signals from both the QD and Cy5 channels. In the absence of targets, only signals from the QD channel were de-tected (Fig. 2B). By incorporating DNA ligation, the QD nanosensor was later applied to detect a KRAS
point mutation. Two probes labeled with biotin and Cy5 were designed to hybridize adjacent to the muta-tion site. The 3' terminal of the Cy5-labeled reporter probe included a discrimination site that recognized the mutation. The ligation reaction joined the fully matched probes into a single DNA strand with dual labels. QDs were then introduced to detect the ligated DNA strands through QD-FRET. The nanosensor successfully identified mutations in samples from patients with ovarian serous borderline tumors (SBTs). The performance outmatched those from mo-lecular beacon probes (Fig. 2C). Bailey et al. developed a QD-FRET based methylation analysis named
within the optical fiber. The optical fiber based solid phase QD-FRET platform demonstrated multiplexing capability using a single-donor/multi-acceptor
scheme or multi-donor/multi-acceptor scheme [63] for SNP screening [62].
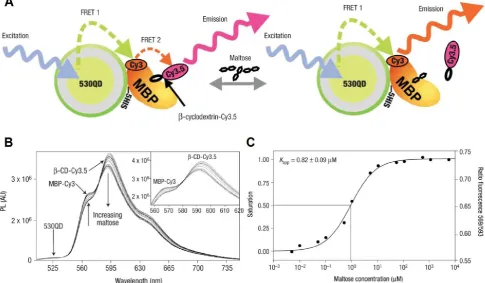
Figure 3: QD-FRET for maltose detection. A) Schematic of a 530QD-MBP-Cy3-β-CD-Cy3.5 maltose sensor assembly. A 530-nm QD is surrounded by ~10 MBPs (only one shown for clarity), each monolabeled with Cy3 at cysteine 95 (maximum absorption ~556 nm, maximum emission ~570 nm). Specifically bound β-CD-Cy3.5 (maximum absorption ~575 nm, maximum emission ~595 nm) completes the QD-10MBP-Cy3-β-CD-Cy3.5 sensor complex. Excitation of the QD results in FRET excitation of the MBP-Cy3, which in turn FRET excites the β-CD-Cy3.5. Added maltose displaces β-CD-Cy3.5 leading to increased Cy3 emission. B) Maltose sensing of 530QD-MBP-Cy3-β-CD-Cy3.5. (Inset) Close-up of the MBP-Cy3 and β-CD-Cy3.5 fluorescence portions. Note the isosbestic point at ~581 nm. A shift of ~4nm in β-CD-Cy3.5 maximum emission was observed for the MBP-Cy3-bound form attributable to bound dye rigidity and inner filtering.C) Transformation of titration data. The left axis shows fractional saturation and the right axis shows the ratio of PL at 593 nm/569 nm. Assuming the range of useful measurement to be between 10 and 90% saturation, this translates into a sensing range of ~100 nm to 10 μM maltose. Reprinted with permission from [65], copyright 2003 Nature Publishing Group.
QD-FRET has also been applied to detect other specific targets. A two-step QD-FRET maltose sensor based on competitive ligand binding was reported by Medintz et al [65]. Cy3 labeled maltose binding pro-tein (MBP) adsorbed to a QD surface through pol-yhistidine tag (Fig. 3A). A maltose competitor β-cyclodextrin (β-CD), which competed with maltose for the same saccharide binding pocket on MBP, was labeled with Cy3.5. In the absence of maltose, Cy3.5-β-CD bound to QD530-MBP-Cy3 and formed a complex. Excitation of QD530 activated Cy3 which functioned as a relay that in turn transferred energy to Cy3.5. In the presence of maltose, the binding of un-labeled maltose displaced Cy3.5-β-CD, breaking the second FRET chain and leading to the increase in Cy3 intensity accompanied by decreased Cy3.5 emission (Fig. 3B). Binding constant determined using two-step FRET agreed with previous results (Fig. 3C). A similar
QD-FRET competitive assay was developed to detect 2,4,6-trinitrotoluene (TNT) in an aqueous environ-ment [66]. Anti-TNT specific antibody fragenviron-ments were immobilized on a QD surface via a polyhistidine tag. The TNT concentration was determined by observing the change in QD photoluminescence caused by FRET, which depended on the competition between TNT and a dye-labeled TNT analogue. Willard et al.
de-pendent, was covalently linked to QDs. At pH of 6, squaraine, which has a large absorption coefficient, exhibited high emission through QD-FRET. As the pH was increased to 10, the absorption coefficient of squaraine significantly dropped and the emission peak was no longer visible. Suzuki et al. presented a similar QD-FRET sensor using fluorescein as a pH dependent acceptor [68]. Prasuhn et al. built a calcium sensor based on QD-FRET [69]. A special dye called
CaRbCl was conjugated to a peptide immobilized on a QD surface. Pendent carboxyl groups of CaRbCl in-teracted with Ca2+ and significantly changed the
quantum yield of the dye, altering the QD-FRET effi-ciency. Although the sensor was designed for Ca2+
sensing, it was able to detect other divalent and monovalent ions, though with different responsive-ness.
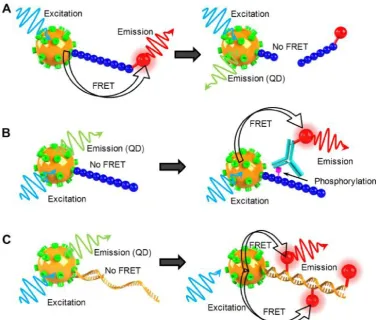
Figure 4: Schematic illustration of QD-FRET nanosensor for analysis of enzyme activity. a) QD-FRET sensor for the study of protease. b) QD-FRET sensor for the study of protein kinase. c) QD-FRET sensor for the study of DNA polymerase.
Examine Enzyme Activity
FRET has long been an indispensable tool for probing molecular interactions. Lately, there has been a trend of utilizing QD-FRET to monitor various en-zymatic activities. QDs can serve as nanoscaffolds to immobilize enzymes or the substrates of enzymes on the QD surface. Meanwhile, the QD also functions as signal transducer that reports information regarding molecular structure, conformation, and interaction through the QD-FRET mechanism.
Proteases were one of the earliest enzymes studied by QD-FRET nanosensors. Medintz et al.
im-mobilized fluorophores or quencher labeled peptides on QDs via polyhistidine tags to form QD-peptide nanosensors [34]. The photoluminescence of these QD nanosensors were quenched by the proximal FRET acceptor via a peptide linker that contained sequences recognizable by caspase-1, collagenase, or chymo-trypsin. Upon recognition by the corresponding en-zyme, the substrate peptide was specifically cleaved to release the acceptor fluorophore from the QD-peptide nanoassembly, leading to the recovery of QD photoluminescence (Fig. 4A). The Michaelis con-stant Kd and maximum reaction rate Vmax were
agreed reasonably well with previously reported values. The authors also examined inhibitor effects on proteolytic activities. Either thrombin alone or to-gether with a thrombin inhibitor was added to the peptide conjugated QD-FRET sensor. The inhibitor decreased the activity of thrombin by covalently and irreversibly modifying thrombin’s active site. The inhibitory mechanism was experimentally confirmed by the Lineweaver-Burk graph as the plots for both cases shared the same Km but different Vmax. Sapsford
et al. monitored botulinum neurotoxin (BoNTs) activ-ity using a similar QD-FRET sensing system [70]. BoNT serotype A light chain (LcA) cleaves specific regions of synaptosomal-associated protein 25, which leads to neuroparalysis. The peptide substrate of BoNT was labeled with Cy3 and conjugated to QDs. A caspase 3 QD-FRET sensing system was constructed by tagging the peptide substrate with Texas red and covalently conjugating it to QDs [69]. Instead of using organic fluorophores as FRET acceptors, Boeneman et al. coexpressed a fluorescent protein mCherry with the peptide substrate for caspase 3 sensing [31]. Su-zuki et al. prepared a recombinant GFP mutant con-taining a trypsin recognition sequence for the study of trypsin activity using QD-FRET [68], which led to an interesting observation. Rather than changing the QD photoluminescence, cleavage by trypsin shifted the entire emission spectrum.
Protein kinases are a group of enzymes that reg-ulates vital cell functions through phosphorylation events by activating or deactivating a wide range of downstream enzymes. Using a QD-FRET sensing system, Ghadiali et al. studied the activity of nonre-ceptor tyrosine kinases Abl and Src [71]. Peptide sub-strates were immobilized on QD surfaces. After phosphorylation, an Alexa647 labeled phosphotyro-sine specific monoclonal antibody was introduced to tag the phosphoryl group with FRET acceptors (Fig 4B). The degree of phosphorylation was determined by the ratio of acceptor/donor emission intensities. The same system was also used to quantitatively measure enzyme inhibitor potency through stauro-sporine titration in order to to evaluate the potential of a QD-FRET kinase sensing system as a drug-screening platform.
Another group of enzymes of great interest are those that interact and modify nucleic acids such as DNA and RNA. These incredibly important enzymes have formed the basis of modern molecular biology. A number of recent studies exploited the advantages of QD-FRET nanosensors to investigate the activities of DNA modification enzymes. Huang et al. devel-oped a staphylococcus aureus sensor by detecting the micrococcal nuclease (MNase) biomarker using
QD-FRET [72]. ROX labeled single stranded DNA (ssDNA) were conjugated to QDs through bio-tin-streptavidin interaction, forming a QD-ssDNA sensor. MNase could then cleave the surface immobi-lized ssDNA, setting the ROX dye free and breaking the FRET pairing. As a result, the presence of MNase was indicated by the decreased emission of ROX ac-companied by the recovery of QD emission. The ssDNA-QD-FRET sensor was applied to monitor MNase concentrations in staphylococcus aureus cell cultures. The QD-FRET results matched the expected concentrations at various growth phases of the bacte-rial cultures. Suzuki et al. reported a DNase QD-FRET sensor constructed in a similar fashion by conjugating dye labeled double stranded DNA (dsDNA) to QDs [68].
Apart from "cleavage-based" enzymes, other families of enzymes involve reactions that add func-tional groups or monomers to existing nucleic acid templates. They are important for DNA replication, repair, transcription or signal transduction. The "ad-dition reactions" facilitate the incorporation of fluor-ophores to target molecules, enabling a variety of fluorescence detection schemes. For example, Suzuki
et al. employed QD-FRET to study polymerase activity [68]. A biotin labeled template was generated by asymmetric PCR and pre-annealed to primers before assembling onto QD surfaces (Fig. 4C). The primer was elongated with Klenow fragments in the presence of 4 normal dNTPs with additional Alexa532 labeled dUTPs. Alexa532 was incorporated into the DNA-QD nanoassembly through polymerization, and QD-FRET signals were used as a measure of polymerase activi-ty. Patolsky et al. performed the same study using a similar QD-FRET sensor [73]. A surface immobilized thiolated primer was used to capture and amplify M13Φ bacteriophage DNA. Once again, QD-FRET was monitored over the course of 2 hrs. As the reac-tion proceeded, the QD emission was gradually quenched with a steady increase of Texas Red emis-sion. The same group also monitored telomerase ac-tivity using a similar sensor design [73]. Template DNA was directly conjugated to QDs. The telomeri-zation reaction incorporated Texas Red labeled dUTP and activated energy transfer. FRET efficiency was discovered to increase with time as the reaction pro-ceeded. The authors demonstrated the time depend-ence of QD-FRET in enzymatic reactions, suggesting great potential for QD-FRET nanosensors as real-time fluorescent reporters.
Tracking intracellular gene delivery
into the cytoplasm or designated intracellular com-partments. Cellular uptake of exogenous substances is accomplished through a series of internal mecha-nisms. In particular, foreign DNA is not efficiently transported across the cell membrane. As a result, genes are often packaged in "vectors" to increase their delivery efficiency. Non-viral vectors bundle DNA into polymeric nanoscaffolds and transfer genetic cargo into the intracellular environment. For example, cationic polymers bind DNA to form polymer-DNA nanocomplexes through electrostatic interaction. One major challenge of non-viral vector based gene deliv-ery is that the stability of the nanocomplex must be cautiously optimized since either pre-mature disinte-gration or over stability would impair the transfection efficiency and render the gene therapy ineffective. Therefore, understanding the mechanism and kinetics of intracellular trafficking and unpacking of these nanocomplexes is crucial for designing the optimal gene carriers. QD-FRET nanosensors are ideal for examining the integrity of nanocomplexes in vivo be-cause of their ability to monitor reaction kinetics in homogenous conditions. Ho et al. built a QD-FRET sensor with chitosan-DNA nanocomplexes by conju-gating QD605 to plasmid DNA (pDNA) and tagging chitosan polymer with Cy5 [74]. The nanocomplex closely packed the QD and Cy5 within a confined space, facilitating energy transfer (Fig. 5). QD-FRET signals did not only track the location of the nano-complexes as they crossed the cellular membrane but also helped monitor the unpacking of nanocomplexes after cellular uptake. Chen et al. applied the same system to quantitatively compare three polymer gene carriers, chitosan, polyethylenimine (PEI) and poly-phosphoramidate (PPA) [75]. As the polymer carrier disintegrated, pDNA was released into cellular com-partments, leading to decreasing FRET intensity. The distribution of free pDNA was determined by ana-lyzing the FRET efficiencies of individual nanocom-plexes in various cellular compartments. The overall unpacking process was then modeled as a first-order reaction. Chen et al. expanded the capability of this system and created a two-step QD-FRET sensor to not only monitor the disintegration of the polymer carrier but also the degradation of the DNA [76]. In addition to the QD and Cy5 labeling described earlier, pDNA was stained with intercalating dye. The intact nano-complex had all three fluorophores in close proximity with the intercalating dye serving as a FRET relay. The first FRET occurred between QD525 and the in-tercalating dye, which in turn transferred energy to Cy5 in the second FRET. The unpacking of pDNA from the carrier then switched off QD-FRET. Howev-er, the signal from the intercalating dye was still
de-tectable as long as the pDNA remained intact. Re-cently, the same QD-FRET system was applied to evaluate gene delivery efficiency of a micelle vector [77] and to compare the performance of lipoplex and polyplex vectors for gene delivery [78].
QD-FRET was also applied to track intracellular drug delivery. Bagalkot et al. tracked the delivery of doxorubicin (Dox) using a QD based bi-FRET system [79]. A PSMA aptamer was tagged to a QD. Dox then intercalated the aptamer and induced the quenching of the QD. In addition, Dox simultaneously quenched the QD through a Bi-FRET process. The QD-Aptamer-Dox complex was delivered into cells
via PSMA mediated endocytosis. The release of Dox from the nanocomplex recovered the fluorescent sig-nals and enabled the tracking of intracellular drug delivery.
Figure 5: pDNA and chitosan were labeled with 605QD and Cy5, respectively. Condensation of DNA and chitosan by complex coacervation formed QD-FRET nanocomplexes. Upon excitation at 488 nm, QD-FRET-mediated Cy5 emission (pseudo-colored green) indicates a compact and intact nanocomplex. Reprinted with permission from [74], copyright 2006 Elsevier B.V.
QD as FRET Acceptor
would inevitably cause direct QD excitation, leading to notable acceptor bleed-through. The only way to resolve the fluorescent emission by direct excitation from that induced by FRET is to measure the differ-ence in fluorescdiffer-ence life time. Since photoexcitation does not offer straightforward FRET measurements, alternative donor sources are sought for transferring energy to QDs.
Bioluminescence resonance energy transfer (BRET) is one QD-FRET variations in which QDs are designed to serve as FRET acceptors. A biolumines-cence protein Renilla luciferase (Luc8) was conjugated to a QD. In the presence of Luc8 substrate, biolumi-nescent energy is released from Luc8 through an oxi-dation reaction and then transferred to the QD through BRET [80-82]. A BRET based sensor was de-signed to analyze the enzyme activity of matrix met-alloproteinases (MMPs) whose function involved de-grading the extracellular matrix. MMPs are found to be upregulated in various types of human cancers [80]. A short peptide consisting of a MMP-2 substrate and a polyhisitidine tag were fused to Luc8. The fu-sion protein self assembled onto QD surface via the polyhistidine tag, which then brought Luc8 complex-es close to the QDs. Upon the addition of Luc8 sub-strate coelenterazine, bioluminescence from Luc8 was observed with emission peak centering at ~480nm. The energy transfer between Luc8 and QD alone was inefficient as evidenced by the weak emission of the QDs. However, once Ni2+ ion was supplemented to
the reaction, BRET efficiency was significantly en-hanced. The enhancement seemed to be very specific to Ni2+ as other divalent ions did not have similar
effects. To detect MMP-2, the fusion protein was di-gested with MMP-2 during which the peptide seg-ment containing the polyhistidine tag was cleaved. As a result, the fusion protein could not bind to the QD, thereby preventing BRET from taking place. The BRET MMP-2 sensor exhibited exceptional specificity and sensitivity, capable of detecting 2 ng/mL MMP-2. So et al. also demonstrated the same BRET sensor as a self –illuminating source for in vivo imaging [81].
Chemiluminescence is another alternative ener-gy source that serves as a FRET donor. For example, Luminol is a chemiluminescent reagent that is acti-vated by oxidants such as H2O2. The reaction requires
a catalyst to decompose H2O2 into H2O and O2. The
hemin/G-quadruplex horseradish peroxidase (HRP) mimicking catalytic nucleic acids (DNAzymes) were discovered to generate chemiluminescence through catalyzing the oxidation of luminol by H2O2 [83, 84].
Freeman et al. included aptamer domains into the DNAzyme subunits [85]. One of the aptamer subunits
was conjugated to a QD. In the presence of aptamer targets, ATP or Hg2+ in this case, the DNAzyme sub-units self assembled into active hemin/G-quadruplex DNAzyme structures and promoted the chemilumi-nescence resonance energy transfer (CRET) by cata-lyzing luminol emission. As shown in Figure 6A, nu-cleic subunits included domain I and II of the HRP mimicking DNAzyme, as well as domain V and VI of an anti-ATP aptamer. In the absence of ATP, the two subunits are not able to form a stable complex. How-ever, in the presence of ATP, the aptamer domains binds to ATP and the resulting complex leads to the formation of a hemin/G-quadruplex that catalyzes the chemiluminescent reaction and gives rise to CRET. In contrast to FRET, the emission intensities of donors and acceptors increased or decreased concur-rently because the amount of energy transferred to the QD was proportional to the chemiluminescent energy available (Fig. 6B). QD-CRET sensors were also con-figured to detect specific DNA sequences (Fig. 6C). A DNA hairpin structure consisting of a few functional domains were conjugated to QDs. The DNAzyme forming domain was blocked in the presence of the hairpin loop. The sequence recognition domain re-sided in the loop. As the target DNA hybridized to the recognition sequence and opened the hairpin, the DNAzyme forming domain was freed, leading to the self assembly of a hemi/G-quadruplex DNAzyme. DNA hairpins with three different target recognition sequences were conjugated to QD490, QD560 and QD620 respectively to form three QD-CRET DNA probes. Upon hybridization to their respective targets, Hemin and H2O2 were added to induce CRET. The
presence of targets was indicated by emission of spe-cific QDs probes through CRET. With the proposed QD-CRET sensor, the authors successfully resolved three targets in a multiplexed format (Fig. 6D).
Although transferring energy to QDs through a photoluminescent donor would cause acceptor spec-tral bleed-through, QD signals resulting from FRET can still be extracted from the background of QD emission. It is achievable using time-resolved fluo-rescence because of the difference in luminescence decay time between direct emission and emission through FRET. Hildebrandt et al. and Charbonnière et al. used Lanthanides such as Eu and Te as photolu-minescent donors and QDs as FRET acceptors for time-resolved fluoro-immunoassays [86, 87]. Other donor options have also been explored. Anni et al.
Figure 6: QD-CRET nanosensor. A) QD-CRET detection of ATP by two subunits consisting of the conjugated anti-ATP and HRP-DNAzyme subunits. Upon the recognition of ATP by the aptamer, the chemiluminescence of luminol is activated and the energy is transfer to QD. B) Luminescence spectrum corresponding to the CRET signal of the QDs at λ= 612 nm in the absence of ATP, curve (1), and in the presence of different concentrations of ATP: (2) 1.25*10-7 M, (3) 1.25 *10-6 M, (4) 5*10-6 M, (5) 12.5 *10-6 M, (6) 5 *10-5 M, (7)
1 *10-4 M, C) QD-CRET detection of specific DNA sequence. The hybridization of DNA target to the hairpin opens the loop and allows
the formation of hemin/G-quadruplex which gives rise to QD-CRET signals. D) (1) The luminescence spectrum of QDs mixture cor-responding to the CRET signal in the absence of DNA targets; (2) in the presence of the target 1; (3) in the presence of target 2; (4) in the presence of target 3; (5) in the presence of all three targets. Reprinted with permission from [85], copyright 2011 American Chemical Society.
Fluorescence Quenching of QD
In addition to environmental conditions, QD emission intensities are strongly influenced by prox-imal molecules or nanoparticles that QDs interact with. Under many circumstances, the photolumines-cence of QDs is drastically quenched through nu-merous mechanisms. This seemingly undesirable phenomenon can serve as an advantageous feature. For example, quenching mechanism can be designed to act like a molecular switch for fluorescent signals, which would make QDs an ideal homogeneous sensing platform for studying molecular interactions and detecting specific targets.
The quenching effect is commonly observed in
[91]. The QDs were efficiently quenched by the Nile blue through FRET. The Nile blue dye assisted the oxidation of the NAD(P)H cofactors. In the presence of NADH, the dye was reduced to a different form that was not able to absorb photons in the visible spectrum, thereby stopping QD quenching. The pro-posed NADH-sensitive QD sensor was applied to monitor the change in intracellular metabolism of HeLa cell lines in response to drug treatment. Levy et al. designed a QD aptamer beacon for the detection of thrombin [92]. An aptamer sequence containing a thrombin-binding domain was covalently conjugated to a QD. An oligonucleotide complementary to the aptamer sequence was labeled with a fluorescent quencher DABCYL. Upon hybridization to the ap-tamer, DABCYL was brought to the vicinity of the QD to quench QD emission. Thrombin displaced the DABCYL labeled oligonucleotide by binding to the same aptamer. Hence, the presence of thrombin sep-arated the FRET pair and recovered the photolumi-nescence of the QDs. Dong et al. proposed a QD sensing system by using graphene oxide (GO) as QD quencher. GO was associated to QDs via a DNA hair-pin linker that contained a recognition sequence complementary to DNA targets [93]. While the hair-pin was closed, GO strongly interacted with the loop region and quenched QD emission. Once the target was introduced, the hairpin hybridized to the com-plementary sequence and opened the loop, which weakened the interaction between GO and DNA, leading to the recovery of QD emission.
Metallic nanoparticles also possess the ability to suppress the photoluminescence of QDs. The energy transfer between gold nanoparticle (AuNP) and QDs have been extensively studied, and a number of ana-lytical models have been proposed [94]. Kim et al., Chang et al. and Lowe et al. proposed similar AuNP based QD quenching systems to examine protease activities [95-97]. Peptide substrates were linked to QDs and AuNP at two termini. When protease en-zymes were present, they were able to cut the sub-strate and set the AuNP free thereby recovering QD emission. Liu et al. constructed a more elaborate QD-AuNP sensor for simultaneous detection of adenosine and cocaine [98]. QD and AuNP were in-terconnected through the hybridization of a surface conjugated DNA aptamer. When the aptamer sub-strates were absent, QDs and AuNPs were closely packed into large aggregates whereby the emissions of the QDs were greatly quenched. However, in the presence of adenosine or cocaine, the aptamers bound to their respective substrates and destabilized the ag-gregates, which were indicated by the recovery of QD emission.
Another mechanism frequently observed in QD photoluminescence quenching relies on charge trans-fer. Medintz et al. constructed a QD/dopamine redox coupled nanoassembly for pH sensing [99]. Dopamine molecules self assembled onto the QD surface through covalently linked polyhistidine tags and functioned as the pH-dependent electron acceptors. Upon photoex-citation, the excited electrons from the conduction band of the QDs were transferred to the oxidized dopamine, causing QD quenching. The degree of the quenching was controlled by the amount of oxidized dopamine species. At low pH, the oxidization was inefficient, therefore the quenching was insignificant. As the pH increased, more dopamine molecules were converted to the oxidized species, leading to en-hanced QD quenching. The authors utilized the QD/dopamine nanoassembly to estimate the intra-cellular pH. Aryal et al. developed a fatty acids sensor by coupling a modified intestinal fatty acid binding protein (IFABP) to QDs [100]. The modified IFABP contained a ruthenium complex in its hydrophobic binding pocket that allowed nonspecific binding of palmitate, which decreased the water occupancy of the binding pocket and altered the electron transfer rate, causing the quenching of QD photolumines-cence. Sandros et al. modified the MBP a ruthenium complex for maltose sensing[101]. In the absence of maltose, the distance between the ruthenium complex and the QD was short enough to allow electron transfer to occur, resulting in the quenching of the QD. The binding of maltose induced conformational change of MBP, increasing the distance between the electron donor and acceptor, preventing the charge transfer thereby recovering the QD emission. Impel-lizzeri et al., developed a photoactivated QD by con-jugating photocleavable 2-nitrobenzyl group to its surface [102]. The QD was quenched was believed to be a result of the electron transfer from the QD to the organic ligands. The UV irradiation photolyzed the ligands and removed the quencher from the QD sur-face, thereby restoring the QD emission. Choi et al.
discovered that thrombin quenched PbS QDs through charge transfer [103]. PbS QDs were capped with a thrombin binding aptamer, which bound to thrombin
via a heparin binding site or fibrinogen recognition site and induced QD quenching. It was also found that prostate-specific antigen triggered the same ef-fect, suggesting potential applications in cancer di-agnostics.
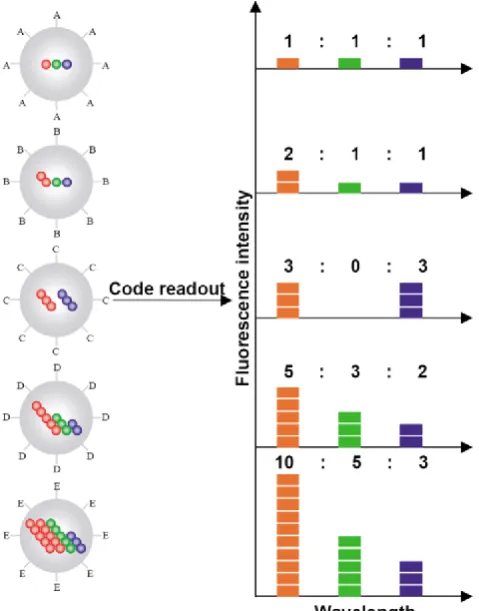
Figure 7: Schematic illustration of the optical coding based on wavelength and intensity multiplexing. Large spheres represent polymer microbeads, in which small colored spheres (multicolor quantum dots) are embedded according to predetermined inten-sity ratios. Molecular probes (A–E) are attached to the bead surface for biological binding and recognition, such as DNA–DNA hybridization and antibody–antigen/ligand–receptor interactions. The numbers of colored spheres (red, green, and blue) do not represent individual QDs, but are used to illustrate the fluores-cence intensity levels. Optical readout is accomplished by meas-uring the fluorescence spectra of single beads. Both absolute intensities and relative intensity ratios at different wavelengths are used for coding purposes; for example (1:1:1) (2:2:2), and (2:1:1) are distinguishable codes. Adapted with permission from [36], copyright 2001 Nature Publishing Group.
QD Barcodes
Multicolor barcoding has enabled high degree of multiplexing in biomolecular assays. Han et al. created a two-parameter optical barcode by embedding QDs in polystyrene microbeads in a controlled manner [36]. Both the colors and intensities were precisely modulated for coding. A specific color-intensity com-bination would pinpoint an exact barcode in the pool of thousands (Fig. 7). Theoretically, the combination of m colors and n intensity levels could generate (nm-1) barcodes. For example, a coding system with 6
colors and 10 intensity levels could have a theoretical coding capacity close to one million. In reality, the
coding capacity is typically far less than the theoreti-cal limit due to the spectral cross talk and intensity variations. Nonetheless, this approach offers a large number of distinctive molecular identifiers, which greatly increase the detection throughput. Originally, microbeads barcodes were generated by swelling nonporous polystyrene beads in organic solvent con-taining QDs. However, the brightness and uniformity were not ideal for coding applications. An improved protocol developed by Gao et al. immobilized surfac-tant coated QDs on mesoporous polystyrene beads via
hydrophobic interaction [105, 106]. The resulting mi-crobeads barcodes were about 1000 times brighter and 5 times more uniform in their fluorescent intensities. Xu et al. applied a 2-color/3-intensity barcode system for multiplex SNP analysis [107]. Target SNP sites were PCR amplified and amplicons were hybridized to allelic specific probes encoded by the microbead barcodes. A Cy5 fluorophore that served as positive control was conjugated to amplicons via bio-tin-streptavidin interaction to confirm the presence of targets. Analysis of 10 SNP alleles in 94 samples was performed with close to 100% accuracy as verified by Taqman assay. Klostranec et al. encoded antibodies that recognized HBV, HCV and HIV pathogen bi-omarkers using a 2-color/2-intensity barcode system and showed multiplex pathogen detection on a mi-crofluidic platform driven by electrokinetic flow [108]. A few other groups focused on barcode synthesis techniques aiming at improving the throughput [109] and barcode uniformity [110].
QD ENABLED SINGLE MOLECULE
DETECTION
in-terrogates individual molecules and provides statis-tical information on the entire target population.
With the development of novel fluorescent probes and sensing strategies, SMD pushes the detec-tion limit to the extreme, providing an excepdetec-tional platform for sensing scarce molecules at low concen-trations. QDs are ideal fluorescent tags for SMD based sensing. The signal to noise ratio of SMD is highly dependent on specific brightness of the fluorophores and the transient time of molecules passing through the detection volume. To attain high analysis throughput, samples are often driven through the detection volume at high speed, which decreases the molecule transient time and inevitably reduces the burst hence the signal to noise ratio. QDs alleviate these issues due to their high brightness. In addition, QDs are exceedingly photostable when compared to organic fluorophores, which allow them to withstand high-intensity illumination within the confocal setup for much longer periods of time.
SMD QD-FRET Detection
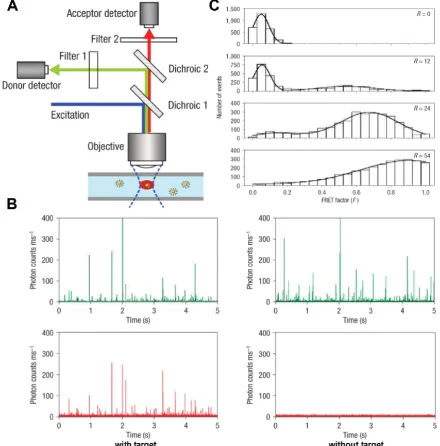
By uniting the extremely low background of QD-FRET nanosensors and the incredibly high sensi-tivity of SMD, Zhang et al. reported a single-QD sen-sor for target specific nucleic acid detection [52]. First, a biotin labeled capture probe and a Cy5 labeled re-porter probe were hybridized to the target DNA to form a sandwich hybrid structure (Fig. 2A), which then self assembled onto streptavidin coated QDs. The QD nanosensor assembly was then interrogated in a microfluidic capillary (Fig. 8A). Donor and ac-ceptor fluorescent bursts were detected simultane-ously with two avalanche photo diodes (APD). In the absence of target DNA, only QD bursts were wit-nessed because no FRET pair was established (Fig. 8B). In contrast, positive control gave fluorescent bursts in both QD and Cy5 channels (Fig. 8B). FRET factor distribution was obtained by calculating indi-vidual FRET factors based on the intensities of the donor burst and its corresponding acceptor burst us-ing sus-ingle particle FRET (spFRET) techniques [112, 113]. The spFRET histograms clearly exhibited a right shift (higher FRET factor) with increased acceptor to donor ratio (Fig. 8C). Subsequently, the same single QD nanosensor was functionalized with a variety of probes to detect cocaine [114] and study molecular interactions [115, 116]. Pons et al. carefully studied a maltose binding protein (MBP) based QD-FRET sys-tem with SMD [117]. Cy3 labeled MBP was allowed to self assemble onto a QD surface. By closely examining the spFRET distribution, the authors concluded that the self assembly process resulted in a group of sub-populations each of which had a unique acceptor to
donor ratio that followed Poisson distribution with the expectation value of N, which was the ensemble acceptor to QD ratio. The QD-FRET distribution ob-served by SMD was the summation of all the sub-populations. Direct correlation between spFRET and ensemble FRET was revealed by comparing the FRET efficiencies and their dependence on donor-acceptor distance.
SMD QD Burst Coincidence Detection
Fluorescent burst coincidence detection is de-signed specifically for SMD platforms. Two QD la-beled probes were designed to recognize the same target and form a dually labeled complex (Fig. 9A). As the complex passes through the detection volume, signals from both QDs are detected simultaneously, resulting in a pair of coincident fluorescent bursts in two independent channels (Fig. 9B). The concentra-tions of probes and targets are in the sub-nanomolar range. Under such conditions, the average number of molecules remaining in the detection volume is less than unity. As a consequence, in the absence of target, two probes pass through the detection volume inde-pendently and the resulting fluorescent bursts in each of the two channels are uncorrelated (Fig. 9C). It is important to ensure that no spectral crosstalk exists between the two fluorophores to avoid false coinci-dence. Due to small Stokes shift of organic dyes, du-al-excitation is required for coincidence detection. However, it is intricate to align the illumination volumes of two lasers and correct the chromatic ab-erration [111]. In contrast, the unique optical proper-ties of QDs permit single excitation for QDs of dif-ferent colors. As a result, multi-color coincidence can be achieved with QDs using simple confocal setups with a single excitation source.
fluores-cent bursts. Zhang et al. managed multiplexed detec-tion with SMD by combining QD coincidence and QD-FRET [120]. Two fluorophores were coupled to QDs via DNA linkers. The Alexa488 and QD605 pair was simultaneously excited and detected by coinci-dence through single particle QD-FRET.
Ho et al. developed an imaged based coincidence detection strategy [121]. DNA functionalized QDs hybridized to targets and formed a dual-color labeled sandwich nanoassembly (Fig. 10A). The presence of targets was identified using colorimetric
measure-ments. Because the physical sizes of QDs were much smaller than the diffraction limited resolution, the co-localized QD pair exhibited the combined color of the two QDs (Fig. 10B). Meanwhile, unbound QDs retained their original colors, allowing easy differen-tiation from the target nanocomplexes. Multiplexed detection was accomplished by tagging 6 DNA probes with 3 different QDs. Each target gene hybridized to two probes and resulted in a unique color combina-tion (Fig. 10C).
Figure 9: Conceptual illustration of QD coincidence detection. A) Two QD conjugated probes hybridize to the target and form a dually labeled complex. B) As the complex passes through the detection volume, a pair of coincident fluorescent bursts are observed. C) In the absence of target, QDs travel independently through the detection volume. No coincident fluorescent burst is observed.
UNCONVENTIONAL SENSING
STRATEGEIES
While the majority of research on QDs concen-trates on their excellent photoluminescent properties, non-photoluminescent phenomena may also lead to new opportunities for developing QD based molecu-lar assays that conventional approaches are not able to achieve.
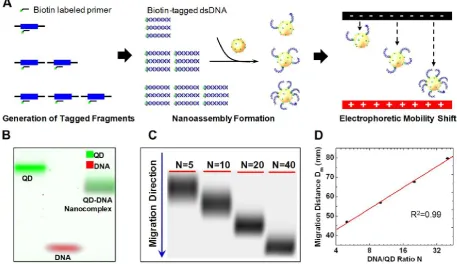
In a recent publication, Zhang et al. reported a QD based ultrahigh-resolution DNA quantification technique named quantum dot electrophoretic mobil-ity assay (QEMSA). QEMSA exploits the electrohy-drodynamic property of streptavidin coated CdSe QDs [15]. Target DNA molecules were tagged with biotin and self assembled onto QD surfaces (Fig. 11A).
The electrophoretic mobility of QDs was precisely modulated by the degree of DNA conjugation. Instead of quantifying based on fluorescent intensities, the amount of target DNA was determined by measuring the relative migration distance of the QD-DNA nanocomplex within a gel (Fig. 11B). An analytical model based on Poisson-Boltzmann equation pre-dicted the migration distance to be proportional to the logarithm of the DNA to QD ratio N (Fig. 11C,D). QEMSA enabled accurate quantification down to 1.1-fold (9%) change in quantity. It had been success-fully applied to quantify DNA copy number variation of RSF1/HBXAP in ovarian cancer cell lines and assess DNA methylation levels of p16/CDK2A gene promot-er.
Figure 12: Multi-target electrical DNA detection protocol based on different QD tracers. (A) Process flow: introduction of probe-modified magnetic beads, hybridization with the DNA targets, and second hybridization with the QD-labeled probes. (B) Disso-lution of QDs and electrochemical detection. Reprinted with permission from [16], copyright 2003 American Chemical Society.
The electrochemical properties of QDs have gradually attracted more attention. Wang et al. per-formed sandwich immunoassays with QD conjugated with anti-prostate-specific antigen (PSA) antibodies [122]. The immobilized QDs were dissolved in HCl. Electrochemical stripping analysis of the released cadmium was performed to confirm the presence of PSA. Wang et al. extended the design by introducing three types of QDs made from ZnS, CdS and PbS [16]. Three pairs of probes were designed to detect three distinct targets. Each pair consisted of a forward probe and a reverse probe. Three forward probes were linked to three types of QDs respectively while the three reverse probes were all immobilized to the same magnetic particles (Fig. 12A). Upon hybridiza-tion to the target DNA, QDs were extracted from the solution together with the magnetic particles. Elec-trochemical stripping analysis was subsequently performed to identify heavy metal ions dissolved from the QDs. The stripping peaks of Zn, Cd and Pb ions, each of which indicated the presence of one tar-get, were well separated, providing the opportunity for multiplexed detection (Fig. 12B).
QDs immobilized on electrodes could be de-tected through photocurrents generated by photoex-cited electron-hole pairs. The conduction band elec-trons were either transferred to electrode, generating
anodic photocurrents, or transferred to electron ac-ceptors in solution phase, generating cathodic pho-tocurrents [18, 123]. Making use of the photoelectrical properties, Willner et al. reported a QD based DNA detection array by sensing changes in the photoelec-trical currents [20]. Probes were immobilized on the electrodes as well as on the QDs. In the presence of the target, QDs formed a cross linked network on the electrode surface through DNA hybridization. [Ru(NH3)6]3+ which bound to dsDNA by electrostatic
force was then added to provide pathways for elec-trons to enhance the photocurrent. DNA quantifica-tion was accomplished by measuring the photocur-rent generated in the QD network. The same group also used the QD photochemical sensor to study en-zyme inhibitor effects [19]. Acetycholine esterase (AChE) was covalently linked to QDs and immobi-lized on an Au electrode. The presence of the AChE substrate, acetylthiocholine, activated the photo-chemistry. The potency of AChE inhibitor was ana-lyzed by measuring changes in photocurrent at vari-ous inhibitor concentrations.
CONCLUSION AND FUTURE OUTLOOK
In this review, we have commented on the latest QD based sensing and molecular diagnostic strategies in numerous studies. A summary that lists all the QD applications and their sensing approaches is provided in Table 1.
Since their introduction in biological applica-tions merely a decade ago, QDs have quickly evolved from a generic "passive" fluorescent labels to "smart" nanoprobes that carry additional functions. QDs have made great impact on modern molecular and cellular biology by providing innovative tools to explore new biological events. Their unique optical properties render them valuable for high throughput and multi-plexed detection, particularly in –omics studies. QD-FRET based nanosensors have been integrated into a great number of homogeneous molecular as-says to detect specific targets and monitor reaction progress. QDs have also proven to be excellent tags for SMD strategies due to their extreme sensitivity. Unconventional non-photoluminescence properties of QDs are already being explored in the hopes of de-veloping new detection methods.
Despite their numerous advantages, it is to be realized that QD is not meant to replace conventional organic fluorophores but rather offer a complement. Both dyes have their benefits as well as drawbacks. The sizes of QDs are considerably larger than typical organic fluorophores, which poses a problem for QD conjugated probes in biochemical reactions. QDs also unsuitable for many enzyme based signal amplifica-tion reacamplifica-tions [6]. So far, no practical QD based real time PCR platform has been reported that match conventional organic fluorophore based real time PCR in terms of performance. Concerns are also raised on the cytotoxicity of QD for in vivo studies. The majority of QDs are made from highly toxic sem-iconductor materials. Even with proper capping and organic functional layers, toxic ions are still believed to escape from the core [127]. Fortunately, the abovementioned issues are already under investiga-tion. Compared to organic fluorophores, more de-tailed characterization and well established assay protocols are required to promote the commercial availability of QD based analysis systems in order to attract more users.
Table 1: Summary of QD sensing strategies and their applications.
Subject of Study Sensing Strategy Reference
Detection of Specific Targets
P53 SNP and single base deletion QD passive label Ref.[44, 46]
SNP QD barcode Ref.[107]
KRAS point mutation single molecule QD-FRET Ref.[52]
KRAS point mutation single molecule QD burst coincidence Ref.[118, 119]
DNA methylation methylation specific QD-FRET Ref.[53, 60]
DNA methylation, RSF1 gene copy number
varia-tion quantum dot electrophoretic mobility assay (QEMSA) Ref.[15]
RNAi selection QD-FRET Ref.[61]
specific DNA/RNA sequence solid phase QD-FRET Ref.[62-64]
specific DNA/RNA sequence QD quenching through graphene oxide Ref.[93]
specific DNA/RNA sequence image based QD single molecule coincidence Ref.[121]
specific DNA/RNA sequence electrochemical stripping of QD Ref.[16]
specific DNA/RNA sequence photoelectricity induced by QD Ref.[20]
Western blot immunoassay with QD passive label Ref.[40-42]
prostate specific antigen electrochemical stripping of QD Ref.[122]
peptide fragment immunoassay with QD passive label Ref.[8]
HIV and HIV drug screening Single molecule QD-FRET Ref.[115]
extracellular signal-regulated kinases immunoassay with QD passive label Ref.[37] cholera toxin and staphylococcal enterotoxin B immunoassay with QD passive label Ref.[30]
Thrombin QD quenching through FRET Ref.[92]
Thrombin QD quenching through electron transfer Ref.[103]
adenosine and cocaine QD quenching through FRET Ref.[98]
cocaine single molecule QD-FRET Ref.[114]
maltose competitive QD-FRET and QD quenching through FRET Ref.[34, 65]
maltose QD quenching through electron transfer Ref.[101]
TNT competitive QD-FRET Ref.[66]
Ca2+ QD-FRET with Ca2+ sensitive acceptor Ref.[69]
ATP, Hg2+ CRET with QD Ref.[85]
HBV, HCV and HIV QD barcode Ref.[108]
pH QD-FRET with pH sensitive acceptor Ref.[67, 68]
pH QD quenching through electron transfer Ref.[99]
Temperature QD quenching by temperature Ref.[104]
Exploration of using QD as FRET acceptor with
photoexcitation time resolved QD-FRET Ref.[86-90]
Measurement of Enzyme Activity and Reaction Kinetics
protease activity (caspase-1, caspase-3, collagenase,
chymotrypsin, botulinum neurotoxin, trypsin) QD-FRET Ref.[31, 34, 68, 70]
protease activity QD quenching through gold nanoparticles Ref.[95-97]
protease activity (matrix metalloproteinases) BRET with QD Ref.[80-82]
protein kinase activity (tyrosine kinases Abl and Src) QD-FRET Ref.[71]
DNAse, Mnase activity QD-FRET Ref.[68, 72]
polymerase activity (Klenow fragment) QD-FRET Ref.[68, 73]
telomerase activity QD-FRET Ref.[73]
inhibition of acetycholine esterase photoelectricity induced by QD Ref.[19]
MBP binding kinetics single molecule QD-FRET Ref.[117]
Monitoring of Intracellular Activity
intracellular gene trafficking QD-FRET with QD-DNA-polymer micelle, lipoplex and
polyplex Ref.[74-78]
intracellular drug (doxorubicin) trafficking Bi-FRET QD-FRET Ref.[79]
intracellular metabolism monitoring QD quenching through FRET Ref.[91]
ACKNOWLEDGEMENT
Authors would like to thank Dr. Suneil Hosmane for helpful discussions and suggestions. Authors also would like to thank funding source from National Institutes of Health (R01CA155305, U54CA151838), National Science Foundation (0546012, 0967375) and Stand Up to Cancer (Epigenetic Dream Team, SU2C-AACR-CT0109).
CONFLICT OF INTEREST
Authors declare no conflict of interest.
References
1. Nirmal M, Brus L. Luminescence photophysics in semiconductor nano-crystals. Accounts of Chemical Research. 1999; 32: 407-14.
2. Alivisatos AP. Semiconductor clusters, nanocrystals, and quantum dots. Science. 1996; 271: 933-7.
3. Norris DJ, Bawendi MG. Measurement and assignment of the size-dependent optical spectrum in CdSe quantum dots. Physical Re-view B - Condensed Matter and Materials Physics. 1996; 53: 16338-46. 4. Norris DJ, Efros AL, Rosen M, Bawendi MG. Size dependence of exciton
fine structure in CdSe quantum dots. Physical Review B - Condensed Matter and Materials Physics. 1996; 53: 16347-54.
5. Norris DJ, Sacra A, Murray CB, Bawendi MG. Measurement of the size dependent hole spectrum in CdSe quantum dots. Physical Review Let-ters. 1994; 72: 2612-5.
6. Resch-Genger U, Grabolle M, Cavaliere-Jaricot S, Nitschke R, Nann T. Quantum dots versus organic dyes as fluorescent labels. Nature Meth-ods. 2008; 5: 763-75.
7. Bruchez Jr M, Moronne M, Gin P, Weiss S, Alivisatos AP. Semiconductor nanocrystals as fluorescent biological labels. Science. 1998; 281: 2013-6. 8. Chan WCW, Nie S. Quantum dot bioconjugates for ultrasensitive
noni-sotopic detection. Science. 1998; 281: 2016-8.
9. Yager P, Domingo GJ, Gerdes J. Point-of-care diagnostics for global health. Annual Review of Biomedical Engineering. 2008; 10: 107-44. 10. Farias PMA, Santos BS, Menezes FD, Ferreira R, Fontes A, Carvalho HF,
et al. Quantum dots as fluorescent bio-labels in cancer diagnostic. Phys-ica Status Solidi (C) Current Topics in Solid State Physics. 2006; 3: 4001-8. 11. Lakovicz JR. Principles of fluorescence spectroscopy. 3rd ed. New York:
Springer Science+Business Media; 2006.
12. Mason WT. Fluorescent and luminescent probes for biological activity. 2nd ed. London: Academic Press; 1999.
13. Jain KK. Nanodiagnostics: Application of nanotechnology in molecular diagnostics. Expert Review of Molecular Diagnostics. 2003; 3: 153-61. 14. Chen Y, Elangovan M, Periasamy A. FRET data analysis—the algorithm.
Molecular Imaging: FRET Microscopy and Spectroscopy. New York: Oxford University Press. 2005: 126–45.
15. Zhang Y, Liu KJ, Wang T-L, Shih I-M, Wang T-H. Mapping DNA quan-tity into electrophoretic mobility through quantum dot nanotethers for high-resolution genetic and epigenetic analysis. ACS Nano. 2012; 6: 858-64.
16. Wang J, Liu GD, Merkoci A. Electrochemical coding technology for simultaneous detection of multiple DNA targets. Journal of the Ameri-can Chemical Society. 2003; 125: 3214-5.
17. Wang J. Nanoparticle-based electrochemical DNA detection. Analytica Chimica Acta. 2003; 500: 247-57.
18. Katz E, Zayats M, Willner I, Lisdat F. Controlling the direction of pho-tocurrents by means of CdS nanoparticles and cytochrome c-mediated biocatalytic cascades. Chemical Communications. 2006;: 1395-7. 19. Pardo-Yissar V, Katz E, Wasserman J, Willner I. Acetylcholine