DOI : https://doi.org/10.32628/CSEIT1952173
Chicago Crime Analysis using R Programming
Monish NComputer Science Engineer, Ramaiah Institute of Technology, Bengaluru, Karnataka, India
ABSTRACT
In recent years law enforcement have improved by taking better strategies, computer aided technology, efficient use of resource, etc. As a result of these over the couple of years there has been a steep decline in crime rate in the US (United States). Law enforcement have turned to data science for insights (ranging from reports, corrective analysis and behavior modelling). There has been an overall drop in crime rates in Chicago in recent years. In fact, these rates are at the lowest when compared to the previous decades. This paper uses the criminal dataset found at “data.cityofchicago.org/Public-Safety/Crimes-2001-to-present/ijzp-q8t2” to describe historical trends, insights, etc. in Chicago from 1965 to 2018 and not to assign any casual interpretation of the vanguards of crime rates during this period. Here K-Nearest Neighbor (KNN) classification is used for training and crime predication. Discussions on future investigation can also be found. The proposed model has an accuracy of 83.2%.
Keywords :
KNN Algorithm, Data Analysis, Chicago Crime Dataset, clustering, Data.
I. INTRODUCTION
The past couple of years have witnessed an overall declining trend in crime rate in the Chicago. There has been some advancement in law enforcement especially the inclusion of computer-aided technology for effective deployment of police resources.
Knowledge discovery in databases (KDD) is the process of extracting meaningful information and finding patterns in a database [1]. Data Mining (DM) is a step in the KDD process which applies sophisticated algorithms to the database [1]. Analyzing Crime data helps in taking necessary actions for prevention of crimes. Data mining provides algorithms techniques and tools to analyze data and extract important information from it.
II. LITERATURE SURVEY
[3] The authors J. Agarwal, R. Nagpal, and R. Sehgal have implemented crime analysis on crime dataset by applying k means clustering algorithm for extracting useful information from the crime dataset using rapid miner tool which is an open source software. Rapid miner is a solid and complete package with flexible support options. They have considered homicide crime taking into account the corresponding year and that the trend is descending from 1990 to 2011.
each cities have also been found. They found that Sydney, Lachlan, Wollondilly Shire are cities with highest crime rates. Most common crimes are Theft, Drug Offences, Harassment, threatening behavior and private nuisance, and Against Justice Procedures.
[5] Chung-Hsien Yu, Max W. Ward, Melissa Morabito and Wei Ding have discussed the preliminary results of a crime forecasting model. This is developed and designed in collaboration with the police department of a United States city in the Northeast. They have mainly discussed the approach to architecting datasets from original crime record. The dataset contains crime events, location, type of crime, etc. Spatial and temporal features are collected from the raw dataset. They have predicted the main hotspots in the country for crime and also have discussed the best forecasting approaches.
[6] The authors Xiangyu Zhao and Jiliang Tang have discussed that more effort has been made on developing crime prediction models, but they failed to capture the dynamic nature of crimes in urban. Due to recent development in technology they are able to get a better understanding. They have a novel framework STF, which captures temporal-spatial patterns and leverages transfer learning for crime prediction. They also have discovered the potential hotspots of various crime, safe and unsafe hours, identify potential criminals through online profile or their interactions, etc.
In paper [7] the authors Peng Chen, Hongyong Yuan and Xueming Shu used AutoRegressive Integrated Moving Average (ARIMA) model to get short-term forecasting of property crime in a city of China. The ARIMA model was trained with a property crime dataset for 50 weeks. Using this crime amount of 1 week ahead is predicted. The models fitting and forecasting results are compared with simple exponential smoothing and holt two-parameter exponential smoothing. And ARIMA model has
higher fitting and forecasting accuracy than the other two.
[8] The authors Keivan Kianmehr and Reda Alhajj have used the one class Support Vector Machine (SVM) approach to analysis the crime dataset and to predict the crime hotspots. A subset of the crime dataset is chosen (one part of the dataset was chosen at random and second part by k-means clustering) and it is classified based on the predefined level of crime rate. Their experiments show that the SVM yields more accurate result when appropriate parameters are chosen. They have concluded that SVMs are more suited for crime hotspot prediction and k-means is suited for data selection.
ALGRORITHM DESCRIPTION
K - Nearest Neighbors (KNN) Algorithm
KNN algorithm is a type of lazy learning or instance-based learning which is used for classifying objects based on closest training examples in the feature space.
The simplest form of KNN is when K = 1
KNN Algorithm pseudocode: distance between UnSamples(i) and
for all the unknown samples UnSample(i) for all the known samples Sample(j) compute the Sample(j)
end for
find the k smallest distances locate the corresponding samples Sample(j1),..,Sample(jk)
assign UnSample(i) to the class which appears more frequently
end for
popular choice is the Euclidean distance is more suitable for this setting.
DATASET DESCRIPTION
The dataset used in this paper is “Crimes (2001 -Present)” for the city of Chicago which has been taken from Data.gov from the following link:
https://catalog.data.gov/dataset/crimes-2001-to-present-398a4
.This dataset has been collected from the year 2001 till present, and still is updating. This dataset contains incidents of crime that occurred in the City of Chicago from 2001 to present. To protect the privacy of crime victims, addresses are shown at the block level only and specific locations are not identified. These crimes may be based upon preliminary information supplied to the Police Department by the reporting parties.
TABLE I. DATASET ATTRIBUTES
Name Description Type
ID Unique identifier for the
The Chicago Police Department Records Division Number, which is unique to the incident.
Text
The partially redacted address where the incident occurred, placing it on the same block as the actual address.
Text
IUCR
The Illinois Uniform Crime Reporting code. This is directly linked to the Primary Type and Description
The secondary description of the IUCR code, a subcategory of the primary description
Text
Location Descriptio n
Description of the location where the incident occurred Text
Arrest Indicates whether an arrest was
made
Boolea n
Domestic
Indicates whether the incident was domestic-related as defined by the Illinois Domestic littlest police geographic territory – each beat has devoted police beat vehicle. Three to five whips make a police division, and three parts make up a police locale
Text
District Indicates the police district
where the incident occurred Text
Ward The ward (City Council district)
where the incident occurred
Numb er
Communi ty Area
Indicates the community area where the incident occurred. Text
FBI Code
Indicates the crime
classification as outlined in the FBI's National Incident-Based Reporting System (NIBRS).
Text
X Coordinat e
The x coordinate of the location where the incident occurred in State Plane Illinois East NAD 1983 projection. This location is shifted from the actual location for partial redaction but falls on the same block
The y coordinate of the location where the incident occurred in State Plane Illinois East NAD 1983 projection. This location is shifted from the actual location for partial redaction but falls on the same block.
Updated where the incident occurred. This location is shifted from the actual location for partial redaction but falls on the same where the incident occurred. This location is shifted from the actual location for partial redaction but falls on the same that allows for creation of maps
and other geographic
operations on this data portal. This location is shifted from the actual location for partial redaction but falls on the same block
Numb er
III. IMPLEMENTATION
The implementation is divided into the following steps:
Data Collection
This dataset is downloaded from “catalog.data.gov”. Data Cleaning / Pre-processing
Data Cleaning has been done to make the analysis easier:
1. The dataset has been reduced to year '2015-2018 (present)' as it was too large.
2. Convert most variables to categorical variables. 3. Removed Missing Values and Whitespaces. 4. Duplicates observations have been removed.
5. Date variable which contained (Data and time) has been split into Day, Month, Year and Weekday.
6. Convert different types of “crime sexual assault”, “prostitution”, “sex Offense” to Sex Cases.
7. Convert different types of “narcotics", “other narcotic violation”, “other Narcotic violation” to Drugs.
8. Convert different types of " non – criminal ", "non-criminal ","non – criminal (subject specified)" to Non-Criminal.
9. Convert different types of "human trafficking", "other offense", "public indecency" to Other Offence.
10. Converting most of the most of the level names in Location Description since most of the values are again repeated.
Feature Selection
Here the features selection done is used to build the model. The attributes used for feature selection are Date, Block, Primary Type, Arrest, Beat, Location, District, Community area, Latitude and Longitude.
Model Trainning
Once the feature selection is over the dataset is split into xtrain, ytrain, xtest and ytest. The xtrain and y train part of the dataset is used to train the model.
Prediction
After the model is built and trained it is used for prediction. Then the Confusion matrix is calculated by using table(predictions, testing.label) and accuracy is calculated.
Visualization
IV.RESULT AND SNAPSHOT
Exploratory Results
In Exploratory Data Analysis (EDA) the first and foremost step in data analysis process. Here, we try to make sense of the data, figure out patterns, trends, outliers, try to form questions and as well as find out the best ways to manipulate the available data sources to get the answers needed.
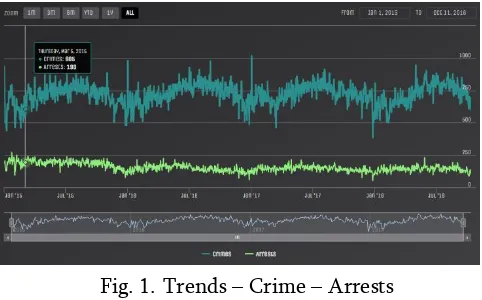
Fig. 1. Trends – Crime – Arrests
Figure 1 shows more crimes were committed but less arrests were made. But the total crimes have been decreasing steadily each year.
Fig. 2.Trends – Individual All Crime
Fig. 3.Trends – Top Crimes
Fig. 4.Top Crime Type in Chicago
In Figure 4 provides a statistical comparison between numbers of particular crime type committed and arrest rate of the crime type. Here it shows that more theft crime incidents (22.6%) compared to the rest of the offenses and Battery cases came in at 18.1% followed by damages (10.8%). We can also see drug cases at 9.3% followed by far by assault cases at 6.3%.
Fig. 5.Top Crime Location in Chicago
Fig. 6.Crime Frequencies by Crime and Location
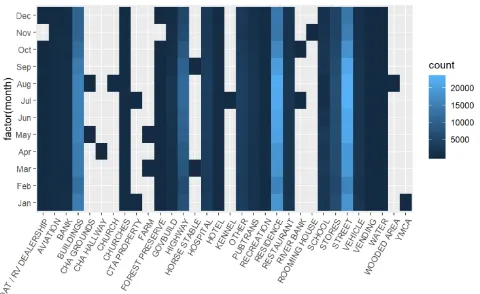
In Figure 6 the Heat Map shows that Theft crimes are committed frequently at Residences, Street and on Motor Vehicles. Drug, damage and battery crimes happened in streets and also in Residences. On highways, drug, battery, robbery, theft and assault frequently took place. Lastly, theft and battery crimes happened frequently in buildings with together with some drug, damage and burglary crimes.
Fig. 7.Crime by Month in Chicago
In Figure 7 the visualizations depict the number of crime occurrences and arrests on a particular month in Chicago where it peaks in July and low in February it then gradually goes down until December and then spikes again on January.
Fig. 8.Crime by Weekday in Chicago
In Figure 8 the visualizations depict the number of crime occurrences and arrests on a particular day of week in Chicago where Friday has the maximum number of crimes arrest and Sunday has the least number of crimes arrest.
Fig. 9.Crime Frequencies by Month and Location
Fig. 10.Crime by Neighborhood
The visualization in Figure 10 is created using the tmaptools, sf & leaflet packages. Crime is not evenly distributed across the city. The areas of dark red have the most reported incidents (“Austin”, Suburb in Chicago). Second highest being “South Shore” Neighborhood in Chicago. On the other hand, “Edison Park” Neighborhood in Chicago is the lowest crime rate in Chicago.
Prediction Results – KNN
To perform prediction K nearest neighbor has been used to segregate unlabeled data points into well-defined groups. Here 25000 random samples are used to predict the arrest likelihood based on past arrests in our model. The KNN algorithm is applied to the training data set and the results are verified on the test data set. Therefore, the dataset has been divided into 2 portions in the ratio of 80: 20 for the training and test data set respectively.
The explanatory variables chosen for prediction based on the pre-processing done during the exploratory analysis are as following:
1. Month: In which the crime happened
represented as a 12 features vector
2. Drug: Crime such as Narcotics, Battery etc. 3. Location description: A short description of the
street/location in which the crime happened.
4. Beat: A beat is the smallest police geographic area in which crime happened.
5. Weekday: In which day of the week crime happened
6. District: Indicates the police district where the incident occurred.
7. Year: The year a crime occurred.
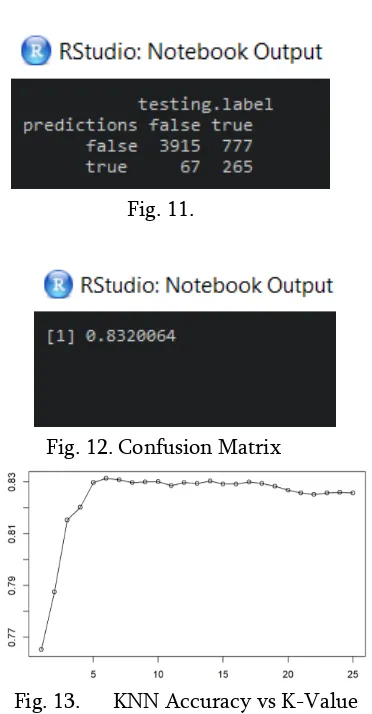
In Figure 11 shows the confusion matrix which is a table used to describe the performance of a classification model. In Figure 12 it shows the model has an accuracy of 83.2%.
Fig. 11.
Fig. 12.Confusion Matrix
Fig. 13. KNN Accuracy vs K-Value
V. CONCLUSION
This paper mainly focusses on crime analysis in Chicago by using the Chicago crime dataset found at “data.cityofchicago.org”. KNN a clustering algorithm is implemented on the dataset to predict whether an arrest will be made for a given incident. The proposed model has an accuracy of 83.2% with k-value 9. This can be used in designing precaution methods in the future.
VI.REFERENCES
[1].Fayyad, Usama M, Gregory Piatetsky - Shapiro, and Padhraic Smyth, "Knowledge discovery and data mining: towards a unifying framework", KDD. Vol. 96. 1996. [2].Rizwan Iqbal, Masrah Azrifah Azmi Murad,
Aida Mustapha, Payam Hassany Shariat Panahy and Nasim Khanahmadliravi, “An Experimental Study of Classification Algorithms for Crime Prediction”, Indian Journal of Science and Technology, Vol 6 . March 2013.
[3].J. Agarwal, R. Nagpal, and R. Sehgal, ― “Crime analysis using k-means clustering”,‖
International Journal of Computer
Applications, Vol. 83 – No4, December 2013. [4].Anant Joshi, A. Sai Sabitha, Tanupriya
Choudhury, “Crime Analysis using k-means Clustering”, 2017 International Conference
on Computational Intelligence and
Networks,2017.
[5].Chung-Hsien Yu, Max W.Ward, Melissa Morabito and Wei Ding,“Crime Forecasting Using Data Mining Techniques”, 2011 11th IEEE International Conference on Data Mining Workshops.
[6].Xiangyu Zhao and Jiliang Tang, “Exploring Transfer Learning for Crime Prediction”,
2017 IEEE International Conference on Data Mining Workshops,2017.
[7].Peng Chen, Hongyong Yuan and Xueming Shu, “Forecasting crime using the arima model,” in Fuzzy Systems and Knowledge Discovery, 2008. FSKD ’08. Fifth International Conference on, vol. 5, 2008, pp. 627–630.
[8].Keivan Kianmehr and Reda Alhajj, “Crime Hot-spots prediction using support vector machine,” in IEEE International Conference on Computer Systems and Applications, 2006, pp. 952-959.
Cite this article as :
Monish N, "Chicago Crime Analysis using R Programming ", International Journal of Scientific Research in Computer Science, Engineering and Information Technology (IJSRCSEIT), ISSN : 2456-3307, Volume 5 Issue 2, pp. 937-944, March-April 2019. Available at doi :