of peer-reviewed research and commentary in the population sciences published by the Max Planck Institute for Demographic Research Konrad-Zuse Str. 1, D-18057 Rostock · GERMANY www.demographic-research.org
DEMOGRAPHIC RESEARCH
VOLUME 13, ARTICLE 20, PAGES 521-546
PUBLISHED 17 NOVEMBER 2005
http://www.demographic-research.org/Volumes/Vol13/20/ DOI: 10.4054/DemRes.2005.13.20
Research Article
Decomposition analysis of
Spanish life expectancy at birth:
Evolution and changes in the
components by sex and age
Rosa Gómez-Redondo
Carl Boe
This article is part of Demographic Research Special Collection 4, “Human Mortality over Age, Time, Sex, and Place: The 1st HMD Symposium”.
Please see Volume 13, publications 13-10 through 13-20.
1 Introduction: Spanish mortality during the XXth century 522 1.1 Spanish mortality in the European context 522 1.2 Development of e0 in the XXth century 523
2 Sources and methods 525
2.1 Data sources 526
2.2 Decomposition of life expectancy at birth, e0 527 3 Recent changes in the components of life expectancy 527
3.1 The continuing role of infant mortality 529 3.2 Retrogression of health at young ages 530 3.2.1 Traffic accidents and alcohol consumption 535
3.2.2 AIDS and drugs 536
3.3 Expectations of life at old ages 538
3.4 Sex differences 538
4 Present trends in the gains of life expectancy 540
5 Conclusions 541
6 Acknowledgments 542
Decomposition analysis of Spanish life expectancy at birth: Evolution
and changes in the components by sex and age.
1Rosa G´omez-Redondo2 Carl Boe3
Abstract
Using data from the Human Mortality Database (HMD), the paper analyzes the increase in the life expectancy of the Spanish population during three decades, 1970–2001, in order to ascertain which age and sex groups have made the most progress in terms of increasing life expectancy. Within the theoretical context of the Health Transition, the authors pro-vide a brief description of the Spanish mortality during the XXth century across several indexes. The study uses a decomposition technique to separate changes in Spanish life expectancy at birth (e0) into age, sex, and time components. The most important
com-ponents of change are found in the elderly, in young people, and in the evolution of sex differences in human mortality.
This article is part of Demographic Research Special Collection 4,
“Human Mortality over Age, Time, Sex, and Place: The 1stHMD Symposium”. Please see Volume 13, Publications 13-10 through 13-20.
1This paper is an elaboration of a presentation made during the The 1st HMD Symposium, “Human Mortality
over Age, Time, Sex, and Place”, June 18-19, 2004, at the Max Planck Institute for Demographic Research (MPIDR) in Rostock, Germany.
2Facultad de CCPP y Sociolog´ıa, UNED, Obispo Trejo, s/n. 28040 Madrid (Spain), [email protected] 3Center on the Economics and Demography of Aging, Dept. of Demography, University of California,
1.
Introduction: Spanish mortality during the XXth century
Spanish population has one of the highest life expectancies in the world although its Mortality Transition started later than many other countries in Europe (Nadal, 1976). The Spanish Mortality Transition started over two centuries ago, but most of the progress has occurred in the XXth century. What began as a steady and measured change accelerated sharply after the turn of the century as the mortality regime moved into its final health-transition stage (Lerner, 1973; Olshansky and Ault, 1986; Caldwell, 1990; Frenk et al., 1991; Mesléand Vallin, 2002 ).
1.1 Spanish mortality in the European context
Prior to World War II, Spain and many other countries in Southern Europe showed a slower rate of demographic change as compared to Northern Europe. At the end of the War, Europe’s mortality showed a North-South intensity gradient (Caselli and Egidi, 1981; Caselli, 1993; Vallin, Mesl`e and Valkonen, 2001). The post-war period saw the beginning of a process of rapid change, which further accelerated in the 1970s, and which led Spain to catch up and join the top echelon of those Western countries with high life expectancies. At the same time that this rapid improvement was happening in Southern Europe, the political crises in Eastern Europe produced a downturn in mortality improve-ments, creating a new East-West division of the continent with respect to survival (Mesl`e and Hertrich, 1997). We have chosen in our analysis to focus on the last three decades of the XXth century, the time when Spain compares favorably with other low-mortality countries and a time of interesting mortality change throughout Europe.
Table 1: Life Expectancy at Birth (e0), 1990–1999. Included countries are those belonging to the European Union in 1999.
Country Men Women
1990 1999 1990 1999
Austria 72.5 75.1 78.9 81.0
Belgium 72.7 74.4 79.4 80.8
Denmark 72.0 74.2 77.7 79.0
Finland 70.9 73.8 78.9 81.0
France 72.7 74.9 80.9 82.4
German 72.0 74.5 78.4 80.7
Greece 74.6 75.5 79.5 80.6
Ireland 72.1 73.9 80.9 79.1
Italy 73.6 75.6 77.6 82.3
Luxembourg 72.3 74.7 80.1 81.2
Netherlands 73.8 75.3 78.5 80.5
Portugal 70.4 72.0 77.4 79.1
Spain 73.3 75.5 80.5 82.4
Sweden 74.8 77.1 78.5 79.8
United Kingdom 72.9 75.0 80.4 81.9
European Union 72.7 74.8 79.2 80.8
Source: Eurostat
1.2 Development ofe0in the XXth century
The mortality transition starts in Spain with an accelerated decline of infant and child mortality, that occurs in the beginning of the XXth century.4Needless to say, this change
had an important impact on the structure of the population and in the development of society. The first year of life is the most important age group for mortality decline up through the middle of the century, with infant mortality deceleration occurring steadily and continually until the end of the century (G´omez-Redondo, 1992). This key factor led to a younger age structure in the population and, as a consequence, to an increment in the person-years of reproductive and active life. This demographic characteristic is accompanied during the first half of the century by a number of crises that perturbed the trends of ordinary mortality (1918 Influenza, and 1936-39 Civil War, see Figure 1).
4In some regions of Spain this process started in the XIX century, but the crises and epidemics during the
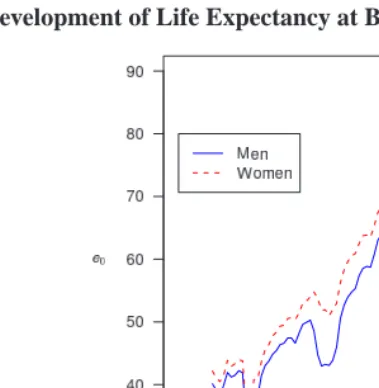
Figure 1: Development of Life Expectancy at Birth (e0) in Spain, XXth Century.
Source: Human Mortality Database.
Figure 1 reveals that the change in life expectancy during the XXth century has been sizable. While the steep trend levels out slightly in recent years, there is no evidence that the process has stabilized or reached a plateau. The graph also shows that the difference between the sexes has been increasing. Table 2 quantifies this sex-specific evolution of life expectancy for the Spanish population. As is evident from both the graph and the table, other than at times of war, a sex difference of this order of magnitude (5–7 years of life) does not occur until quite recently. At the beginning of the century, the sex difference reflects mostly differences of a biological nature. Once the trend of the mortality decline stabilizes after the 1950s (overcoming the effects of the Civil War and the post-war period that differentially affected men), the divergence widens from 1960 onward.
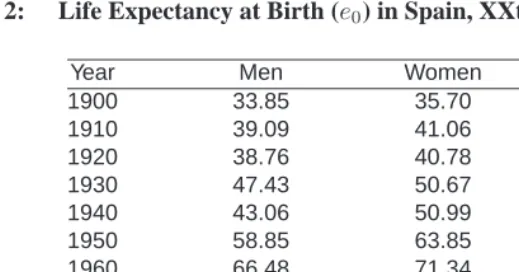
Table 2: Life Expectancy at Birth (e0) in Spain, XXth Century.
Year Men Women Difference
1900 33.85 35.70 1.85
1910 39.09 41.06 1.97
1920 38.76 40.78 2.03
1930 47.43 50.67 3.24
1940 43.06 50.99 7.93
1950 58.85 63.85 4.99
1960 66.48 71.34 4.87
1970 68.79 74.34 5.55
1980 72.01 78.25 6.23
1990 73.34 80.47 7.13
2000 75.51 82.45 6.95
Source: For 1900, Tablas de mortalidad de la poblaci ´on Espa ˜nola, INE; for other years, HMD.
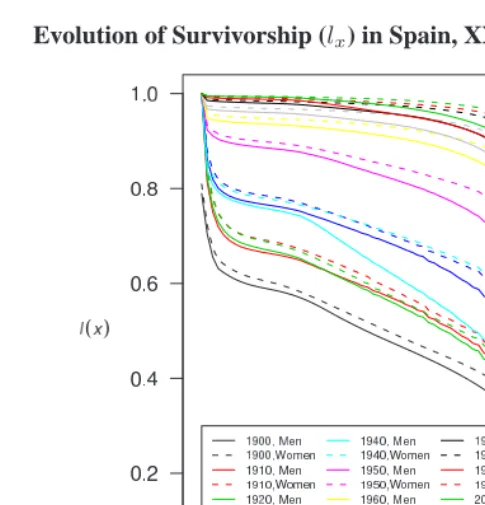
of Spaniards at the older ages relative to the young and a shift to higher ages in the distribution of death.
By mid-century, the level of infant mortality is approximately a quarter of what it was at the beginning, although it remains significant. At this point, we begin to notice the formation of a concentration of deaths in the older ages and zero-level mortality in the working ages. A notable gap in the life span of men and of women begins to become prominent.
By 1970, the contemporary pattern has become clear: mortality is compressed or rectangularized into the older ages, with a clear difference in the survivorship of men and women. At the end of the century, the survival profiles of men lag those of women by nearly 30 years.
2.
Sources and methods
We focus our analysis on the ages and the time periods where there were important contri-butions made to the increase in life expectancy, and consider the role that sex differences play in contributing to the process of change.
Figure 2: Evolution of Survivorship (lx) in Spain, XXth Century.
Source: For 1900, INE; for all other years, Human Mortality Database.
2.1 Data sources
The main source of data is the Human Mortality Database (HMD), which in turn uses as its source the deaths by age and sex from the vital registration Movimiento Natural de
la Poblaci´on, with extra detail from computer tabulations from the Instituto Nacional de Estadistica (INE). The De jure and de facto Populations by Age and Sex were found in the Censos de la Poblacion (INE), with intercensal adjustments made to align the populations
with January 1 of each year.
expe-rience dated July 1. The study looks at the final three decades for which data is available, from 2000–2001 back to 1970–1971.
2.2 Decomposition of life expectancy at birth,e0
The study uses a classic demographic technique, the decomposition of the difference in a summary measure (Kitagawa, 1955), in order to understand the role that age- and sex-specific death rates have had in shaping the evolution of Spanish mortality. In this case we examine life expectancy at birth(e0)as the summary measure of mortality experience.
The method assumes that the summary measuree0depends smoothly upon the
underly-ing age-specific death rates so that the difference in life expectancy,e0(t2)−e0(t1)for
timest1andt2may be expressed as a Taylor expansion around the deaths rates pertaining
att1. There are many variants published for how to perform the decomposition: discrete
(Arriaga, 1982; Andreev, 1982; Andreev, Shokolnikov, and Begun, 2002), continuous (Keyfitz, 1977; Pollard, 1982,1988; Vaupel and Canudas-Romo, 2003), general numeric formulations (Horiuchi, Wilmoth and Pletcher, 2000; Canudas Romo, 2002), and formu-las specific to life expectancy differences. We follow the development of Pollard(1988).
The difference in life expectancies may be expressed exactly as the sum of age-specific effects:
∆e0=e0(t2)−e0(t1) =
Z ∞
0
[µx(t1)−µx(t2)]Txdx=
Z ∞
0
cxdx
whereTx= [lx(t2)ex(t1) +lx(t1)ex(t2)]/2is a weight of average future years lived
be-yond agexthat tells how much influence the mortality rate differential,∆µx= (µx(t1)−
µx(t2)), has on the life expectancy differential, andcxare the age-specific decomposition
components. Empirically, single-year central death rates substitute forµxin the calcula-tion.
The decompositions are made separately for each decade during the 30-year period under study, and separately by sex so that comparisons may be made in the age and sex pattern of contributions to∆e0over time. In this context, the componentscxare given the
interpretation of the attributable gain in life expectancy contributed by each agexduring the period.
3.
Recent changes in the components of life expectancy
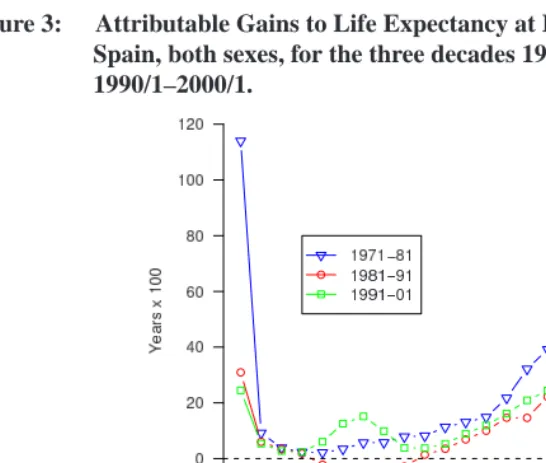
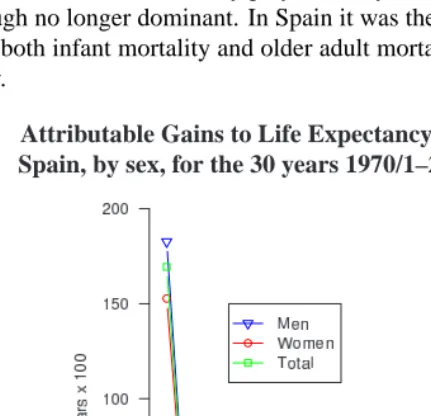
Figure 3: Attributable Gains to Life Expectancy at Birth (e0) in years (x 100), Spain, both sexes, for the three decades 1970/1–1980/1, 1980/1–1990/1, 1990/1–2000/1.
It is important to interpret these profiles and their changes over time in proper context. This is the fourth stage in the process of mortality decline—the period of degenerative and chronic diseases—as described by Olshansky and Ault (1986) that refers implicitly to the progressive delay in mortality at advanced ages. The main characteristics of the process are: (a) the continuation of a slow, but constant, decline; (b) oscillations—and even a decrease—of the most important chronic and degenerative diseases, (c) the onset of important and unexpected infectious diseases as well as variations or changes in violent deaths; and (d) the stabilization or decrease of the differential life expectancy between men and women.
3.1 The continuing role of infant mortality
The tables 3 and 4 show the contributionscxof each age group to the total gain of 7.46 years in life expectancy during each of the last three decades (Table 4, Figure 3) and over the total 30 year period (Table 3, Figure 4). Life expectancy has continuously increased. An important factor for this increase remains, still, the contribution of infant mortality. As was the case for earlier periods of history, it is one of the best indexes to follow the transition of Spanish mortality in the 1971-2001 period. The fundamental influence of infant mortality on life expectancy change that dominates until the 1970s is surpassed by the ever increasing contributions from the elderly; in the 1980s and 1990s, the elderly population occupies the dominant role. During the three periods under study, the gains in life expectancy are accompanied by high contributions from the older age groups, an important factor in the aging of the population (see Figure 5 for the 1971-1981 period; Figure 6 with infant mortality excluded).
We note that unlike other countries in Western Europe, such as France, where infant mortality’s role had been relatively played out by 1970, in Spain the role remains impor-tant, although no longer dominant. In Spain it was the simultaneous and strong contribu-tions from both infant mortality and older adult mortality which led to rapid gains in life expectancy.
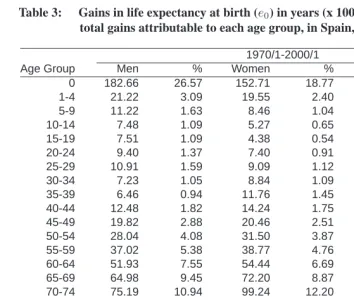
Table 3: Gains in life expectancy at birth (e0) in years (x 100) and proportion of total gains attributable to each age group, in Spain, 1971-2001.
1970/1-2000/1
Age Group Men % Women % Both %
0 182.66 26.57 152.71 18.77 169.37 22.69
1-4 21.22 3.09 19.55 2.40 20.52 2.75
5-9 11.22 1.63 8.46 1.04 9.98 1.34
10-14 7.48 1.09 5.27 0.65 6.47 0.87
15-19 7.51 1.09 4.38 0.54 5.98 0.80
20-24 9.40 1.37 7.40 0.91 8.44 1.13
25-29 10.91 1.59 9.09 1.12 9.79 1.31
30-34 7.23 1.05 8.84 1.09 7.70 1.03
35-39 6.46 0.94 11.76 1.45 8.80 1.18
40-44 12.48 1.82 14.24 1.75 13.26 1.78
45-49 19.82 2.88 20.46 2.51 20.10 2.69
50-54 28.04 4.08 31.50 3.87 28.81 3.86
55-59 37.02 5.38 38.77 4.76 36.77 4.93
60-64 51.93 7.55 54.44 6.69 52.52 7.04
65-69 64.98 9.45 72.20 8.87 67.67 9.07
70-74 75.19 10.94 99.24 12.20 85.71 11.48
75-79 66.24 9.63 110.51 13.58 87.32 11.70
80-84 41.02 5.97 81.89 10.06 61.74 8.27
85-89 20.00 2.91 45.94 5.65 33.39 4.47
90-94 5.99 0.87 13.80 1.70 10.00 1.34
95-99 0.78 0.11 2.31 0.28 1.55 0.21
100+ 0.01 0.00 0.95 0.12 0.50 0.07
TOTAL 687.59 100.00 813.71 100.00 746.39 100.00
Source: HMD.
3.2 Retrogression of health at young ages
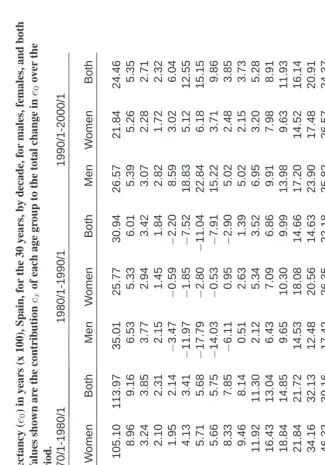
Figure 5: Attributable Gains to Life Expectancy at Birth (e0) in years (x 100), Spain, by sex and age group, for the decade 1970/1–1980/1.
The high mortality among young men from these causes of death is observed in ev-ery European country during the period under study. Nevertheless, the Spanish popula-tion shows distinct features, both in the high intensity as well as in the rapid increase in this phenomenon. These features justify the important backward movement of life ex-pectancy described above. The sources underlying the unusual pattern of mortality of young Spaniards are joint and of several origins, but they feedback and complement each other because they occur during the same years of the Health Transition. The causes of death that generate this change in the trend are basically traffic accidents and AIDS, as well as drug consumption which compounds and exacerbates the effects of the other two causes.
It is helpful to locate these demographic changes within the framework of a wider context of social and economic developments that occurred earlier throughout much of Europe but were delayed in Spain for political reasons and emerged instead in the 1970s and the 1980s. These developments manifested as important changes in economic mod-ernization, notable social mobility, and drastic changes in lifestyles of the population, especially among the young.
Figure 6: Attributable Gains to Life Expectancy at Birth (e0) in years (x 100) , Spain, by sex and age group (excluding group [0-1]), for the decade 1970/1–1980/1.
unemployment that developed throughout the 1980s and 1990s,5and the consequent labor market reforms, disproportionately affected young adults, disrupting the usual pathways of education, experience and effort through which they might realize their aspirations (L´opez Jim´enez, 2002).
Limited prospects for advancement and social exclusion led young people to the carpe
diem of Horace. Surveys conducted between 1987 and 1994 show that between 68-73%
of young people agreed with the statement “the future is so uncertain that it is better to live for today.”
5Unemployment increases in Spain as the result of two parallel crises: first is the international economic
crisis of the 1970s that overlaps in time with a second process, a political upheaval and structural transition in Spain after Franco’s death (1975).
Figure 7: Attributable Gains to Life Expectancy at Birth (e0) in years (x 100), Spain, by sex and age group, for the decade 1980/1–1990/1.
The focus on the present and the disillusion with the future have generated subgroups of frustration and social isolation whose behavior involves alcohol and drug use:
. . . the social exclusion from the process of emancipation, occurring during the day, the night brings new company, mixing its rhythms, nostalgias, and dreams. . . The young people are the tireless pilgrims of the city night. They are generating a seething mass of liturgies which commemorate the vital pre-dominance of the group over the individual. . . . (L´opez Jim´enez, 2002, pp. 126-127)
Part of this ritual involves frequent movement from one bar-discoth`eque to the next, often driving a car across the city or between villages, at night, and often while intoxicated, with frequent automobile fatalities as a result.
Figure 8: Attributable Gains to Life Expectancy at Birth (e0) in years (x 100), Spain, by sex and age group, for the decade 1990/1–2000/1.
3.2.1 Traffic accidents and alcohol consumption
Regarding traffic accidents, during these years the younger generations have had access to private vehicles to a degree never attained by their parents. In contrast with other European countries, the road network in Spain was very poor entering the 1970s. The young were also more likely to drive old or unsafe cars, adding to their accident risk. Moreover, alcohol consumption has had a prominent role in this cause of mortality: the Spanish population has not yet taken to heart the serious consequences of driving while under the influence of drugs or alcohol.6Undoubtedly, alcohol abuse is the main factor in
6“Whoever drinks, does not drive” has a different meaning in every European country. The legal
traffic accidents classified as “human faults.” This kind of mortality is high from middle 1970s and even relatively remains high, even now. The peak in the trend occurs between the middle 1980s and 1991, with a decrease from that point to the present.
The dramatic increase of accidents in the 1980s was so serious a problem that the Spanish Senate appointed a special commission on road safety, resulting in a Social
Agreement on Road Safety, that was signed in 1994 by central and regional authorities.
The number killed diminished by 28% in only two years. Spain was one of several coun-tries in Europe that experienced marked declines in traffic-related mortality in the mid-1990s, but Spain had by far the largest decrease in road accident fatality rate over the 1991-1996 period (SARTRE2, 1998, p. 7).
Men aged 18-29 have the highest incidence of accidents and injuries per accident and they present the highest profile of risk on a variety of behaviour measures related to automobile accidents (SARTRE2). During the last years, there has been a clearly decreasing trend in these incidence rates, although the rates have not stabilised yet; the current rates are similar to those prevailing in the mid-1990s. In the age group 15-29, the mortality rate from traffic fatalities is 35 per 100,000 in men, while it is 9 in women. It is still early to confirm the stabilization of this trend. In the last decade, the whole population rate decreased from 22.7 to 14.3 per 100,000 in 4 years only. Only Portugal (18.4) presents higher rates than Spain now.
3.2.2 AIDS and drugs
HIV/AIDS is the second leading cause of death in young people, and it first appears in Spain, as in the rest of the western world, in 1981. Mortality due to this cause increases up to the middle 1990s among Spanish youth. Initially, most AIDS deaths appear in the young ages. However, as the generation of infected but surviving individuals ages, the age distribution of HIV/AIDS deaths shifts upward toward the young-adult group. In 1995-1997, HIV/AIDS mortality begins to decline with the advent of effective pharmacological therapies and with better preventive measures which lower the disease incidence.
The impact (incidence) of AIDS in Spain has been higher than the rest of Europe throughout almost the entire period.7 AIDS cases at the beginning of the 1980s showed
an increase until 1995. Since then the number of cases decreased to the point that in 2000, the values were about half of those existing just 5 years before (INE, Anuario Estad´ıstico, 2004).
7With up to 188 per million affected inhabitants, Spain has very high incidence, exceeding other high
Drug use had a very prominent role in this cause of death. AIDS in Spain mainly is transmitted intravenously by the sharing of contaminated heroin needles, and this clearly influences the evolution of this epidemic.
During the 1980s heroin use becomes epidemic. Before that time, drug consumption in Spain was very low, and heroin became fashionable for certain societal groups as a way to break with the cultural models of the past. Unfortunately, neither consumers nor the authorities were able to understand and anticipate the consequences of this consumption. This context explains why during the 1980s the major transmission pathway of AIDS was through intravenous drugs (Elzo et al., 1999). The social alarm generated by heroin addiction drove the following young generations to focus their interests instead on to more “aseptic drugs” such as ecstasy, inhaled cocaine, amphetamines, or to legally accepted drugs such as alcohol.
The standardized death rate by AIDS in 1995 was 14 per 100,000 inhabitants, but in men these values balloon up to 25 (WHO, 2004). In the following three years, rates decreased rapidly to the point that in 1998 the rate was 5 for the whole population and less than 10 for men. The steep rate of decrease has leveled off in more recent years.
The highest AIDS mortality rates are found predominantly in young adults males. Peak values occur in the group 30-34, followed by the adjacent age groups, 25-30 and 35-40. In 1993, there were 76 deaths among males aged 30-34 representing around 34% of the total deaths in that age group. The rates in adjacent age groups totaled 44 (21% of total deaths). In those years HIV/AIDS was the leading cause of death for the population 25-44 years old (Ministerio de Sanidad y Consumo, 1997).
The subsequent change in drug consumption habits (to other, non-intravenous, ones), the use of disposable needles, together with other preventive measures to fight the disease, have resulted in a decrease in AIDS-related mortality.8,9
In summary, the superposition in time of the two important causes—traffic accidents and AIDS—produced the rapid upswing in mortality and consequently a decade of
im-8The pattern of HIV/AIDS mortality among young Spanish men can be related also to Spain’s proximity
to the North of Africa and to its role as a natural gateway for South American drug trafficking. Spain is therefore a choice route for distributing drugs to the rest of Europe. Complimenting this situation of a readily available supply of drugs is the socio-economic point of view: the process of development and mod-ernization creates a byproduct of transitional and marginal living areas, especially in poor urban outskirts, where drugs circulate easily among young people. These youth are often the children of immigrant fami-lies who moved to the cities in the 1950s and 1960s with great expectations, but whose lack of education, opportunity, or skills in the current economy have encouraged poverty and unemployment.
9The context described above and the cultural and socio-economic atmosphere in which Spanish youth find
portant losses in years of life of young men. Finally, the subsequent and simultaneous decline in these causes produced a positive contribution at young ages to the increment of life expectancy in the Spanish population.
3.3 Expectation of life at old ages
The profiles of contributions in Figures 5-8 and Tables 3,4 show that the most important contributions to changes in life expectancy at birth (e0) come from the elderly. We now
examine the contributions made to changes in life expectancy at older ages. The age profile of the components of change in remaining life expectancy of the elderly follow proportionately the same age profile as the change components of life expectancy at birth, for all ages greater than age 65. The same decompositioncxfrom section 2.2 may thus be used for insight into which age groups most influence a time change ine65. Primarily, the
contributions to a change ine65are concentrated at ages less than 90 years; gains after that
age contribute little, but matter for the growth and age structure of the elderly population in general. For men, we find the highest gains in life expectancy at age 65 to come from the “younger old” group. For women, the peak in contributions occurs for both “young old” and “old old” ages, occurs at higher ages than for men, and the level of gains exceed those of men at ages 70 and above. In the most recent decade, contributions from ages 90+ have an upward trend. The oldest-old is a faster growing segment of the population in most developed countries than in Spain, and role of the age 90+ contributions will become increasingly important with time. This tendency started in Spain at the end of the period under study.
The mortality rates prevailing in the older ages groups are the consequence of several processes that combine age and cohort effects. The generations born at the beginning of the XXth century experienced conditions early in their life cycle very different from those characteristic of industrialized societies today. These generations lived amid fre-quent epidemics, wars, and economic crises, experiences which select out the strong to survive to old age. Now in their senior years, these cohorts, affected mostly by chronic and degenerative diseases further benefit from advances in medicine, public health, and welfare state.
3.4 Sex differences
Differential mortality by sex translates into 6-7 years of higher life expectancy for women compared to men (Vallin, 2002; Table 2). In the notation of section 2.2, the change between decades in the sex difference in life expectancy at birth may be computed as the difference between the change components for women and the change components for men,∆fe
expectancy begin to diverge between the sexes during the 1980s and 1990s (Figures 7,8). It is worthwhile to point out that although we do not measure directly the contribution of being ‘male’ or being ‘female’ to changes in combined-sex life expectancy, we do have an indirect measure, since we can see the groups by sex and age that have contributed the largest gains to life expectancy change, with each sex taken separately. Actually, the highest contributions to the increment in life expectancy for the Spanish population are in old age groups from cohorts who experience the most dramatic differences between men and woman during their life cycles.
It is noteworthy that half or more of the contributions to the life expectancy time-differential comes from groups over 50 years old, and, for women is primarily concen-trated in ages above 70 (cf. Table 4). Thus when comparing the ‘male’ and ‘female’ patterns of contribution, the pattern for women should be given more weight at the higher ages than the pattern for men. Because sex differentials in mortality are large at the older ages, the larger proportion of those surviving to older ages are women, leading to a “fem-inization” of the adult and elderly population.
This observation is related to the idea that the concept of health and risk are social constructs. In particular, this applies to high-risk behavior, and is especially relevant in the case of male groups from cohorts who experience important changes in their social context.
An exception to the importance of contributions beyond age 50 and behavior as a cause of sex differentials is that of the group below 1 year. Infant mortality continues to decline for both sexes, which raises the overall life expectancy and hence magnifies any absolute sex differences in that life expectancy over time. However, a large share of infant mortality is determined by biological differences between male and female infants that remain fixed over time.
As final consideration, we might consider sex a biological characteristic, but use
gen-der as a social manifestation. It is an organizing principle in every society and it varies
with time and in space.
4.
Present trends in the gains of life expectancy
During the period 1990-2001 the average life of Spaniards increased by more than 2 years, both in men and in women (Table 4). This figure encompasses important changes in the age groups and sex which contribute to this life expectancy increment (Figure 8).
The positive increase in life expectancy contributionscxat all age groups is specially noteworthy in the elderly, and, more specifically, between 70 and 90 years of age. This has been the situation up until recently, but there is a new small shift in the age profile toward the 95 years group in the last decade.
An indirect observation derived from the analysis of the changes in the components of the life expectancy is that the limits for human longevity in Spain are further away every day (G´omez-Redondo and Boe, 2004). Every available index, including those discussed before as well other measures of central tendency, rectangularization, and compression (inter-quartile range, standard deviation, median of distribution) points to an irreversible trend from the 1970s on.
An important change in the trend is caused by the disappearance of the high mortality of young men due to avoidable causes that was a signature phenomenon during the 1980s. Absent this mortality, in the 1990s the recovered gains show up in young and young-adult men. In general terms, the years of life contributed by men at each age are important and higher than those from women, with only one exception. This exception is for women over 70 years old. These women still contribute 40% of the increment of the Spanish life expectancy for women, increasing the number of the oldest old. Do men’s higher contributions mean that we are currently seeing the onset of a convergence in sex-specific life expectancy trends? Or is it just a transient period limited to recovering the losses of men during the 1980s? It is too early to answer this question, but the change is at least inducing a movement toward stability, and a narrowing of the gap between men and women.
It is probably worthwhile to mention here that we are describing gains and not intensi-ties, as differential mortality by sex continues to benefit women. They continue recovering from the century a lost biological advantage that, together with healthier behavior and dif-ferent life conditions, have also guaranteed a social advantage in front of death (Waldron, 1983, Vallin, 2002).
Looking to the future, after the gains in life expectancy from the decline of diseases of the circulatory system in the 1970s and 1980s, future increments will depend upon progress against cancers in this population, except for the contingency of the appearance of new diseases, as it happened with the AIDS pandemic. This is relevant in Spain for two reasons. First, the Spanish population has a lower incidence of diseases of Circu-latory System and Neoplasms than the European average. Second, according to several authors (Peto, et al., 1994; Pampel, 2002a,b; Lopez, 1983,1995), lung cancer and its evo-lution will be a decisive factor in life expectancy. Unfortunately the habits of the female population as depicted by Health and Drug Consumption Surveys suggest an undesirable transition toward increased mortality in Spanish women (G´omez Redondo, et. al., 2002). These habits were introduced into the female population, after a time lag compared to other countries. Accordingly, this will delay their effects in Spain compared with those countries.
5.
Conclusion
The Spanish population is characterized by high Life Expectancy and high Longevity. Spain reached this situation by undergoing important structural changes in its mortality regime. Mortality at the beginning and at the end of the XXth century shows very differ-ent profiles. Even if we consider only the last 30 years of this period, when we examine the age- and sex-specific gains to the average life lived, it is evident that there are present demographic processes of socio-demographic importance: aging at the top of the popu-lation age pyramid, owing to the gains at older ages, as well as the “feminization” of the elderly, as a consequence of the sex differential in the contributions to life expectancy.
Other important aspects to take into account are (a) the permanence of infant mortality as a factor of prime importance in the gains to life expectancy, together with (b) the appearance or disappearance of unexpected or avoidable causes of death related to the behavior of young adults, such as the epidemic of “anticipated” deaths during the 1980s.
6.
Acknowledgments
References
Andreev, E.M..(1982). “Method Komponent v Analize Prodoljitelnosty Zjizni” (The Method of Components in the Analysis of Length of Life). Vestnik Statistiki 9: 42–47.
Andreev, E. M., V. Shokolnikov, And A.Z. Begun (2002) “Algorithm for Decomposition of Differences Between Aggregate Demographic Measures and Its Application to Life Expectancies, Gini Coefficients, Health Expectancies, Parity-Progression Ra-tios and Total Fertility Rates.” Demographic Research 7: 499–522.
www.demographic-research.org
Arriaga, E. (1982) “A note on the use of temporary life expectancies for analyzing changes and differentials of mortality” Manila ed. Geneva: World Health Orga-nization.
Caldwell, J. C. (1990) Introductory thoughts in health transitions, in Caldwell, John C.; Findley, Sally; Caldwell, Pat; Santow, Gigi; Cosford, Wendy; Braid, Jennifer; Broers-Freeman, Daphne. (ed.), What we Know about health transition: the cul-tural, social and behavioural determinants of health, p.VI-XIII.- Canberra, Health Transition Centre, Australian National University: vol 1 (2) : XIX + 1499
Canudas Romo, V. (2003) Decomposition Methods in Demography. Ph.D. dissertation., Rijksuniversiteit Groningen.
Caselli, G. (1993) National Differences in the Health Transition in Europe, The History of Registration of Causes of Death Conference. Indiana Memorial Union Indiana University, November, 11-14, 1993.
Caselli, G.; Egidi, V. (1981) Nouvelles tendences de la moralit´e en Europe ´Etudes de-mographiques, 5, Conseil de l’Europe, Strasbourg
Elzo, J., Orizo, F.A; Gonz´alez-Anleo, J, Blasco, P.G., Laespada, M.T, Salazar, L., (1999), J´ovenes Espa˜noles, Fundaci´on Santa Mar´ıa, S.M., Madrid
Frenk, J.; Bobadilla, J.L.; Stern, C,; Frejka, T.; Lozano, R. (1991) “Elements for a Theory of the Health Transition,” Health Transition Review, 1 (1): 21–38.
G´omez Redondo, R.(1995) “Vejez prolongada y juventud menguada. Tendencias en la evoluci´on de la esperanza de vida de la poblaci´on espa˜nola, 1970–1990.” Revista
Espa˜nola de Investigaciones Sociol´ogicas, 71:79–108
G´omez-Redondo,R.; Jim´enez-Aboitiz, R.; Callejo, J.; Robles, E. (2002) “Ocupaci´on y Salud. Un an´alisis de la desigualdad social”, Sistema, 168-169 : 195-220
G´omez-Redondo, R.; Boe, C. (2004) “Tendencias de mortalidad en la poblaci´on espa˜nola: Longevidad creciente, juventud recuperada y hacia la convergencia por sexo,” Fun-dacion Abril Martorell, p. 101-129
Horiuchi, S.; Wilmoth, J. R.; Pletcher , S. D. (2000) A General Method of Decomposition
Analysis. Manuscript.
Human Mortality Database. University of California, Berkeley (USA), and Max Planck Institute for Demographic Research (Germany). Available atwww.mortality.org orwww.humanmortality.de(data downloaded June, 2004)
Instituto Nacional de Estad´ıstica, Inebase:www.ine.es/Inebase/index.html
Instituto Nacional de Estad´ıstica (2001) Proyecciones de la poblaci´on de Espa˜na cal-culadas a partir del Censo de Poblaci´on de 1991. Evaluaci´on y revisi´on. Total Nacional 1990-2050. Comunidades Aut´onomas y provincias, 1990-2005
Instituto Nacional de Estad´ıstica (2001, 2003) Anuario Estad´ıstico 2001, 2003 (edi-ciones CD-Rom), Madrid
Instituto Nacional de Estad´ıstica (2001) Indicadores Sociales de Espa˜na, Madrid.
Instituto Nacional de Estad´ıstica, (various years) Defunciones seg´un la causa de muerte, Movimiento Natural de la Poblaci´on. Resultados Nacionales. Madrid
Instituto Nacional de Estad´ıstica (various years) Tablas de Mortalidad de la Poblaci´on Espa˜nola, Madrid.
Keyfitz, N. 1977. Applied Mathematical Demography New York: Wiley.
Kitagawa, E.M. (1955) “Components of a difference between two rates”, Journal of The
American Statistical Association vol. 50, 272:1168-1194.
Lopez, A.D. (1983) “The sex mortality differential in developed countries” In Lopez and Ruzicka (eds.), Sex Differentials in Mortality:Trends, Determinants and Con-sequences. Canberra: Australian National University.
Lopez, A. D. (1995) “The lung cancer epidemic in developed countries: From Descrip-tion to ExplanaDescrip-tion.” In Lopez, A.; Caselli, G. and Valkonen, T. Adult Mortality in Developed Countries, Oxford: Clarendon Press.
L´opez Jim´enez, A. (2002) “Youth in the 1990s and Youth in the 1960s in Spain: Intergen-erational dialogue and struggle” in Edmunds and B.S. Turner (eds.), GenIntergen-erational Consciousness, narrative, and politics, Rowman and Littlefield, Maryland.
Mesl´e F.; Hertrich, V. (1997) “ ´Evolution de la mortalit´e en Europe : la divergence s’accentue entre l’Est et l’Ouest,” in :International Population Conference, Beijing 1997. p. 479-508. Li`ege, IUSSP.
Meslé, F., Vallin,J. (2002) “La transition sanitaire: tendances et perspectives”, in Caselli, G., Vallin, J. and Wunsch, G., Demographie: Analyse et synth`ese. Les D´eterminants
de la Mortalit´e. Vol. III, Ch. 57, Institut d’ ´Etudes D´emographiques, Paris
Nadal, J. (1976) La Poblaci´on Espa˜nola (siglos XVI a XX), Barcelona, Ed. Ariel
Olshansky, S. J.; Ault, A. B. (1986) “The fourth stage of the Epidemiological Transition: the age of delayed degenerative diseases,” The Milbank Quarterly, vol. 64, 3: 355-391
Pampel, F. C. (2002a) “Cigarette Use and the Narrowing Sex Differential in Mortality,”
Population and Development Review, vol. 28, 1: 77-104.
Pampel, F. C. (2002b) “Inequality, Diffusion, and the Status Gradient in Smoking,”
So-cial Problems, vol. 49, 1: 35-57.
Peto , R.; Lopez,A.D.; Boreham, J.; Thun, M.; and Heath, C. Jr. (1994) Mortality from Smoking in Developed Countries 1950-2000: Indirect Estimates from National Vi-tal Statistics. Oxford University Press.
Pollard, J. H. (1982) “The Expectation of Life and its Relationship to Mortality,” Journal
of the Institute of Actuaries 109, 225-240.
SARTRE2 (1998) Part 1: Report on Principal Results. The attitude and behaviour of
European car drivers to road safety Social Attitudes to Road Traffic Risk in Europe
(SARTRE).
sartre.inrets.fr/documents-pdf/repS2V1E.pdf
Vallin, J.; Meslé, F.; Valkonen, T. (2001) Tendances en mati`ere de mortalit´e et mortalit´e diff´erentielle, Etudes d´emographiques, 36, Council of Europe, Editions du Conseil de l’Europe, Strasbourg
Vallin,J. (2002) “Mortalit´e, Sexe et Genre,” in Caselli, G., Vallin, J. and Wunsch, G.,
Demographie: Analyse et synth`ese. Les D´eterminants de la Mortalit´e. Vol. III, Ch.
53, Institut d’ ´Etudes D´emographiques, Paris
Vaupel, J.W.; Canudas-Romo, V. (2003) Decomposing change in life expectancy: a bouquet of formulas in honour of Nathan Keyfitz’s 90thbirthday. Demography 40, no. 2:201-216.
Waldron, I. (1983) “Sex differences in Human Mortality: The role of genetic factors,”
Social Science and Medicine, vol 17, 6:321-333
Wilmoth, J. (1997) “In search of limits” in Wachter, K.; Finch, C.E. (eds.), Between Zeus
and the Salmon: The Biodemography of Longevity, National Research Council,
National Academy Press, Washington, D.C, 1997
Wilmoth, J.; Deegan, L.; Lundstrom, H.; Horiuchi, S. (2000) “Increase of Maximum Life-Span in Sweden, 1861-1999,” Science, vol. 289, pp. 2266-2368.
World Health Organization, Regional Office for Europe (2004). Burden of disease, Highlights on health, Spain, 2004.

![Figure 6:Attributable Gains to Life Expectancy at Birth (e 0 ) in years (x 100) ,Spain, by sex and age group (excluding group [0-1]), for the decade](https://thumb-us.123doks.com/thumbv2/123dok_us/8942193.1851561/15.612.109.348.111.322/figure-attributable-gains-expectancy-birth-spain-excluding-decade.webp)
