R E S E A R C H
Open Access
Detecting protein complexes from active protein
interaction networks constructed with dynamic
gene expression profiles
Qianghua Xiao
1,2, Jianxin Wang
1*, Xiaoqing Peng
1, Fang-Xiang Wu
1,3From
IEEE International Conference on Bioinformatics and Biomedicine 2012
Philadelphia, PA, USA. 4-7 October 2012
Abstract
Background:Protein interaction networks (PINs) are known to be useful to detect protein complexes. However, most available PINs are static, which cannot reflect the dynamic changes in real networks. At present, some researchers have tried to construct dynamic networks by incorporating time-course (dynamic) gene expression data with PINs. However, the inevitable background noise exists in the gene expression array, which could degrade the quality of dynamic networkds. Therefore, it is needed to filter out contaminated gene expression data before further data integration and analysis.
Results:Firstly, we adopt a dynamic model-based method to filter noisy data from dynamic expression profiles. Then a new method is proposed for identifying active proteins from dynamic gene expression profiles. An active protein at a time point is defined as the protein the expression level of whose corresponding gene at that time point is higher than a threshold determined by a standard variance involved threshold function. Furthermore, a noise-filtered active protein interaction network (NF-APIN) is constructed. To demonstrate the efficiency of our method, we detect protein complexes from the NF-APIN, compared with those from other dynamic PINs.
Conclusion:A dynamic model based method can effectively filter out noises in dynamic gene expression data. Our method to compute a threshold for determining the active time points of noise-filtered genes can make the dynamic construction more accuracy and provide a high quality framework for network analysis, such as protein complex prediction.
Introduction
Proteomics is the most exciting frontier in life science. It becomes one of the hottest research topics in systemati-cally analyzing and comprehensively understanding pro-teins through the study of protein structures, functions, and interactions [1-6]. In particular, identifying protein complexes from protein interaction networks (PINs) plays a significant role in revealing the structure of PINs, predicting protein functions, and explaining parti-cular biological processes.
Most researches on biological networks have been focused on static networks. The static PINs, in which the interactions are accumulated in different conditions and time points, cannot reflect the real dynamic PIN networks in cell, and therefore has certain influence on the accuracy of protein complex prediction. In reality, cellular systems are highly dynamic and responsive to cues from the environments [7], and a real PIN in cell is changing over time, environments and different stages of the cell cycle[8]. In some literature [8-13], the PIN was constructed by using gene expression profiles and sub-cellular localization and other dynamic data. Time-course (dynamic) gene expression data are collected at a series of time point during a biological development
* Correspondence: [email protected] 1
School of Information Science and Engineering, Central South University, Changsha 410083, China
Full list of author information is available at the end of the article
process of interest and thus reflect the dynamic activity of genes during the biological development process.
In those methods[8-13], a threshold is employed to determine whether genes are significantly expressed. Nevertheless, a challenge is how to choose an appropri-ate threshold in order to filter out the noisy gene expression data and retain only genes which are involved in the biological development process. Tang et al. [14] have used a potential threshold to filter out noisy gene expression data. In their method the same value of a pre-defined threshold is applied to all the genes and time points. Therefore, if the minimum of a gene’s expression value is greater than the threshold, the gene is judged to be always active. On the other hand, if the maximum value of a gene’s expression is less than the threshold, the gene is judged to be always inactive. It is clear that this is unreasonable. Wang et al. [15] have recently introduced a 3sprinciple to compute an active threshold for each gene based on their gene expression profiling. As a result, each gene has its own active threshold and a protein is active when its expres-sion levels are more than its active threshold. With the notation that µ and s are the mean and the standard deviation of a gene’s expression levels, respectively, the choice of the term (µ+ 3s) is based on the fact that the probability of the range between±3sin a normal distri-bution is more than 99%. Recall that each gene has its own threshold, which is the different point from the Tang’s method [14].
Although time-course gene expression data provides a dynamic snapshot of most of genes involved in a biolo-gical development process and may lead to better understanding of cellular function, not all genes on microarray are related to the biological process of inter-est. In addition, dynamic gene expression data is often contaminated by various noises or “noisy” genes [16]. Either excluding genes of interest or including “noisy” genes could degrade the significance of any analysis results. The challenge is how to distinguish genes of interest from a whole set of dynamic gene expression data. In this paper, we adopt a dynamic model based method to filter out noises in dynamic gene expression data. Specifically, dynamic gene expression data would be divided into two categories: one is time-dependent while another is time-independent. Time-dependent genes expression data is more likely dynamically deter-ministic than random while time-independent genes expression data is more likely random than dynamically deterministic. Those gene expression data are consid-ered to be noises if they are time-independent and their means are very small.
After the contaminated genes expression data is fil-tered out, in this paper we use a function in the mean
and the standard deviation to compute a threshold for determining the active time points of noise-filtered genes (proteins). Then we construct a noise filtered active protein interaction networks (NF-APIN) of yeast. To evaluate our method, we compare the performance of MCL on NF-APIN and TC_PIN[14] and APPIN[15]. Our proposed methods for constructing NF-APIN is described in Section Method. The computational experi-ments and results are presented and discussed in Sec-tion Experiments and Results. This study is concluded in Section conclusion.
Method
In this section, we first introduce time-dependent model, time-independent model and statistic F-testing. Second, we will introduce our strategies to filter out contaminated gene expression data and deduce the active time points for each protein based on their gene expression data. Last, we construct a noise filter active protein interaction network (NF-APIN) based on the active information extracted from gene expression pro-file and the static PIN.
Time-dependent model
Letx={x1, ..., xm, ...,xM} be a time series of observation values at equally-spaced time points from a dynamic system. AR (autoregressive) model [16] is adopted to analyze the time dependence of gene expression profiles in this paper. This study assumes that the value at time point mdepends on the pastp(< m) time points. The time-dependent relationships can be modeled by an AR model of order p, denoted byAR(p), which is a linear function of the values of previous pobservations plus a term representing possible errors, i.e.,
xm=β0+β1xm−1+β2xm−2+ . . .βpxm−p+εm;m=p+ 1, . . . ,M, (1)
where bi(i = 0, 1, ...,p) are the autoregressive coeffi-cients, and εm (m = p + 1, ..., M) represent random errors, which independently and identically follow a nor-mal distribution with the mean of 0 and the variance of s2
. The system of Model (1) can be rewritten in the matrix form as:
Y=Xβ+ε, (2)
whereY= ⎡ ⎢ ⎢ ⎢ ⎣
xp+1 xp+2
.. . xM ⎤ ⎥ ⎥ ⎥ ⎦,X=
⎡ ⎢ ⎢ ⎢ ⎣
1 x1 · · · xp
1 x2 · · · xp+1
1 ... . .. ... 1xM−p· · ·xM−1
⎤ ⎥ ⎥ ⎥ ⎦,β=
⎡ ⎢ ⎢ ⎢ ⎣ β0 β1 .. . βp ⎤ ⎥ ⎥ ⎥ ⎦,ε=
⎡ ⎢ ⎢ ⎢ ⎣
εp+1
εp+2
.. . εM ⎤ ⎥ ⎥ ⎥ ⎦.
The likelihood function for Model (2) is
L(β,σ2) = (2πσ2)−(M−p)/2exp
If the rank (X) =p+ 1 holds, it has proved [17] that the maximum likelihood estimates ofbands2are
ˆ
β= (XTX)−1XTY (4)
and
ˆ
σ2= ||Y−Xβˆ||2/(M−p). (5)
The value of the maximum likelihood is given by
L(βˆ,σˆ2) = (2πσˆ2)−(M−p)/2e−(M−p)/2. (6)
In Model (2), the matrixX hasp+ 1 columns andM −prows. Thus a necessary condition forrank(X) = p+ 1 isM−p≥p+ 1 orp≤(M−1)/2.
Time-independent model
For a group of observation values which are not pro-duced by the dynamic systems under consideration, but noisy (random) data, one can simply model them by a constant number plus random errors. Letx= {x1, ...,xm, ...,xM} be a series of time independent (random) obser-vations. In agreement with Model (2), the last (M −p) observations can be modeled by
xm=β0+εm,m=p. . .,M, (7)
zwhereb0is a constant number andεm(m = p, ...,M) are the random errors which are subject to a normal dis-tribution independent of time with the mean of 0 and the variance ofσ2
c. The likelihood function for Model (7) is
L(β0,σc2) = (2πσc2)−(M−p)/2exp ⎡ ⎣− 1
2σ2
c M
m=p+1
(xm−β0)2
⎤ ⎦. (8)
The maximum likelihood estimates ofb0and σc2are
ˆ
β0= 1 M−p
M
m=p+1
xm (9)
and
ˆ
σ2
c =
1 (M−p)
M
m=p+1
(xm− ˆβ0) 2
(10)
respectively. The maximum values of the likelihood is given by
Lβˆc,
ˆ
σc
2
= (2πσˆc
2
)−(M−p)/2e−(M−p)/2, (11)
whereβˆcis a (p+ 1) dimensional vector whose first component isβˆ0and others are zeros.
Hypothesis testing
Actually, the time-independent model is also an autore-gressive model with the order of zero and can be viewed
as Model (1) with constraintsbi = 0 (i = 1, ...,p). These constraints can be rewritten in the matrix form as follows
Aβ= 0, (12)
whereA= ⎡ ⎢ ⎢ ⎢ ⎣
0 1 0 · · · 0 0 0 1 · · · 0
· · · . .. ...
0 0 0 0 1
⎤ ⎥ ⎥ ⎥ ⎦.
The likelihood ratio of Model (7) to Model (1) is given by
= L(βˆc,
ˆ
σc
2 )
L(βˆ,σˆ2) = ˆ
σ2
ˆ
σc
2
(M−p)/2
. (13)
As Model (7) can be viewed as a regression Model (1) with the Constraints (12), and the maximum likelihood method is used to obtainσˆ2andσˆc2, the inequality
ˆ
σ2 ≤σˆc
2
comes true. According to the likelihood principle [18], if Λin Formula (13) is too small, Model (1) is preferable, i.e. the series x= {x1, ..., xm, ...,xM} is more likely time-dependent than time-independent. Although Λ in Formula (13) is not a convenient test statistic, it has proved [17] that the statistic
F=M−2p−1
p (
−2/(M−p)−1) = M−2p−1 p
σˆ2
c ˆ σ2−1
(14)
follows anFdistribution with (p, M−2p−1) degrees of freedom when Model (7) is true for a series of obser-vations. WhenF is very large, thus thep-value is very small (Here, thep-value is the probability of obtaining a test statistic at least as extreme as the one that was actually observed, assuming that the null hypothesis is true. One often“rejects the null hypothesis” when the p-value is less than the predetermined significance level), Model (7) is rejected, i.e., observation series x= {x1, ..., xm, ..., xM} is time-dependent. From Formula (14), one can calculate the probability (p-value) that a series of observations is not time-independent. As the regression degree in Model (1) is unknown, thep-values are calculated by Formula (14) for all possible ordersp
(1≤ p≤(M−1)/2). The proposed method calls a gene to be significantly expressed (time-dependent) if one of thesep-values calculated from its expression profile is smaller than a user-preset threshold value.
The steps for constructing noise filtered active protein interaction networks
Filtering noisy genes
time-dependent if it can be best modeled by a non zero-order AR equation, while a gene expression profile is time-independent if it can be best modeled by a zero-order AR equation. A gene will be considered being noise if the gene expression data belongs to time-independent and its mean is very small. Thus, the definition of“small”is very impor-tant. Our strategy is that, firstly all of genes belong to time-independent are sorted ascending by their means of genes expression data. Then, given a threshold value, a gene is considered being noise if the mean of gene expression value is less than the threshold. In this study, genes with the top 15% of the lowest mean are judged as the noisy genes, As a result, the mean threshold is set as 0.5. The reason of choice of 0.5 here will also be further discussed in effect of the coefficientkselection of this paper later on. Filtering gene expression data point
Usually, the threshold in gene expression array is used to differentiate false-positive expressed gene (noise) from true-positive expressed gene[14-27]. Tang et al. [14] have proposed a simple threshold, which returns a constant real number for any gene at any time point. In other words, the common threshold is applied to all the genes at different time points. Although their approach works better than existing methods at that time, the common threshold might be not efficient for all the genes. For example, most proteins with low expression values will be filtered out. Wang et al. [15] have devised a threshold function based on the mean and standard deviation of expression levels of a gene. Their threshold function is defined as follows:
Active threshold=u+ 3σ × (1−F) (15)
F= 1
1 +σ2 (16)
For each gene, u and sare the mean and standard deviation of its expression values. If the fluctuation of expression values is high, corresponding to a high value of s and thus small F, the threshold may be greater than its all expression values. In other words, some pro-teins with high fluctuation will be filtered out.
In this subsection, we describe a way to determine whether a protein at a time point is active from dynamic expression levels of the corresponding gene. Our threshold function is described as follows:
Active threshold = u+kσ × (1−F) (17)
Three standard deviations include about 99% of all observations. On the other words, in normal case only less than 1% of the time point may be active. In summary, in the same case, the threshold by using parameterk ×s
is less than by using parameter 3s. More gene expressing profiles will be retained. TheActive_thresholdis calculated
by Formula (17) for all possible values k(0≤ k≤ 3). In this paper the value of coefficientkis selected as 2.5. The reason of why select 2.5 as the value of coefficient
kwill be discussed in the sectioneffect of the coefficient k selectionof this paper later on.
Construction of NF-APIN
Two proteins interacted in the static PIN may not interact with each other all the time in a dynamic network, because they may not always active at the same time. Dynamic net-work aims at reflecting dynamic interactions between pro-teins, which are changing with time and condition. The dynamic interactions are determined by the dynamics of protein activity. If the expression level of a gene is over its active threshold at a time point, the corresponding pro-tein is regarded as active at the time point. For each time point, if two proteins interacted with each other in the static PPI network are active at the same time point, the proteins and their interaction form a part of NF-APIN at the time point. The process is repeated until the NF-APIN is created.
Experiments and results
In this section, we first construct an NF-APIN. Then we compare the efficiency of three dynamic network, NF-APIN, APPIN (Wang et al., [15]) and TC-PIN (Tang et al., [14]), by applying a clustering method to identify protein complexes.
Material
the cycles are successive, we use one cycle with average expression value of every time point of three cycles to computeActive_thresholdand determine if a gene is active at a time point.
Network construction
In TC-PIN [14], a potential threshold is set as 0.7, and for all the genes the gene expression levels at different time points are compared with it. A protein is considered to be expressed at a time point when the gene expression level of its corresponding gene is greater than the thresh-old; otherwise, the protein is considered to be unex-pressed at the time point. For each time point, there is a subnetwork which is constituted by the interactions derived from the static PIN, the protein pairs of which are both expressed. Similar with TC-PIN, APPIN [15] contains subnetworks of each time point. The difference is that APPIN [15] uses an active threshold to determine the active time points for each protein according to the characteristics of its gene expression curve, rather than a global threshold. In the construction of NF-APIN, we divide gene expression profiles into two categories by using time-dependent model and time-independent model. In our experiments, the value of order pis up to 6 in AR model and thep-value is equal to 0.01 inF -testing. 19.4% gene expression profiles is time-dependent, 80.6% gene expression profiles is the time-independent. About 15% genes belong to time-independent are iden-tified as noisy genes because of their small means.
Active_thresholdis calculated by Formula (17). For all possible values k (0≤k≤ 3), k is selected as 2.5 in our experiment. Since many proteins are not active at the same time point resulting a small subset of efficacious interactions at the time point, these subnetworks in NF-APIN contains 646 nodes and 1101 edges on average while those in APPIN contains 776 nodes and 1281 edges on average and in TC-PIN contains 3558 nodes and 16961 edges on average. Compared with APPIN and TC-PIN, the average numbers of nodes and edges of the subnetworks of TC-PIN are about 5.5 times and 15.4 times than those of NF-APIN, and the average numbers of nodes and edges of the subnetworks of NF-APIN are a little less than those in APPIN.
Effect of the coefficientkselection
In this paper, we assume unlike in [15] that a protein might be active if its corresponding gene expression values are greater than its mean, plus less than three standard deviations. Instead, we consider that the value of the coefficient kis greater than or equal to 0 and less than or equal to 3. To investigate the effect of values ofk, we conduct experiments in various values ofkand the mean. Specifically, the coefficientkranges from 0 to 3 with the increment of 0.1 and the mean ranges from 0 to 1 with
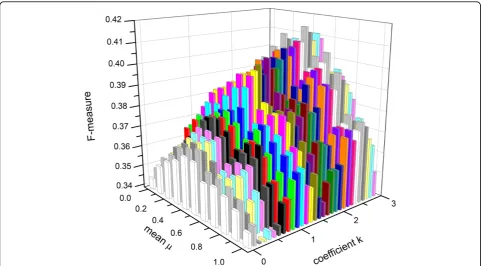
the increment of 0.1 too. As the coefficientkrises, the
Active_thresholdalso rises. With the increasing number of filtered genes, the number of the new functional modules also increases. As shown in Figure 1, it can be seen that when a mean value falls within the region from 0.4 to 0.6, the value off-measure of MCL is achieved to an optimal result in a fixed coefficientk. In other words, the number of noisy genes filtered out achieves to an optimal result. At the same time, it can be seen that when the value of coefficientkis in the vicinity of 2.5, the value off-measure of MCL is achieved to an optimal result. Therefore, 2.5 is chosen as the coefficientkin our study.
Comparison with the known complexes
The Markov Cluster algorithm (MCL) [30,31] is a clus-tering method by simulating a flow on the graph by cal-culating successive powers of the associated adjacency matrix, and is applied to extracting clusters from the graph. MCL is robust clustering algorithms[32,33], therefore it can be applied to evaluate the efficiency of different networks without bias. Wang et al. and Tang et al. have applied MCL to identify protein complexes. We also apply MCL to identify protein complexes, and compare the performances of MCL on NF-APIN, TC-PIN, and APPIN. For three dynamic networks, each of them contains 12 subnetworks. For each dynamic PIN, we first apply MCL to predict complexes on each subnetwork, then combine the prediction complexes based on a overlap strategy. There are 408 benchmark complexes considered as the gold standard data [34]. Table 1 lists the number of complexes predicted by MCL on each dynamic network, the number of known complexes matched by clusters whenOS≥0.2 orOS≥1. Other metrics, such as sensi-tivity, specificityandf-measure, respectively whenOS≥0.2 [35-37], are also compared in Table 1. It is easy to find out
the sensitivityof MCL achieved on NF-APIN is much
higher than that on TC-PIN 2. while it is slightly less than that on APPIN. Remarkably,specificityandf-measure of MCL achieved on NF-APIN are much better than those achieved on other two dynamic networks.
Go function enrichment analysis
The GO function enrichment analysis is used to evaluate the functional relevance of the clusters predicted from PINs with ap−value. In our experiments, thep−value
[37-39] of clusters are calculated by a tool, GO Term Finder (http://www.yeastgenome.org). A predicted protein complex is considered to be significant if its P-value
p−valueare calculated in five different intervals:<E-15), [E-15, E-10), [E-10, E-5), [E-5, 0.01) and≤0.01. Table 2 shows that the total ratio of significant protein complexes predicted from NF-APIN is up to 42% in aspect ofB.P., which is higher than APPIN and TC-PIN. It demonstrates that the protein complexes predicted from NF-APIN are more enriched with the functions of biological process, which also indicates the better quality of NF-APIN.
Comparison in accuracy
For each predicted protein complex, theprecision, recall
and F − score are calculated for the function it be
assigned.F−score is defined as the ratio of the square of the geometric average of precision (p)[40] and recall (r) to their arithmetic average, which is used to evaluate the accuracy of the complex identified from PIN. The
Gene Ontology contains three domains: Biological Process (B.P.), Cellular Component (C.C) and Molecular Function (M.F.). In this subsection, we compare the average accura-cies of predicted protein complexes onB.P.,M.F. andC.C
on each dynamic network. As is shown in TABLE 3, the accuracy of each domain of protein complexes predicted on NF-APIN is better than that on APPIN and TC-PIN.
Conclusion
This paper first presents a dynamic model-based approach to distinguish time-dependent gene expression data from time-independent gene expression data. In the proposed method, a time-course gene expression profile is described by an autoregressive model. The order of autoregressive model, the mean of genes expression data andkmay changes with different genes, therefore all possible order,
Table 1 The Performance Comparison of MCL on three dynamic networks.
Network #P C #M KC
(OS= 0.2)
#M KC
(OS= 1)
Sn Sp F
NF-APIN 1686 235 33 0.738 0.289 0.415
APPIN 2013 256 37 0.773 0.257 0.386
TC-PIN 2034 220 23 0.696 0.212 0.326
OSis the overlapping score, #PCis the number of clusters predicted by MCL in each network, and #MKCis the number of known complexes matched by clusters whenOS≥0.2 orOS≥1. The sensitivity, specificity andf-measure are listed in the table whenOS≥0.2.
Figure 1f-measure of MCL aboutkfrom 0 to 3, the interval is 0.1. Figure 1 shows how the different values of coefficient k and mean adopting in the refinement effect f-measure. the coefficient k ranges from 0 to 3 with the increment of 0.1 and the mean ranges from 0 to 1 with the increment of 0.1 too.
Table 2 Functional Enrichment (B.P.) of the Identified Clusters.
<E-15 E-15 to E-10 E-10 to E-5 E-5 to 0.01 ≥0.01
NF-APIN 0.4% 1.5% 14.3% 25.4% 58.4%
APPIN 0.3% 1.1% 8.2% 28.3% 61.9%
TC-PIN 2.3% 3.5% 11.9% 23.5% 58.8%
reasonable mean and reasonablekof the autoregressive models are tested in this work. Based on these results, we further devise a method for selecting active proteins at each time point, in which the active threshold for each protein is calculated by a function with the mean and the standard deviation of their corresponding gene expression data. Finally a NF-APIN is constructed by incorporating static PINs with selected active proteins, which is consisted by a number of subnetworks. To investigate the quality of NF-APIN, we apply a clustering method on NF-APIN to detect the protein complexes, and compare it with its competing dynamic networks, APPIN and TC-PIN. The results in TABLE 1-3 illustrates that NF-APIN is a more precise and biological network for detecting protein com-plexes than other dynamic networks. The superior perfor-mance on NF-APIN can attribute to the accurate active protein information and efficacious interactions based on our presented dynamic model-based approach.
Besides complex prediction, NF-APIN can be also applied for other network analysis, such as pathway inference, essential protein, protein function, and disease diagnose and prediction. With more and more PINs and gene expression data under special environments of other species available, we can construct NF-APINs for different species with different research purposes. With more and more dynamic information, we can construct NF-APINs for different research purposes. In addition, we also need more direct information about proteins in biological experiments to validate and support our method and to improve accuracy of filtering noisy data. In further study, we will employ this strategy to investigate protein networks of other species and gene expression arrays under special environments.
Competing interests
The authors declare that they have no competing interests.
Authors’contributions
QX and JW obtained the protein-protein interaction data and gene expression data, generated the prediction model and drafted the manuscript. QX and XP performed experimental comparison and evaluated the results. JW, QX, FW initiate the study and write the manuscript. All authors have read and approved the final manuscript.
Acknowledgements
This work is supported in part by the National Natural Science Foundation of China under Grant No. 61232001, No. 61128006, No. 61073036.
Declarations section
The publication costs for this article were funded by the corresponding author This article has been published as part ofProteome ScienceVolume 11 Supplement 1, 2013: Selected articles from the IEEE International Conference on Bioinformatics and Biomedicine 2012: Proteome Science. The full contents of the supplement are available online at http://www.proteomesci. com/supplements/11/S1.
Authors’details 1
School of Information Science and Engineering, Central South University, Changsha 410083, China.2School of Mathematics and Physics, University of South China, HengYang 421001, China.3Division of Biomedical Engineering, University of Saskatchewan, Saskatoon, Canada.
Published: 7 November 2013
References
1. Gavin AC, Aloy P, Grandi P,et al:Proteome survey reveals modularity of the yeast cell machinery.Nature2006,440:631-636.
2. Rual JF, Venkatesan K, Hao T,et al:Towards a proteome scale map of the human protein-protein interaction network.Nature2005,437:1173-1178. 3. Ptacek J, Devgan G, Michaud G,et al:Global analysis of protein
phosphorylation in yeast.Nature2005,438:679-684.
4. Eisenberg D, Marcotte EM, Xenarios I,et al:Protein function in the post-genomic era.Nature2000,405:823-826.
5. Aittokallio T, Schwikowski B:Graph-based methods for analysing networks in cell biology.Brief Bioinform2006,7:243-55.
6. Zhu X, Gerstein M, Snyder M:Getting connected: analysis and principles of biological networks.Genes Dev2007,21:1010-24.
7. Jin R, Mccallen S, Liu C, Xiang Y, Almaas E, Zhou XH:Identify Dynamic Network Modules with Temporal and Spatial Constraints.Pacific Symp on Biocomputing2009,14:203-214.
8. Teresa MP, Mona S, Donna KS:Toward the dynamic interaction: it’s about time.Briefings in Bioinformatics2010,11:15-29.
9. Svetlana Bulashevska, Alla Bulashevska, Roland Eils:Bayesian statistical modelling of human protein interaction network incorporating protein disorder information.BMC Bioinformatics2010,11:46.
10. De Lichtenberg U, Jensen LJ, Brunak S,et al:Dynamic complex formation during the yeast cell cycle.Science2005,307:724-27.
11. Komurov K, White M:Revealing static and dynamic modular architecture of the eukaryotic protein interaction network.Mol Syst Biol2007,3:110. 12. Han JJ, Bertin N, Hao T:Evidence for dynamically organized modularity in
the yeast protein-protein interaction network.Nature2004,430:88-93. 13. Bossi A, Lehner B:Tissue specificity and the human protein
interactionvnetwork.Mol Syst Biol2009,5:260.
14. Tang X, Wang J, Liu B, Li M, Chen G, Pan Y:A comparison of the functional modules identified from time course and static PPI network data.BMC Bioinformatics2011,12:339.
15. Wang J, Peng X, Li M, Luo Y, Pan Y:Construction and application of dynamic protein interaction network based on time course gene expression data.Proteomics2013,13:301-312.
16. FX Wu, ZH Xia, Mu L:Finding significantly expresses genes from time-course expression profiles.International Journal of Bioinformatics Research and Applications2009,5(1):50-63.
17. Harvey AC:Time service ModelsCambridge, MA:MIT Press; 1993.
18. Seber GAF, Lee AJ:Linear Regression Analysis.2 edition. Hoboken, N.J: Wiley; 2003.
19. Amoutzias G, Van de Peer Y:Single-Gene and Whole-Genome Duplications and the Evolution of Protein-Protein Interaction Networks, Gustavo Caetano-Anolles.Evolutionary genomics and systems biologyWiley; 2010, 413-429.
20. De Lichtenberg U, Jensen LJ, Brunak S,et al:Dynamic complex formation during the yeast cell cycle.Science2005,307:724-27.
21. Komurov K, White M:Revealing static and dynamic modular architecture of the eukaryotic protein interaction network.Mol Syst Biol2007,3:110. 22. FX Wu, WJ Zhang, AJ Kusalik:Modeling gene expression from microarray
expression data with state-space equations.Pacific Symposium on Biocomputing2004,9:581-592.
23. Li M, Chen J, Wang J, Hu B, Chen G:Modifying the DPClus algorithm for identifying protein complexes based on new topological structures.BMC bioinformatics2008,9:398.
Table 3 Comparison of the Accuracies of MCL.
Accuracy
B.P. M.F. C.C.
NF-APIN 0.52 0.30 0.62
APPIN 0.49 0.27 0.59
TC-PIN 0.24 0.18 0.36
24. Wang J, Li M, Deng Y, Pan Y:Recent advances in clustering methods for protein interaction networks.BMC genomics2010,11(Suppl 3):S10. 25. Leung H, Xiang Q, Yiu S, Chin F:Predicting protein complexes from PPI
data: a core-attachment approach.Journal of Computational Biology2009,
16(2):133-144.
26. Liu G, Wong L, Chua H:Complex discovery from weighted PPI networks. Bioinformatics2009,25(15):1891-1897.
27. Wang J, Li M, Chen J, Pan Y:A fast hierarchical clustering algorithm for functional modules discovery in protein interaction networks. Computational Biology and Bioinformatics2011,8(3):607-620.
28. Xenarios I,et al:DIP: the Database of Interaction Proteins: a research tool for studying cellular networks of protien interactions.Nucleic Acids Res
2002,30:303-305.
29. Tu BP, Kudlicki A, Rowicka M, McKnight SL:Logic of the yeast metabolic cycle: temporal compartmentalization of cellular processes.Science2005,
310(5751):1152-1158.
30. Van Dongen S:Graph clustering by flow simulation.In PhD thesis Centersfor mathematics and computer science (CWI)University of Utrecht; 2000.
31. Enright AJ, Van Dongen S, Ouzounis CA:An efficient algorithm for large-scale detection of protein families.Nucleic Acids Research2002,
30(7):1575-1584.
32. Brohee S, van Helden J:Evaluation of clustering algorithms for proteinprotein interaction networks.BMC Bioinformatics2006,7:488. 33. Vlasblom J, Wodak S:Markov clustering versus affinity propagation for
the partitioning of protein interaction graphs.BMC Bioinformatics2009,
10:99.
34. Shuye Pu, Jessica Wong, Brian Turner, Emerson Cho, Shoshana Wodak J:
Up-to-date catalogues of yeast protein complexes.Nucleic Acids Research
2009,37(3):825-831.
35. Chen B, Shi J, Zhang S, Wu F:Identifying protein complexes in protein-protein interaction networks by using clique seeds and graph entropy. Proteomics2013,13(2):269-277.
36. Bader GD, Hogue CW:An automated method for finding molecular complexes in large protein interaction networks.BMC Bioinformatics2003,
4(2).
37. Altaf-Ul-Amin M, Shinbo Y, Mihara K, Kurokawa K, Kanaya S:Development and implementation of an algorithm for detection of protein complexes in large interaction networks.BMC Bioinformatics2006,7:207-219. 38. Liu G, Wong L, Chua HN:Complex discovery from weighted PPI
networks.Bioinformatics2009,25(15):1891-1897.
39. King AD, Przulj N, Jurisica I:Protein complex prediction viacost-based clustering.Bioinformatics2004,20:3013-3020.
40. Cho YR, Hwang W, Ramanmathan M,et al:Semantic integration to identify overlapping functional modules in protein interaction networks. BMC Bioinformatics2007,8:265.
doi:10.1186/1477-5956-11-S1-S20
Cite this article as:Xiaoet al.:Detecting protein complexes from active protein interaction networks constructed with dynamic gene expression profiles.Proteome Science201311(Suppl 1):S20.
Submit your next manuscript to BioMed Central and take full advantage of:
• Convenient online submission
• Thorough peer review
• No space constraints or color figure charges
• Immediate publication on acceptance
• Inclusion in PubMed, CAS, Scopus and Google Scholar
• Research which is freely available for redistribution