Vol. 7, No. 2, 2015 Article ID IJIM-00459, 10 pages Research Article
A new multi-mode and multi-product hub covering problem: A
priority M/M/c queue approach
S. Sedehzadeh ∗, R. Tavakkoli-Moghaddam †‡§, F. Jolai ¶
————————————————————————————————–
Abstract
One main group of a transportation network is a discrete hub covering problem that seeks to minimize the total transportation cost. This paper presents a multi-product and multi-mode hub covering model, in which the transportation time depends on travelling mode between each pair of hubs. Indeed, the nature of products is considered different and hub capacity constraint is also applied. Due to the transport volume and related traffic, a new priority M/M/c queuing system is considered, in which products with high priority are selected for service ahead of those with low priority. The objectives of this model minimize the total transportation cost and total time. Besides, because of the computational complexity, a multi-objective parallel simulated annealing (MOPSA) algorithm is proposed and some computational experiments are provided to illustrate the efficiency of the presented model and proposed MOPSA algorithm. The performance of this algorithm is compared with two well-known multi-objective evolutionary algorithms, namely non-dominated sorting genetic algorithm (NSGA-II) and Pareto archive evolution strategy (PAES).
Keywords : Multi-objective hub covering problem; Priority queuing model; Multi modes; Parallel simulated annealing.
—————————————————————————————————–
1
Introduction
A
htelecommunication and transportation ar-ub network has been generally applied in eas. Hubs are special facilities transferred com-modities (e.g., goods or passengers) between ori-gin and destination nodes and used to decrease the number of transportations. The function of a hub facility is to collect, switch, sort and transfer∗School of Industrial Engineering, South Tehran
Branch, Islamic Azad University, Tehran, Iran.
†Corresponding author. [email protected]
‡School of Industrial Engineering, College of
Engineer-ing, University of Tehran, Tehran, Iran.
§Research Center for Organizational Processes
Im-provement, Sari, Iran.
¶School of Industrial Engineering, College of
Engineer-ing, University of Tehran, Tehran, Iran.
commodity, and it decreases the number of links in the network. Therefore, hubs reduce costs and enhance the efficiency of the network. O’Kelly [12] introduced the first mathematical formula-tion in the HLP. O’Kelly [13] also developed the first quadratic mathematical formulation for HLP and presented a p-hub median problem, in which the hub nodes are completely linked together where every non-hub node is linked to a single hub node. Wagner [15] presented a new model formulation for single and multiple allocation hub covering problem. Ernst et al. [6] applied an inte-ger programming formulation based on the radius of hubs concept for single and multiple allocation hub covering problem.
Costa et al.[5] presented a multi-objective hub location problem so that the first objective mini-mizes the total travelling cost, whereas the second
one minimizes the maximum service time between each pair of nodes. In this problem, each non-hub node is allocated to one non-hub and the num-ber of hub nodes is predefined and denoted by Tavakkoli-Moghaddam et al. [14] applied a new multi-objective capacitated hub location model with regarding a set of capacities for each poten-tial hub, in which only one of them can be chosen. The authors considered balancing requirements in this model and proposed a multi objective imperi-alist competitive algorithm (MOICA) to solve the model. Ghodratnama et al. [7] presented a novel mathematical model for a new p-hub location-allocation problem with different types of vehicles and capacity. They also proposed simulated an-nealing (SA), genetic algorithm (GA) and particle swarm optimization (PSO) to solve the presented model.
Marianove and Sera [9] introduced a novel for-mulation of hub location problem in airline net-works behaving as an M/D/c queue system. They proposed a probabilistic constraint that the prob-ability of having more than a specified number of air planes in a queue should be limited. The authors solved the model by using of the tabu search algorithm. Ishfaq and Sox [8] proposed an integrated hub operation queuing model and hub location-allocation model and studied the on the effect of limited hub resources on the design of inter modal logistics networks under service time requirements. Mohammadi et al. [10] presented a capacitated single allocation p-hub covering prob-lem behaving as M/M/c queues. They developed meta-heuristic algorithm based on the imperialist competitive algorithm (ICA) to solve the model.
In HLPs generally supposed that one hub type and one type of transportation mode are existed whereas, in the real world, we have a choice be-tween different types of transportation systems. Alumur et al. [1] designed a new multi-modal hub location network, in which different transporta-tion modes between hubs and different types of service time between the origindestination nodes are considered. Then, an efficient heuristic al-gorithm is developed for solving the presented model. Mohammadi et al. [11] developed a new stochastic multi-objective multi-mode hub cover-ing problem, in which each transportation mode has a risk factor and transportation time is influ-enced by the risk.
The interested reader is referred to [2, 3, 16],
for surveys on HLPs. In the real world, some restrictions such as capacity constraint and time limitation in hub nodes cause to have a queue in these nodes. Moreover, in reality, types of prod-ucts which are transferred between nodes are dif-ferent; so, transferring cost and waiting time for different kinds of products are not the same. In other word, the priority of products is dissimi-lar and products with high priority should be se-lected for service ahead of those with low prior-ity. Thus, the priority queue model is proposed to address the waiting time of products in the hub nodes.
Another feature of designing hub problem that researchers have recently considered is the choice of transportation mode. Transportation time and cost also can be depended on the transportation mode (e.g., road, intermodal rail, air and wa-terways) so paying more attention to select the proper mode causes to get close to the real situ-ations. In this paper, we present the capacitated multi-modal multi-product p-hub covering prob-lem under queuing approach. The major differ-ences of this paper with the other studies are as follows:
• Designing a new multi-modal multi-product hub covering problem;
• Considering a single allocation strategy for each product so that each non-hub product at each node can be allocated to exactly one hub;
• Incorporating a priority M/M/c queue model to consider the waiting time in the hub nodes;
• Describing a set of available capacity levels for each potential hub so that only one of them can be chosen;
• Proposing a multi-objective model, in which the total cost and the maximum time of transportation between each pair of node should be minimized;
• Developing a multi-objective parallel sim-ulated annealing (MOPSA) algorithm for solving this problem.
MOPSA to solve the problem. Section4presents the computational results. Finally conclusions are discussed in Section 5.
2
Problem formulation
In HLPs, there is a set of n nodes that some of them can be selected as hubs and p hubs are located and the remaining non-hub nodes are allocated to these located hubs. We first present notations and then the model presents. Accord-ing to the notations, we present a mathematical formulation for the single allocation multi-modal hub location network design problem. The aim of this problem is to locate hub nodes and allocate non-hub nodes to these located hubs.
Indices:
n={1,2, ..., N} Set of nodes c={1,2, ..., C} Set of products
[set of priorities] m={1,2, ..., M} Set of modes
Parameters:
wc
i,j Flow to be sent from node
i to nodej for productc (i, j∈N).
Ci,kc Cost of sending product c from node i to nodek
(i, j∈N).
fkq Fixed cost of opening hub k with capacity levelq. tci,k Transportation time of
sen-ding product c from nodei to hub k(i, j∈N).
Oci =∑jwci,j Total flow originating at node ifor productc.
Dci =∑jwcj,i Total flow destined for node ifor product c.
P Number of hubs that should be established.
µk Processing rate of products at hub k.
ςk Number of service providers at hub k
Rk Coverage radius at hubk
Cmk Modal connectivity cost of serving mode mat hub k.
Variables:
xc,mi,j,k,l 1 if product ctravels from node ito j through hub pair (k, l) using mode m, otherwise 0.
smk 1 if hub k is served by modem; 0, otherwise.
zkq 1 if node kis a hub with capacity level q; 0, otherwise.
W Tk Waiting time at node k
T The maximum allowed time between each pair of node
Objective functions:
min ∑i,j,k,l,m,cwi,jc (Ci,kc +αmCk,lc,m+Cl,jc )xc,mi,j,k,l
+∑k,qfkqzkq+∑k,mCkmsmk (1)
min T (2)
Constraints:
xmcijkl≤∑qzkq ∀i, j, k, l, m, c (3) xmcijkl≤∑qzlq ∀i, j, k, l, m, c (4)
∑
qz q
k≤l ∀k (5)
∑
k,qz q
k =l (6)
∑
k,l,mxmcijkl=l ∀i, j, c (7) xmcijkl≤smk ∀i, j, k, l, m, c (8)
xmcijkl≤sml ∀i, j, k, l, m, c (9)
∑
l,j,c,mCi,kc xmcijkl ≤Rk ∀i, k (10)
λck=∑i,j,l,mwi,jc xmcijkl ∀k, c (11)
W Tkc=
∑
msmk
ςk!(ςkµk−λck)( λc
k µk)
∑ςk−1 j=0
(λck µk)j
j! +ςkµk
(12)
× 1
(1−
∑c−1 i=1λck ςkµk )×(1−
∑c i=1λck ςkµk )
∀k, c
(tcik+W Tkc+αmtcmkl +W Tlc+tcij)xmcijkl≤T (13)
∀i, j, k, l, m, c
∑
i,j,l,c,mwijcxmcijkl ≤
∑
qcap q kz
q
k ∀k (14)
xmc ijkl, z
q
The first objective function of this model minimizes the sum of transportation costs and fixed costs of locating hubs while the second one minimizes the maximum time including transportation time and waiting time between each pair of node. Constraints (3) and (4) enforce that every hub pair assignment for an origindestination pair is restricted to open hubs. Constraint (5) ensures that each hub can choose only one capacity level. Constraint (6) shows that p hub node is selected. Constraint (7) makes sure that, on a hub link, only one mode can be selected. Constraints (8) and (9) assure that if transportation of product c from nodei to nodej through a hub pair (k, l) by using of mode
m is occurring, hubs k and l should have been served by mode m. Constraint (10) assures that each nodei can only be allocated to hubk if the unit cost of Cikc not exceed radiusRk . Equation (11) calculates the arrival rate of each product at each hub. Equation (12) also calculates the waiting time at each hub. Constraint (13) ensures that the total transportation time and the waiting time in hub nodes should be less than the maximum allowed time which will be determined by the second objective function. Constraint (14) shows the capacity constraints which limit the amount of flows processed by each hub. Finally, Constraint (15) shows the type of variables.
3
Proposed algorithm
One special kind of multi-objective simulated an-nealing algorithm called multi-objective parallel SA (MOPSA) is proposed to solve the model in which more than one solution is used for search-ing in the solution space to obtain Pareto optimal solutions. The proposed MOPSA is able to search the solution space broadly. The performance of this algorithm is compared with two well-known meta-heuristic algorithms such as NSGA-II and PAES and the better performance of proposed MOPSA has been presented for validating this algorithm in HLPs.
3.1 Proposed MOPSA
Parallel simulated annealing algorithm starts with random initial solutions. In this algorithm for HLPs, the continues solution encoding (CSE)
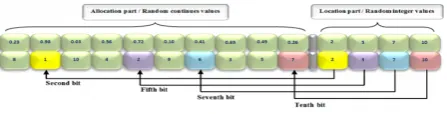
can consist of a matrix where n is a number of nodes and p is a number of hubs that should be located in the network. This matrix includes two parts; the first part is related to allocation phase and the second one is related to location phase. The allocation part includes real random values which are placed in bits 1 ton; while the location part includes random integer values limited to 1 to n interval placed in bits n+ 1 ton+p. Fur-thermore, it should be considered that the value of the (n+p)th bit must be equal ton. Then, the random values of the first part are sorted increas-ingly so that the place of the biggest one includes number 1, 2 for the next big one, and so on. Af-ter that, the sorted bits of the second part are considered as the place of hubs in first part and the other bits are allocated to the nearest right signed bit which becomes hub. Fig. 1 illustrates the sample of CSE with 4 hubs and 10 nodes in which the colorful bits are hubs and the remained gray ones are nodes which are allocated to their nearest colorful bit. For instance, in Fig. 1, nodes 1, 2, 6 and 7 are hubs and nodes 8, 10, 4, 9, 3 and 5 are respectively allocated to hubs 1, 2, 2, 6, 7 and 7 [11].
The proposed algorithm uses three steps for creating neighborhood for the initial solution and achievement to the better solutions in the each iteration. These three steps include: mutation, assimilation and crossover. We used the non-dominance strategy and crowding distance metric to choose thenPop better solutions among the all created solutions for applying in the next itera-tions initial soluitera-tions. While two corresponding solutions are being compared to choose for next iteration initial solutions, three different cases may occur:
• If one solution dominates another one, it will be chosen.
• If two solutions cannot dominate each other, a solution with higher crowding distance metric will be selected for the next iteration.
• If the old solution dominates the new one, the probable acceptance function of simu-lated annealing will be accepted as stated bellows.
This probability is detected by the Boltzmann function, P =e−∆fkT where ∆ is a different value
Figure 1: Continuous solution encoding for the HLP.
the new solutions,k is a constant andT is a cur-rent temperature. Moreover, the number of func-tion calls (NFC) is considered as stopping crite-ria. The pseudo code of the proposed MOPSA is shown below:
3.2 NSGAII and PAES assumption
The NSGA-II assumptions and the value of pa-rameters are as follows:
• The initial solution is randomly generated.
• Crossover operator is applied random se-lected solutions using one of these operators: one-point crossover, two-point crossover and uniform crossover.
• Mutation operator is exerted on random se-lected solution using one of these operators: inversion, swap and reversion.
• The crossover and mutation ratios are set to 0.75 and 0.3, respectively.
• Number of the initial population is set to 200 and 300 for small and large-sized problems, respectively.
• The NFCs stopping criteria was set on 4000 and 12000 for small and large size problems, respectively.
The PAES assumptions and the value of pa-rameters are as follows:
• The size of archive is equal to 200.
• One of revolution operators, namely inver-sion, swap and reverinver-sion, are selected ran-domly.
• The NFCs stopping criteria was set on 4000 and 12000 for small and large size problems, respectively.
3.3 Comparison metrics
To illustrate the performance of the proposed MOPSA, four comparison metrics are used as fol-lows [11]:
Quality Metric (QM) This metric is mea-sured by putting together the non-dominated solutions found by the algorithms and cal-culating the ratios between non-dominated solutions of each algorithm. An algorithm with higher value of the QM has better per-formance.
Mean Ideal Distance (MID) The closeness between Pareto solutions and ideal point is detected using MID index. The MID index is calculated by:
M ID=
∑n i
√
( f1i−f1best
fmax
1,total−f1,totalmin
)2+ ( f2i−f2best
fmax
2,total−f2,totalmin
)2
n
(3.1)
wheren is the number of non-dominated so-lutions and fi,totalmax and fi,totalmin are the max-imum and minmax-imum values of each fitness functions of all non-dominated solutions ob-tained by the algorithm. According to this definition, the algorithm with a lower value of the MID has a better performance.
Diversification Metric (DM) This metric shows the spread of the Pareto solutions set and is measured by Eq. (3.2). Base on the definition, the algorithm with a higher value of the DM has a better performance.
M D=
√
(maxf1i−minf1i f1p,max,total −f1p,min,total )
2+ (maxf2i−minf2i
f2p,max,total −f2p,min,total )
2
(3.2)
Spacing Metric (SM) This metric measures the uniformity of the spread of the non-dominated set solutions. This metric is ob-tained according to Eq. (3.3). The algorithm with a lower value of the SM has a better performance.
SM =
∑n−1
i=1 |d−di|
where di is the Euclidean distance between consecutive solutions in the obtained non-dominated set of solutions anddis the aver-age of these distances.
3.4 Data generation
The required data for the presented problem con-sists of a number of nodes, number of hubs, trans-portation cost, transtrans-portation time, fixed costs, capacity of hubs and flows. The value and distri-bution of the above input parameters are as Table
1. Some special numbers of hubs are considered for each number of nodes. Also, each problem in-stance is shown as Number of nodes # number of hubs (e.g., 30#8 means 30 nodes and 8 hubs).
4
Computational results
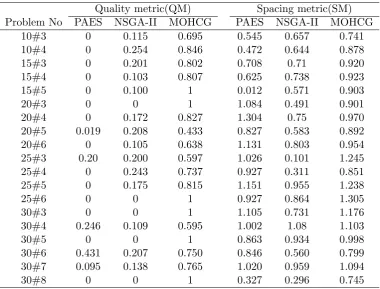
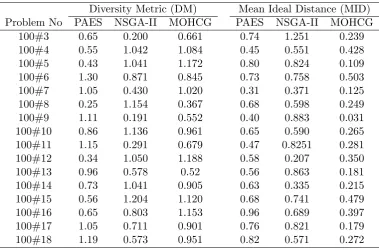
The proposed MOPSA is used to number of test problems and its performance compared with NSGA-II and PAES. Tables 2 and 3 show the above four comparison metrics for small-sized problems. Tables4and5list the above four com-parison metrics for large-sized problems. All ta-bles show that the proposed MOPSA outperforms the NSGA-II and PAES in all test problems. The results of comparisons are as follows:
• Proposed MOPSA has more contribution of obtaining Pareto optimal solutions with higher qualities in comparison with both NSGA-II and PAES.
• Proposed MOPSA provides non-dominated solutions that have less average values of the spacing metric, so the MOPSA are more uni-formly distributed in comparison with both NSGA-II and PAES in proposed model.
• The average values of the diversification metric in the proposed MOPSA are greater than NSGA-II and PAES in the most of the test problems;
• The values of MID in the proposed MOPSA are smaller than those of NSGA-II and PAES.
Table 1: Value and distribution of input parameters
Parameters
Value and n wijc Cijc fkq capqk tmkl
distribution 30#8 p∼(20) U ∼(1,10) U ∼(1000,2000) U ∼(100,1000) U ∼(10,20)
Table 2: Comparison metrics for small-sized problems
Quality metric(QM) Spacing metric(SM) Problem No PAES NSGA-II MOHCG PAES NSGA-II MOHCG
10#3 0 0.115 0.695 0.545 0.657 0.741
10#4 0 0.254 0.846 0.472 0.644 0.878
15#3 0 0.201 0.802 0.708 0.71 0.920
15#4 0 0.103 0.807 0.625 0.738 0.923
15#5 0 0.100 1 0.012 0.571 0.903
20#3 0 0 1 1.084 0.491 0.901
20#4 0 0.172 0.827 1.304 0.75 0.970
20#5 0.019 0.208 0.433 0.827 0.583 0.892
20#6 0 0.105 0.638 1.131 0.803 0.954
25#3 0.20 0.200 0.597 1.026 0.101 1.245
25#4 0 0.243 0.737 0.927 0.311 0.851
25#5 0 0.175 0.815 1.151 0.955 1.238
25#6 0 0 1 0.927 0.864 1.305
30#3 0 0 1 1.105 0.731 1.176
30#4 0.246 0.109 0.595 1.002 1.08 1.103
30#5 0 0 1 0.863 0.934 0.998
30#6 0.431 0.207 0.750 0.846 0.560 0.799
30#7 0.095 0.138 0.765 1.020 0.959 1.094
30#8 0 0 1 0.327 0.296 0.745
Table 3: Comparison metrics for small-sized problems
Diversity Metric (DM) Mean Ideal Distance (MID) Problem No PAES NSGA-II MOHCG PAES NSGA-II MOHCG
10#3 0.930 1.159 1.702 0.695 0.653 0.573
10#4 1.048 1.275 1.839 0.587 0.614 0.546
15#3 0.346 0.831 1.566 0.762 0.838 0.431
15#4 1.431 0.502 0.957 0.851 0.699 0.329
15#5 1.118 0.423 0.940 0.541 0.396 0.361
20#3 1.270 1.323 1.087 0.783 0.716 0.537
20#4 1.279 0.861 0.903 0.851 0.548 0.342
20#5 1.150 0.931 1.319 0.993 0.529 0.518
20#6 1.031 1.100 1.158 0.743 0.685 0.623
25#3 0.538 1.391 1.456 0.535 0.681 0.258
25#4 0.947 0.995 1.288 0.783 0.653 0.710
25#5 0.739 1.148 1.309 0.693 0.555 0.521
25#6 0.957 0.527 1.463 0.582 0.474 0.263
30#3 1.043 0.513 1.224 0.634 0.684 0.633
30#4 0.929 1.119 1.188 0.574 0.737 0.459
30#5 0.813 1.146 1.354 0.723 0.800 0.513
30#6 1.224 0.643 1.130 0.409 0.286 0.357
30#7 1.236 0.943 0.905 0.638 0.458 0.281
Table 4: Comparison metrics for large-sized problems
Quality metric(QM) Spacing metric(SM) Problem No PAES NSGA-II MOHCG PAES NSGA-II MOHCG
100#3 0 0 1 1.24 0.471 0.661
100#4 0 0.43 0.57 0.51 1.052 1.370
100#5 0 0 1 0.20 0.011 1.181
100#6 0.34 0 0.654 0.35 0.501 0.581
100#7 0 0 1 0.80 0.662 1.053
100#8 0 0 1 0.29 1.713 0.553
100#9 0 0 1 1.47 0.901 0.454
100#10 0 0 1 0.85 1.042 0.971
100#11 0 0 1 1.00 0.709 0.594
100#12 0 0 1 0.07 1.072 0.731
100#13 0 0 1 0.97 0.653 0.401
100#14 0.08 0.347 0.5697 0.36 1.236 1.059
100#15 0 0 1 0.85 0.920 1.368
100#16 0 0 1 1.05 0.631 1.123
100#17 0 0 1 0.894 1.138 0.775
100#18 0 0 1 1.11 0.981 1.043
Table 5: Comparison metrics for large-sized problems
Diversity Metric (DM) Mean Ideal Distance (MID) Problem No PAES NSGA-II MOHCG PAES NSGA-II MOHCG
100#3 0.65 0.200 0.661 0.74 1.251 0.239
100#4 0.55 1.042 1.084 0.45 0.551 0.428
100#5 0.43 1.041 1.172 0.80 0.824 0.109
100#6 1.30 0.871 0.845 0.73 0.758 0.503
100#7 1.05 0.430 1.020 0.31 0.371 0.125
100#8 0.25 1.154 0.367 0.68 0.598 0.249
100#9 1.11 0.191 0.552 0.40 0.883 0.031
100#10 0.86 1.136 0.961 0.65 0.590 0.265
100#11 1.15 0.291 0.679 0.47 0.8251 0.281
100#12 0.34 1.050 1.188 0.58 0.207 0.350
100#13 0.96 0.578 0.52 0.56 0.863 0.181
100#14 0.73 1.041 0.905 0.63 0.335 0.215
100#15 0.56 1.204 1.120 0.68 0.741 0.479
100#16 0.65 0.803 1.153 0.96 0.689 0.397
100#17 1.05 0.711 0.901 0.76 0.821 0.179
5
Conclusion
This paper studied the capacitated multi-mode p-hub covering problem, in which the mode of transportation was a part of the decision-making process and for each potential hub, a set of capac-ity level and modes was available . The travel-ling time depended on the transportation mode. The presented model followed the single alloca-tion principles for each product that could re-ceive and send flow only through one hub. Since the priority of products was different, the au-thors extended the M/M/c queue model to prior-ity M/M/c one, in which the product with high priority was selected for service ahead of that with low priority. The objectives of the proposed model minimized total transportation cost and maximum time (transportation time and wait-ing time). For solving this problem, a multi-objective parallel simulated annealing (MOPSA) was proposed, whose performance was compared with NSGA-II and PAES algorithms. The results showed that the proposed MOPSA provided non-dominated solutions with less average values of the spacing metric. Its Pareto-optimal solutions considerably had higher qualities in comparison with both NSGA-II and PAES algorithms.
Acknowledgement
The authors would like to thank the Editor-in-Chief of the International Journal of Indus-trial Mathematics and anonymous referees for their helpful comments and suggestions, which greatly improved the presentation of this pa-per. The third author would like to acknowl-edge the partially financial support of the Uni-versity of Tehran for this research under Grant No. 8106043/1/24.
References
[1] S. Alumur, T. Allahviranloo, Network hub location problems: The state of the art, Eu-ropean Journal of Operational Research 190 (2008) 1-21.
[2] S. Alumur, B. Kara.Y., O. E. Karasan, Mul-timodal hub location and hub network design, Omega 40 (2012) 927-939.
[3] J. F.Campbell, M. OKelly,Twenty-five years of hub location research, Transportation Sci-ence 46 (2012) 153-169.
[4] I. Correia, S. Nickel, F. Saldanha-da-Gama,
Hub and spoke network design with single-assignment, capacity decisions and balancing requirements, Applied Mathematical Mod-elling 35 (2011) 4841-4851.
[5] M. G. Costa, M. E. Captivo, J. Climaco,
Capacitated Single Allocation Hub Location Problem A Bi-Criteria Approach, Comput-ers and Operations Research 35 (2008) 3671-3695.
[6] A. T. Ernst, H. Jiang, M. Krishnamoor-thy, Reformulations and computational re-sults for uncapacitated single and multiple al-location hub covering problems, Unpublished Report, CSIRO Mathematical an Informa-tion Sciences, Australia (2005).
[7] A. Ghodratnama, R. Tavakkoli-Moghaddam, A. Baboli, Comparing three proposed meta-heuristics to solve a new p-hub location-allocation problem, Int. J. of Engineering - Transactions C: Aspects 26 (2013) 787-797.
[8] R. Ishfaq, C. R. Sox, Design of intermodal logistics networks with hub delays, European Journal of Operational Research 220 (2012) 629-641.
[9] V. Marianov, D. Serra, Location models for airline hubs behaving as M/D/C queues, Computers and Operations Research 30 (2003) 983-1003.
[10] M. Mohammadi, F. Jolai, H. Rostami, An M/M/c Queue Model for Hub Covering Lo-cation Problem, Mathematical and Com-puter Modelling 54 (2011) 2623-2638.
[11] M. Mohammadi, F. Jolai, R. Tavakkoli-Moghaddam,Solving a new stochastic multi-mode p-hub covering location problem con-sidering risk by a novel multi-objective al-gorithm, Applied Mathematical Modelling. Article in Press,DOI:10.1016/j.apm.2013. 05.063, (2013).
[13] M. E. O’kelly, A quadratic integer program for the location of interacting hub facilities, European Journal of Operational Research 32 (1987) 393-404.
[14] R. Tavakkoli-Moghaddam, Y. Gholipour-Kanani, M. Shahramifar, A multi-objective imperialist competitive algorithm for a ca-pacitated single-allocation hub location prob-lem, International Journal of Engineering -Transactions C: Aspects 26 (2013) 605-620.
[15] B. Wagner, Model formulations for hub cov-ering problems, Working Paper, Institute of Operations Research, Darmstadt Univer-sity of Technology, Hochschulstrasse 1, 64289 Darmstadt, Germany (2004).
[16] R. Zanjirani Farahani, M. Hekmatfar, A. Boloori Arabani, E. Nikbakhsh, Hub loca-tion problems: A review of models, classifica-tion, techniques and application, Computers Industrial Engineering 64 (2013) 1096-1109
Samaneh Sedehzadeh obtained her B.Sc. degree in Industrial En-gineering from Tafresh University in 2011 and M.Sc. degree in In-dustrial Engineering from South Tehran Branch at Islamic Azad University in 2013. She is current a Ph.D. student in Department of Industrial En-gineering at Alzahra University. Her research in-terests include p-hub location, supply chain and meta-heuristics for optimization problems. She has published a number of journal and conference papers.
Reza Tavakkoli-Moghaddam is a professor of Industrial Engineering at College of Engineering, Univer-sity of Tehran in Iran. He obtained his Ph.D. in Industrial Engineer-ing from Swinburne University of Technology in Melbourne (1998), his M.Sc. in Industrial Engineering from the Uni-versity of Melbourne in Melbourne (1994) and his B.Sc. in Industrial Engineering from the Iran University of Science and Technology in Tehran
(1989). His research interests include facility lay-outs and location design, cellular manufactur-ing systems, sequencmanufactur-ing and schedulmanufactur-ing, and us-ing meta-heuristics for combinatorial optimiza-tion problems. He is the recipient of the 2009 and 2011 Distinguished Researcher Award and the 2010 Distinguished Applied Research Award at University of Tehran, Iran. Additionally, he has been selected as National Iranian Distinguished Researcher for two years (2008 and 2010). Profes-sor Tavakkoli-Moghaddam has published 4 books, 15 book chapters and more than 500 papers in reputable academic journals and conferences.