MURDOCH RESEARCH REPOSITORY
http://dx.doi.org/10.1049/cp:20000328
Chandrasekhar, R. and Attikiouzel, Y. (2000) A new range-based
image texture measure with application to mammogram image
analysis. In: First International Conference on Advances in
Medical Signal and Information Processing, 4 - 6 September,
Bristol, UK, pp. 129-133.
http://researchrepository.murdoch.edu.au/20071/
Copyright © 2000 IEEE
Personal use of this material is permitted. However, permission to reprint/republish
this material for advertising or promotional purposes or for creating new collective
R
Chandrasekhar and
Y
Attikiouzel
Australian Research Centre for Medical Engineering
The University
of Western Australia, Australia
Abstract: This paper describes a new. spatially isotropic, neighbourhood-based, image texture measure, and illustrates its use for mammographic image analysis. It is based on the extended Russ operator, first introduced by J.C. Russ, and founded on the work of H. E. Hurst. An octagonal neighbourhood is defined, centred on each pixel in an image, and the difference between the maximum and minimum pixel values in each set of pixels at a given Euclidean distance d from the centre pixel is computed t o be the range d. logd is plotted against logd, and a straight line fitted to the data. The square of the correlation coefficient, q 2 , is associated with the position of the centre pixel. Preliminary experiments suggest that q2 is a promising texture measure that may be used t o detect the edge of the pectoral muscle, define the boundary of the mammographic parenchyma, and in conjunction with other features, possibly detect circumscribed lesions.
Keywords: extended Russ operator, texture measure, mammogram image analysis, parenchyma, pectoral mus- cle, circumscribed lesion detection
INTRODUCTION
Image texture is easily perceived and intuitively un- derstood. It is, however, difficult to characterise mathematically with sufficient generality to encap- sulate the whole gamut of perceived textures. Multi- pronged approaches to texture description and anal- ysis have therefore been developed 11, 21. One
of these is t o classify textures as strongly ordered, weakly ordered and disordered, with the observation that these textures could best be described using structural, oriented-flow, and statistical/fractal de- scriptors respectively 1.3).
We present here a new texture measure, extending from the work of J. C. Russ [4], and apply it to mam- mogram texture analysis. It is based on a statistical quantity: the range of greyscale values in successive, equidistant annuli, around a centre pixel. It is un- clear whether the new measure captures fractal as well as statistical behaviour. While further investi- gation of its theoretical basis is required, the new measure appears well-suited to characterising mam- mogram texture, which lies somewhere in the texture spectrum between a weakly ordered and a disordered texture.
esting and useful in its own right.
Mandelbrot and co-workers [7, 8,9] introduced the fractional Brownian motion (fBm) model to account for the behaviour extracted by Hurst’s method, al- though it is not known a t present whether this is the only applicable model. Moreover, it is unclear whether fBm is a valid model for explaining what the Russ operator does, given its departures from Hurst’s method.
The Russ operator [4] is most easily understood with an example. An octagonal neighbourhood of given “radius” is first defined for any particular pixel
in an image. For example, the neighbourhood shown in Figure 1 is defined for a “radius” of 4 or a “diam- eter” of 9 pixels; the centre pixel is labelled 0. This neighbourhood is an approximation to a circle, which is the equidistant locus in the Euclidean norm. The distances associated with each labelled pixel in Fig- ure 1 are shown in Table 1. Russ defined his “local Hurst operator” so:
1. For each set of pixels lying within the neighbour- hood, a t the same Euclidean distance d from the centre pixel, find the maximum and the mini- mum pixel values. Their difference is the range, d.
THE EXTENDED
RuSs
OPERATOR
2. Plot the data to minimize the square of the error. logd against logd and fit a straight line toIn 1990, J.C. Russ [4] introduced a “local Hurst oper- ator” to perform texture discrimination. He claimed that this operator implemented in two dimensions the method H.E. Hurst [5] had introduced in study- ing time-series related to river flow data. While we have shown that Russ’s implementation differs from Hurst’s on at least five counts 16, chapter 91, the op- erator introduced by Russ is nevertheless very inter-
3. The slope of the plot, m, is a measure of “lo- cal roughness (in the sense of the Hurst coeffi- cient)” [4, p 250) at the centre pixel. It could be used to plot a transformed image, scaled for dis- play, that could later be segmented on the basis
of the m values.
130
PIXEL
LABEL
k
FIGURE 1: Octagonal neighbourhood of
“radius” p = 4 and “diameter” 9. Pixels at the same Euclidean distance d k from
the central pixel, numbered 0 above, are labelled with the same index, IC. See Ta- ble l for the relevant distances.
NO. OF EUCLIDEAN
PIXELS DISTANCE dk
a single centre pixel position on an image. There are ten points on the plot and the degree of fit t o the straight line is good, as exemplified by the value
q2 N 0.98.
Russ interpreted his results in light of the fBm model, claiming that ‘ I . . . t h e slope of the resulting
line is directly related to the fractal dimension of
the profile” [4, p 2491. He therefore used only one parameter, the slope, m , of the plot.
By interpreting the Russ operator purely as a data analysis method, we may extract two more parame- ters from the process of fitting a straight line. These are the y-axis intercept c, and the square of the coef- ficient of‘ correlation, q 2 , resulting from the straight line fit.
We define the extended Russ operator, & so:
where p is the’ radius of the associated octagonal neighbourhood and p, the position of the centre pixel. The output vector has three components: m,
c and T ~ , which correspond respectively to the slope, y-axis intercept and square of the coefficient of cor- relation. This vector is associated with p.
To avoid edge effects, only those pixels whose neighbourhoods lie wholly within the image are transformed. Also, t o avoid undefined values, when- ever d is equal t o 0, it is (arbitrarily but consistently) set to 1. We note in passing that we have used log to mean log,, while Russ defined it to be In.
Russ [4] scaled the m-values associated with each pixel position and displayed them as images. We do the same with the c- and v2-values.
10 8 17
TABLE 1: This table shows the Euclidean dis-
tances d k corresponding to the indices k shown
on the octagonal neighbourhood of radius p =.4
in Figure 1.
FIGURE 2: Graph of straight line fitted to
the ten points arising from the neighbourhood of radius p = 4. The centre pixel has co- ordinates (171, 467), at 400 p m per pixel, for
MIAS mammogram image mdb00511. The val- ues of (m,c,$) are (1.09288,1.10424,0.975175).
RESULTS
WITH
MAMMOGRAMS
Results from preliminary experiments on applying the extended Russ operator to mammograms are presented in this section, with emphasis on the 7’-
component.
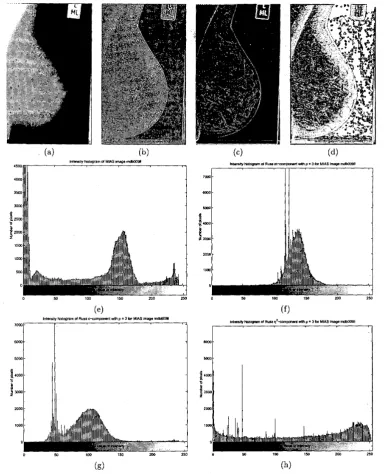
In Figure 3(a), we show an original mammogram, mdb00911, from the MIAS database [lo, 111. Fig- ures 3(b) to (d) show the three transformed images resulting from our definition of the extended Russ op- erator. The c-image clearly emphasises edges as we have shown elsewhere [12]. The m- and q2-images exhibit similarities as well as differences and seem to be sensitive to intensity and texture.
The intensity histograms of the original, m-, c-
4 0 0
35w
P
#. 25w
;
15W
1000
530
0
0 53 100 150
I
1 ow
0
0 53 100 150 2
1000
0
0 1w 150 2w 253
FIGURE 3: Images from the extended Russ operator with p = 3. (a) The original image is MIAS mammogram mdb00911. (b) This is the m-image, or “image of slope values”, scaled for display. It results from the original definition of Russ [4],
with p = 3. (c) This is the c-image, or “image of y-axis intercept values”, again scaled for display. Note the edge sensitivity of the c-component which has been described elsewhere [12]. (d) This is the q2-image, or image of “the square of the coefficients of correlation”, scaled for display. Note its similarities and differences with the image in (b). Because
132
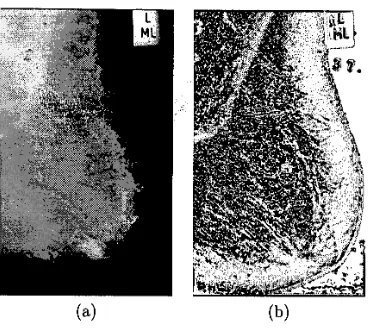
spectively. They appear markedly different. The original and q2 images from another MIAS mammogram, mdb00511, are shown in Figure 4. The original mammogram has two circularly shaped cir- cumscribed lesions close t o each other, appearing like a figure-of-eight at the lower middle of the image. The q’ image shows a whitish elliptical region with a blacker core at the corresponding site.
DISCUSSION
Qualitative observations
The question may arise as to whether the c- and $-components of the extended Russ operator are not really capturing the same information as the m-component of the original Russ operator. The fact that the intensity histograms in Figures 3(f) to (h) represent different pixel intensity distributions, and are not scaled versions of each other, confirms that we are indeed extracting independent informa- tion from the two new components, c and q2, of the extended Russ operator. It is also reasonable to in- fer that c is strongly indicative of edges whereas m
and 77’ seem t o be correlated with local intensity and visual texture.
In our opinion, 77’ as a local texture measure has the advantage of spanning a pre-defined range of val- ues, lying between zero and one, and may therefore be used quantitatively as a calibrated measure.
When the q2 component is used t o analyse mam- mograms, we have observed the following:
1. it can clearly outline the breast border;
2. the dark, predominantly fatty region close to the breast border on the original mammogram ap- pears as a predominantly whitish band on the +-image;
3. the fibroglandular mammographic parenchyma appear as a predominantly blackish region which may have patches of whiter regions on it;
4. clearly discernible lesions show up as whitish re- gions (sometimes having a blackish core) in the midst of the parenchyma;
5. the edge of the pectoral muscle shows up as a characteristically whitish band adjoining the darker parenchymal region;
6 . the mottled appearance of the mammogram background in the q2-image indicates that it is highly non-uniform. The “patches” on the 7’-
image, when magnified, may be identified with the shape of the octagonal neighbourhoods used in the operator.
Further experiments with a large number of mammograms are needed t o confirm these be- haviours generally and t o establish the use of the
q2-component as a reliable texture measure for
analysing mammograms. Additional experiments are also required to identify the theoretical basis of the operator, determine what post-processing is needed for texture analysis and segmentation, com- pare its performance with other texture operators, and explore scale dependence.
Theoretical ramifications
The straight line fit performed by the extended Russ
operator imposes the relationship
logd = m l o g d + c (2)
which in turn implies the power law relationship
R = (lOc)dm (3)
i.e., the range at successive equidzstant annuli from the centre pixel increases as the mth power of dis-
tance from the centre pixel. While this statement describes the observed behaviour, it does not yield insight into the class of underlying pixel distributions that could lead t o this behaviour.
If one assumes that this power law behaviour is characteristic of fractals, then, the degree t o which the straight line fits the data may indicate the “degree
of fiactality” in the neighbourhood of any pixel.
The square of the coefficient of correlation,
v2,
by definition, lies between 0 and 1. It may therefore be used as a calibrated, absolute measure of the degree to which the power law behaviour, being tested for by the extended Russ operator, is indeed obeyed. Values close to 1 signify power law behaviour; values close t o zero do not.We may then conjecture that by setting a thresh- old for q2 close t o 1, and thresholding the image, we may be segmenting those portions of the image that exhibit fractal characteristics from those that do not.
CONCLUSIONS
We have defined the extended the Russ operator
as one that maps an octagonal neighbourhood of a pixel to three components, m , c, and g 2 , each of which may be scaled and plotted as images. The q2-component always takes values between zero and one and seems t o discriminate textures. Preliminary experiments have revealed that it may be used to define the mammographic parenchyma and the pec- toral muscle edge. We conjecture that it may also be capable of highlighting circumscribed masses, very likely in conjunction with other features.
References
[l] R. M. Haralick, “Statistical and Structural Ap- proaches to Texture,” Proceedings of the IEEE,
FIGURE 4: Images from the extended Russ operator with p = 3. (a) The original mammogram is MIAS image mdb00511. There are two closely spaced circular lesions of higher intensity, arranged like an oblique figure-of-eight, in the lower
middle of the mammogram. The pectoral muscle appears as a higher intensity triangle at the top left of the image and
has a somewhat diffuse border. (b) $-image of the mammogram, scaled for display. A white elliptical region with a
black core marks the lesion site on the $-image. The pectoral muscle edge is predominantly whiter than either the
parenchyma to the right or the rest of the muscle to the left.
A. K . Jain, Fundamentals of Digital Image Pro- cessing. Prentice Hall Information and Sys- tem Sciences Series, Englewood Cliffs, NJ, USA: Prentice-Hall, 1989.
A. R. b o ,
A
Taxonomy for Texture Description and Identification. Springer Series in Perception Engineering, New York: Springer-Verlag, 1990.J. C. Russ, “Processing Images with a Lo- cal Hurst Operator to Reveal Textural Dif- ferences,” Journal of Computer Assisted Mi- croscopy, vol. 2, no. 4, pp. 249-257, 1990.
H. E. Hurst, R. P. Black, and Y. M. Simaika,
Long- Term Storage: A n Experimental Study.
London, UK: Constable & Co. Ltd., 1965.
R. Chandrasekhar, Systematic Segmentation of
Mammograms. PhD Thesis, Centre for Intelli- gent Information Processing Systems, Depart- ment of Electrical and Electronic Engineering, The University of Western Australia, Nedlands, WA 6907, Australia, Oct. 1996.
B. B. Mandelbrot and J . W. van Ness, “F’rac- tional Brownian Motions, F’ractional Noises and Applications,” S I A M Review, vol. 10, pp. 422- 437, Oct. 1968.
B. B. Mandelbrot and J. R. Wallis, “Noah, Joseph, and Operational Hydrology,” Water Re- sources Research, vol. 4, pp. 909-918, Oct. 1968.
B. B. Mandelbrot and J. R. Wallis, “Robust- ness of Rescaled Range R/S in the Measurement of Noncyclic Long Run Statistical Dependence,’’
Water Resources Research, vol. 5, pp. 967-988, Oct. 1969.
J. Suckling, J. Parker, D. R. Dance, S. Ast- ley, I. Hutt, C. R. M. Boggis, I. Ricketts, E. Stamatakis, N. Cerneaz, S.-L. Kok, P. Tay- lor, D. Betal, and J . Savage, “The Mammo- graphic Image Analysis Society Digital Marn- mogram Database,” in Gale et al. [ll], pp. 375- 378.
A. G. Gale,