COMPUTER SCIENCE & TECHNOL
COMPUTER SCIENCE & TECHNOL
COMPUTER SCIENCE & TECHNOL
COMPUTER SCIENCE & TECHNOL
COMPUTER SCIENCE & TECHNOLOG
OG
OG
OGYYYYY
OG
www.computerscijournal.org
June 2013, Vol. 6, No. (2): Pgs.75-84
An International Open Free Access, Peer Reviewed Research Journal Published By: Oriental Scientific Publishing Co., India.Oriental Scientific Publishing Co., India.Oriental Scientific Publishing Co., India.Oriental Scientific Publishing Co., India.Oriental Scientific Publishing Co., India.
INTRODUCTION INTRODUCTION INTRODUCTION INTRODUCTION INTRODUCTION
The Mobile Ad-hoc Network (MANET) is a collection of nodes, which have the possibility of connecting in a wireless medium forming an arbitrary dynamic network. Such mobile network can dynamically change with time, new nodes can join, and other nodes can leave the network [C.P. Agrawal et al.2008]. A large majority of MANET studies are based on simulating the Random Waypoint mobility models, which is one of the default cases in the Network Simulator (NS-2). In
Selecting the Best Mobility Model with the A
Selecting the Best Mobility Model with the A
Selecting the Best Mobility Model with the A
Selecting the Best Mobility Model with the A
Selecting the Best Mobility Model with the AOD
OD
OD
OD
ODV R
V R
V R
V Routing
V R
outing
outing
outing
outing
Protocol in MANETs
Protocol in MANETs
Protocol in MANETs
Protocol in MANETs
Protocol in MANETs
SA
SA
SA
SA
SAAD TALIB HASSON
AD TALIB HASSON
AD TALIB HASSON
AD TALIB HASSON and
AD TALIB HASSON
and
and
and
and
AL
ALA
AL
AL
AL
AA
AAA TAIMA
A TAIMA
A TAIMA
A TAIMA
A TAIMA
Computer Sciences Department, University of Babylon, (Iraq).
Corresponding author E-mail :[email protected],[email protected]
(Received: May 20, 2013; Accepted: June 02, 2013)
A B S T R A C T A B S T R A C TA B S T R A C T A B S T R A C T A B S T R A C T
A mobile ad hoc network (MANET) is an autonomous, self-configuring network of mobile nodes that can be formed without the need of any pre-established infrastructure or centralized administration. MANETs are extremely flexible and each node is free to move independently, in any random direction. Each node in the MANET maintains continuously the information required to properly route traffic. This paper presents a simulation study to analyze and evaluate the behavior of the MANET with AODV routing protocol by testing four mobility models (i.e. Waypoint(RWP), Reference Point Group Model (RPGM), Gauss Markov Model (GMM) and Manhattan Grid Model (MGM)).
Several performance metrics (Throughput, Packet Delivery Fraction (PDF), Average End-to-end Delay (AED),Normalize Routing Load (NRL) and packets loss) were suggested as a measuring tool to be used in the comparison stage for all these four mobility models using NS-2.Various parameters such as different number of nodes, different speeds, different pause times, different environment areas and different traffic rates were also used in five suggested scenarios. The results indicated that the best performance of AODV routing protocol is with RPGM mobility model than other mobility models.
KKKKKey words : ey words : ey words : ey words : MANET , AODV , RWP, RPGM , GMM , MGM , Performance evaluation.ey words :
performance using just Random Waypoint model is not enough; a given routing protocol may not deliver optimum performance under other mobility models [Fahim Maan et al.2011].
Related work Related work Related work Related work Related work
R. Manoharan, et al. at 2010 studied three widely used mobility models such as Random Way Point, Reference Point Group and Manhattan mobility that in addition to the strengths and weaknesses of the individual multicast routing protocols, the mobility patterns does also have influence on the performance of the routing protocols. Multicast Ad hoc On-demand Distance Vector Routing protocol and adaptive demand driven multicast routing protocol have been chosen and implemented in NS2. They observed that the mobility patterns do also have influence on the performance of the routing protocols [R. Manoharan , et al. 2010].
Sunil Kumar Kaushik et al. at 2012 analyzed the behavior of five MANETs routing protocols (i.e. AODV, DSDV, DSR, OLSR and TORA) under the three mobility models (RPGM, CMM and RWP) and then they compared the performance of these protocols using NS-2 simulator in certain area of (700 x 700 m2). These routing protocols were compared in their; (PDR), (delay), (NRL) and Throughput with the change in numbers of nodes. Their simulation results showed that the Reactive protocols is much better than the proactive in the packet delivery (PDR), End-to-End delay (Delay), Normalized routing load (NRD) and throughput [Sunil Kumar Kaushik and et al. 2012].
Prajakta M. Dhamanskar, et al. at 2012 presented the performance of on-demand routing protocols such as AODV, DSR and TORA for mobile nodes following four mobility models such as Random Waypoint (RWP), Random Walk (RW), Manhattan Grid and Reference Point Group mobility model (RPGM). They stated from their simulation results that the performance of RPGM mobility model is the best and the performance of Manhattan Grid is the worst as compared to other mobility models for all these three protocols. PDR of AODV and TORA is greater than that of DSR but PDR of TORA is the best. NRL is the least in DSR and Delay is average in TORA [Prajakta M.
Dhamanskar and et al. 2012].
Routing protocols Routing protocols Routing protocols Routing protocols Routing protocols
Numbers of routing protocols for Ad Hoc networks were developed and used. Protocols were classified as proactive and reactive protocols [Ejiro .E. Igbesoko et al.2010]. This work focuses on applying and using the AODV as a reactive protocol. AODV Protocol stands for Ad-hoc On-Demand Distance Vector Routing which maintains a routing table at each node. It is proactive type & contains three essential entries in the routing table for a destination, a next hop node, a sequence number and a hop count. All packets directed to the destination are sent to the next hop node. The sequence number measures the freshness of a the route. The hop count represents the current distance to the destination node [C. P. Agrawal et al., 2008].
Mobility Models Mobility Models Mobility Models Mobility Models Mobility Models
A mobility model should be attempted to emulate the movements of the real mobile nodes. Mobility models are based on setting out different parameters related to the possible nodes movement. The basic parameters are the starting location of mobile nodes, their movement direction, velocity range, and speed changes over time. Mobility models can be classified into entity and group models. Entity models covers scenarios when mobile nodes move completely independently from each other, while in group models nodes are dependent on each other or on some predefined leader node [T. Camp et al.2002]. In this paper, the following Mobility models were studied:
RRRRRandom Wandom Wandom Wandom Wandom Waypoint Mobility Model (RWP)aypoint Mobility Model (RWP)aypoint Mobility Model (RWP)aypoint Mobility Model (RWP)aypoint Mobility Model (RWP) In RWP mobility model, each node of the network selects a random destination and moves towards it with certain chosen random velocity. Once a node reaches the destination, the node stops for a duration defined by the pause time parameter. After pause time duration, node again selects a random destination and repeats the whole process again until the simulation ends [K. Amjad, et al. 2010].
nodes are divided into groups. Every group has a group leader that determines the movements of all nodes in the group. At each instant, speed and direction of group member is calculated based on speed and direction of leader node at that instant. This model represents the movement of soldiers in a battalion, or tourists following a tourist guides [Sri Chusri Haryanti, et al. 2011].
Gauss-Markov Mobility Model Gauss-Markov Mobility Model Gauss-Markov Mobility Model Gauss-Markov Mobility Model Gauss-Markov Mobility Model
In this model, initially each mobile node is assigned a current speed and direction at each fixed interval of time. Node movement occurs by updating the speed and direction of each mobile node. Because of temporal dependency, the value of speed and direction at the particular time is calculated on the basis of the value of previous speed and direction. This model eliminates the abrupt stops, quick turns and is close to be realistic [Valentina Timcenko, et al. 2010].
Manhattan Mobility Model Manhattan Mobility Model Manhattan Mobility Model Manhattan Mobility Model Manhattan Mobility Model
In Manhattan model, movement pattern of mobile nodes were defined by map which composed of a number of horizontal and vertical streets. Node allows moving along the grid of the horizontal and vertical streets on the map. Because of temporal dependency, velocity of a mobile node at a particular time is dependent on the velocity of its previous time [Krunal Ptel, et al. 2012] .
Network Simulator NS-2 Network Simulator NS-2 Network Simulator NS-2 Network Simulator NS-2 Network Simulator NS-2
The network simulator NS-2 is a discrete event simulation software for network simulations. It simulates events such as receiving, sending, dropping and forwarding packets. NS-2.34 can be built on different platforms. It also offers a visual representation of the simulated network by tracing nodes events, movements and writing them in a file called a Network animator (NAM file) [Neha Rani, et al.2012].
This simulation study has been done using the NS-2 as a network simulator. A Linux platform (Ubuntu) was chosen. Linux offers a number of programming development tools that can be used with the required simulation process.
Performance metrics Performance metrics Performance metrics Performance metrics Performance metrics
In this simulation study the (Throughput,
Packet delivery fraction, Average end-to-end delay, Normalized Routing Load and Packets Loss) were used as the main performance metrics indicators to evaluate , analyze and compare the network behaviors with each mobility model scenario.
Methodology for Performance Evaluation Methodology for Performance Evaluation Methodology for Performance Evaluation Methodology for Performance Evaluation Methodology for Performance Evaluation
The following steps were suggested in this paper to evaluate the impact of the mobility models on the performance of 5 Metrics for an AODV routing protocol in MANET :
Step 1 Step 1 Step 1 Step 1 Step 1 Start. Step 2 Step 2 Step 2 Step 2 Step 2
Create the traffic generation file "CBR file" that generated by cbrgen.tcl (this script found in ns-allinone-2.34/ns-2.34/ind_util/cmu_scen_gen/ ). Step 3 Step 3 Step 3 Step 3 Step 3
Set p = 0 (this variable to determine the number of evaluation cases(parameters)). Step 4
Step 4 Step 4 Step 4 Step 4
select the parameters ( evaluation cases). this simulation includes varying number of nodes, varying speeds , varying areas, vary pause times and varying traffic rates.
Step 5 Step 5 Step 5 Step 5 Step 5
set i=0 ( this variable to determine the no. of mobility models).
Step 6 Step 6 Step 6 Step 6 Step 6
select the mobility models which used to determine to describe the movement pattern of mobile users, and how their location, velocity and acceleration change over time. This paper includes random waypoint, reference point group , gauss markov and manhattan grid model. This mobility models will be generated by setdest or by BonnMotion . Step 7 Step 7 Step 7 Step 7 Step 7
set s=0 (no. of scenario file (movement file) ) . Step 8
Step 8 Step 8 Step 8 Step 8
select the scenario file which used to determine the no. of nodes , nodes speed, pause times , simulation time and dimension of the topography for each mobility model.
Step 9 Step 9 Step 9 Step 9 Step 9
Step 10 Step 10 Step 10 Step 10 Step 10
add tcl file as input into NS-2 in order to perform the simulation , the output are NAM and Trace file. Step 11 Step 11 Step 11 Step 11 Step 11
using NAM file to display all event through the simulation as visualization review , while the trace file will be used to compute the performance metrics (such as throughput, packet delivery fraction, average end-to-end delay , NRL and no. of packets loss) using AWK programming language. Step12 Step12 Step12 Step12 Step12
Increment s by 1. Step 13
Step 13 Step 13 Step 13 Step 13
if ( s<10) then go to step 8 (s is no. of scenario files is 10).Otherwise go to step 14. Step 14
Step 14 Step 14 Step 14 Step 14
Increment i by 1. Step 15
Step 15 Step 15 Step 15 Step 15
If (i < 4) then go to step 6 (i is no. of mobility models evaluated in this study ) . Otherwise , go to step 16. Step 16
Step 16 Step 16 Step 16 Step 16
Increment p by 1. Step 17
Step 17 Step 17 Step 17 Step 17
If ( p < 5) then go to step 4. (p is no. of evaluation parameters) Otherwise go to step 18 Step 18
Step 18 Step 18 Step 18 Step 18
split the result files into no. of files (the number of files depends on number mobility models that will be evaluated in this paper). Step 19
Step 19 Step 19 Step 19 Step 19
calculate the final average of performance metrics for all mobility models that will be evaluated to represent its impact on MANET's performance . Step 20 Step 20 Step 20 Step 20 Step 20
split the final average from previous step into no. of files which used to draw the result. Step 21
Step 21 Step 21 Step 21 Step 21
draw the results by Xgraph , TraceGraph or by excel.
Step22: Step22: Step22: Step22: Step22: End.
The following flow chart shown in Fig 1 clarifies the implementation stages of the proposed system for the performance evaluation :
Simulation Environment Simulation Environment Simulation Environment Simulation Environment Simulation Environment
This simulation study was implemented
TTTTTable. 2 simulation environmentable. 2 simulation environmentable. 2 simulation environmentable. 2 simulation environmentable. 2 simulation environment
Network Simulator Network Simulator Network Simulator Network Simulator Network Simulator
The simulator NS-2.34
NAM 1.13
MAC Type 802.11
Radio Propagation Two Ray
Model Ground
Antenna Type Omni Antenna
T T T
T Traffic and Mobilityraffic and Mobilityraffic and Mobilityraffic and Mobilityraffic and Mobility Data Traffic Type C B R
Simulation Time 75 second
Data Payload 512 bytes
Interface Queue Type Drop Tail / Pri Queue
Mobility Models RWP , RPGM ,
GMM and MGM Routing Protocols
Routing Protocols Routing Protocols Routing Protocols Routing Protocols
Routing Protocols AODV
on personal computer with Pentium core2due processor, 2.4 GHz CPU, 2 GB RAM, 320 GB Hard Disk and Linux - Ubuntu 10.10 Operating System. Table (1) presents the suggested MANET's simulation environment implemented in this paper.
Fig .1: Implementation stages of the proposed Fig .1: Implementation stages of the proposed Fig .1: Implementation stages of the proposed Fig .1: Implementation stages of the proposed Fig .1: Implementation stages of the proposed
Simulation Results Simulation Results Simulation Results Simulation Results Simulation Results
In this section, five scenarios were suggested and implemented to evaluate and analyze the performance of mobility models for MANET, these parameters determine the impact of mobility models on the performance of MANET routing protocols. These parameters will be investigated as shown in Table 3 .
The simulation carried out 10 times for each mobility model, the sum of times is 40 for the four mobility models, the total number of times is 160 for all mobility models under five parameters. The performance metrics used in this evaluation study are; packet delivery fraction (PDF), throughput, no. of lost packets, normalized routing load (NRL) and average end-to-end delay (AED). The main used parameters in this paper are varying no. of nodes, varying speeds, varying pause times , varying simulation area and varying traffic rates. The results are shown in the following Fig.
Fig 2 shows the behavior of 5 AODV performance metrics (i.e. Throughput, PDF, Packets loss, NRL and AED) under four mobility models (i.e. RWP, RPGM, GMM and MGM) in the first Scenario (varying number of nodes).The throughput of AODV is more significant with RPGM and RWP and it is less significant with GMM and MGM.The PDF of AODV is best in RPGM and RWP. PDF in GMM and MGM is less than the others.NRL is decreased when the no. of nodes increased. NRL in RPGM is low because the group leader
decides the speed of the group members. In MGM NRL is high. The no. of packets loss in GMM and MGM is higher than RPGM and RWP, the packets loss are increased when the no. of nodes decreased. The AED is decreased when the no. of nodes increased. AED in RPGM is the least and in GMM and with MGM is highest
Fig 3 shows the behavior of 5 AODV performance metrics (i.e. Throughput, PDF, Packets loss, NRL and AED) under four mobility models (i.e. RWP,RPGM,GMM and MGM) with Scenario 2 (varying nodes speeds).The throughput of AODV was decreased when the nodes speed were increased . RPGM and RWP have high throughput and while MGM and GMM having the lowest values.The PDF of AODV were decreased when the node speed were increased . RPGM and RWP have high PDF while MGM and GMM having less values. With all the Mobility models, the PDF values increased to certain level (with speed = 20).The no. of the lost packets in GMM and MGM is highest while in RPGM and RWP is lowest, the loss packet are increased when the node speed increased after nodes speed exceeds 20.The NRL of this The AED is increased when the node speed increased . AED in RPGM is the lowest and with MGM and GMM is highest.protocol is increases with high speed for all mobility models. RPGM has low NRL than other mobility models while MGM has high NRL The AED is increased when the node speed increased . AED in RPGM is the lowest and with MGM and GMM is highest.
TTTTTable . 3 : General Pable . 3 : General Pable . 3 : General Pable . 3 : General Parameters for All scenariosable . 3 : General Parameters for All scenariosarameters for All scenariosarameters for All scenariosarameters for All scenarios
No. No. No. No.
No. Scenario NameScenario NameScenario NameScenario NameScenario Name No. of nodesNo. of nodesNo. of nodesNo. of nodesNo. of nodes Node SpeedNode SpeedNode SpeedNode SpeedNode Speed PPPPPause Timeause Timeause Timeause Timeause Time Area SizeArea SizeArea SizeArea SizeArea Size TTTTTrafficrafficrafficrafficraffic Rate Rate Rate Rate Rate
1 No. of Nodes 25 , 50
75,100 20 15 1000*1000 4
2 Node Speeds 25 10 , 20
40 , 60 10 1000*1000 4
3 Pause Times 50 40 0 , 6
10 ,14 1000*1000 4
4 Area Sizes 60 20 12 500*500 , 700*700
1000*1000 , 4
1200*1200
5 Traffic Rates 75 15 10 1000*1000 4,8
FFFFFig 2[a-e]: The behavior of 5 Aig 2[a-e]: The behavior of 5 Aig 2[a-e]: The behavior of 5 Aig 2[a-e]: The behavior of 5 Aig 2[a-e]: The behavior of 5 AODODODODODVVVVV performance metrics under four mobility performance metrics under four mobilityperformance metrics under four mobility performance metrics under four mobility performance metrics under four mobility models with varying number of nodes. models with varying number of nodes. models with varying number of nodes. models with varying number of nodes. models with varying number of nodes.
FFFFFig 3[a-e]: The behavior of 5 Aig 3[a-e]: The behavior of 5 Aig 3[a-e]: The behavior of 5 Aig 3[a-e]: The behavior of 5 Aig 3[a-e]: The behavior of 5 AODODODODVVVVVOD performance metrics under four mobility performance metrics under four mobility performance metrics under four mobility performance metrics under four mobility performance metrics under four mobility
FFFFFig 5 [a-e]: The behavior of 5 Aig 5 [a-e]: The behavior of 5 Aig 5 [a-e]: The behavior of 5 Aig 5 [a-e]: The behavior of 5 Aig 5 [a-e]: The behavior of 5 AODODODODODVVVVV performance metrics under four mobility performance metrics under four mobility performance metrics under four mobility performance metrics under four mobility performance metrics under four mobility
models with varying areas. models with varying areas.models with varying areas. models with varying areas.models with varying areas. FFFFFig 4[a-e]: The behavior of 5 Aig 4[a-e]: The behavior of 5 Aig 4[a-e]: The behavior of 5 Aig 4[a-e]: The behavior of 5 Aig 4[a-e]: The behavior of 5 AODODODODODVVVVV
performance metrics under four mobility performance metrics under four mobilityperformance metrics under four mobility performance metrics under four mobility performance metrics under four mobility
Fig 4 shows the behavior of 5 AODV performance metrics (i.e. Throughput, PDF, Packets loss, NRL and AED) under four mobility models (i.e. RWP, RPGM, GMM and MGM) with varying pause times. Throughput of RPGM is extremely better than all the other mobility models and MGM and GMM have clearly worst results. The AODV has best PDF with RPGM mobility model . RWP is better next to RPGM. PDF in MGM and GMM is very low in comparison of RPGM RWP mobility Models. In MGM and GMM, the no. of packets loss increased when the value of the pause times increased, RPGM and RWP provides a lowest no. of packet loss. The normalized routing load of AODV can be easily arranged in an order from best to worst as follows: RPGM, RWP, GMM and MGM.The RPGM and KWP exhibit the lowest delay and GMM and MGM highest delay.
Fig 5 shows the behavior of 5 AODV performance metrics (i.e. Throughput, PDF, Packets loss, NRL and AED) under four mobility models (i.e. RWP, RPGM, GMM and MGM) with varying simulation areas.The throughput of AODV became highest in RPGM and RWP and is lowest with MGM and GMM.The PDF of AODV became highest in RPGM and RWP and is lowest with MGM and GMM.The no. of packets loss in GMM and MGM is highest while in RPGM and RWP is lowest. The packets loss are increased when the environment size increased,The NRL of this protocol is decreases with large environment size for all mobility models. RPGM has low NRL than other mobility models while MGM has the higher value.The AED is increased when the environment size is increased . AED in RPGM is lowest and in MGM and GMM is the highest
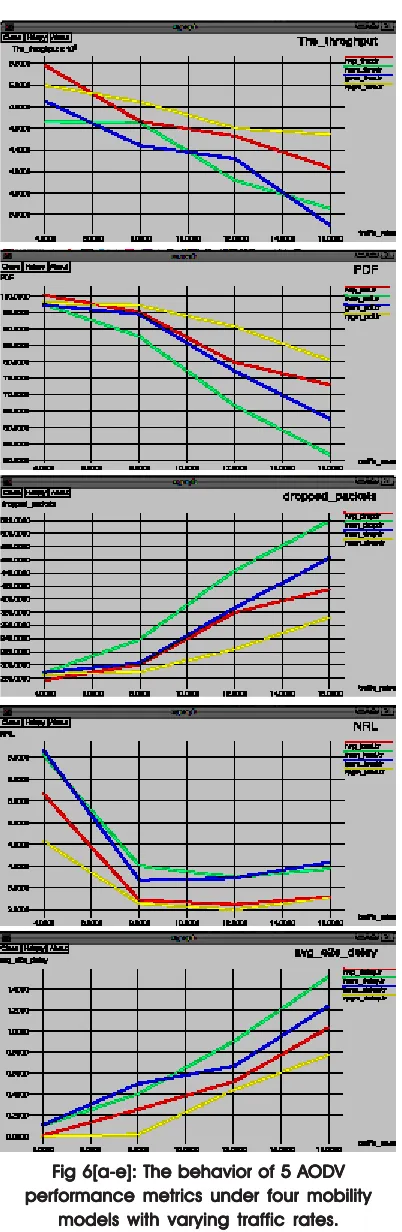
Fig 6 shows the behavior of 5 AODV performance metrics (i.e. Throughput, PDF, Packets loss, NRL and AED) under four mobility models (i.e. RWP, RPGM, GMM and MGM) with varying traffic rates.The throughput of AODV became lower when the network load is higher. This protocol is highest throughput with RPGM and lowest with MGM and GMM.The PDF of AODV became lower when the network load is higher. This protocol is highest PDF with RPGM and lowest with MGM and GMM.The no. of packets loss in GMM and MGM is highest while in RPGM and RWP is lowest, FFFFFig 6[a-e]: The behavior of 5 Aig 6[a-e]: The behavior of 5 Aig 6[a-e]: The behavior of 5 Aig 6[a-e]: The behavior of 5 Aig 6[a-e]: The behavior of 5 AODODODODODVVVVV
performance metrics under four mobility performance metrics under four mobilityperformance metrics under four mobility performance metrics under four mobility performance metrics under four mobility
the loss packet are increased when the traffic rate increased.The NRL is decreased when the traffic rate is increased. The NRL in RPGM is the lowest and in MGM is the highest .The AED of AODV is increased when the traffic rate increased . This protocol with GMM and MGM shows highest AED but with RPGM gives the lowest AED values.
CONCLUSION CONCLUSION CONCLUSION CONCLUSION CONCLUSION
In this paper, the performance of the four mobility models was evaluated and analyzed using NS-2 and Bonn Motion according to 5 performance metrics . This evaluation study shows that the RPGM was best mobility model suited for AODV routing protocol when compared to other available mobility models.
1. [C. Gomez et al. 2004]. C. Gomez, X. Marchador, V. Gonzalez and J. Paradells, “Multilayer analysis of the influence of mobility models on TCP flows in AODV ad-hoc networks”, FEDER and the Spanish Government through project TIC2003-01748, Spain, (2005).
2. [C.P.Agrawal et al. 2008]. C.P.Agrawal, M.K Tiwari, and O.P.Vyas, “Evaluation of AODV Protocol for Varying Mobility Models of MANET for Ubiquitous Computing”, IEEE, Third 2008 International Conference on Convergence and Hybrid Information Technology, India., (2008).
3. [Ejiro .E. Igbesoko et al. 2010] Ejiro .E. Igbesoko, Thaddeus Onyinye Eze and Mona Ghassemian, “ Performance Analysis of MANET Routing Protocols over Different Mobility Models “, London, (2009). 4. [Fahim Maan et al. 2011]. Fahim Maan and
Nauman Mazhar, “MANET Routing Protocols vs Mobility Models: A Performance Evaluation”, IEEE, (2011). 5. [K. Amjad et al. 2010] K. Amjad and A.J.
Stocker, “Impact of node density and mobility on the performance of AODV and DSR in MANETS” , IEEE, (2010).
6. [Krunal Ptel et al. 2012] Krunal Ptel and Krunal Ptel, “Performance Evaluation of Stable AODV Routing Protocol under Different Mobility Models”, International Journal of Computer Applications (0975 – 8887) 43(8)43(8)43(8)43(8)43(8), (2012).
7. [Neha Rani et al. 2012] Neha Rani, Preeti Sharma and Pankaj Sharma, “Performance Comparison Of Various Routing Protocols
R E F E R E N C E S R E F E R E N C E SR E F E R E N C E S R E F E R E N C E S R E F E R E N C E S
Indifferent Mobility Models” , International Journal of Ad hoc, Sensor & Ubiquitous Computing (IJASUC) 3(4)3(4)3(4)3(4), (2012) .3(4) 8. [Prajakta M. Dhamanskar and et al. 2012]
Prajakta M. Dhamanskar and Dr. Nupur Giri, “Performance evaluation of On Demand MANET protocols for different mobility models”, International Journal of Emerging Technology and Advanced Engineering, ISSN 2250-2459, 2(9)2(9)2(9)2(9) ,(2012).2(9)
9. [R. Manoharan et al.2010] R. Manoharan and E. Ilavarasan, “IMPACT OF MOBILITY ON THE PERFORMANCE OF MULTICAST ROUTING PROTOCOLS IN MANET”, International Journal of Wireless & Mobile Networks(IJWMN), 2(2)2(2)2(2)2(2)2(2),(2010).
10. [Sri Chusri Haryanti et al. 2011] Sri Chusri Haryanti and Riri Fitri Sari, “Effect of RPGM and Gauss Markov Node Mobility for Resource Allocation Performance in Mobile Ad Hoc Computational Grid”, IJCSNS International Journal of Computer Science and Network Security, 11(6)11(6)11(6)11(6)11(6), (2011). 11. [Sunil Kumar Kaushik et al. 2012] Sunil
13. [Valentina Timcenko et al.2010] Valentina Timcenko, Mirjana Stojanovic and Slavica Bostjancic Rakas, “MANET Routing protocols vs. mobility models: Performance