COMPUTER SCIENCE & TECHNOLOGY
www.computerscijournal.org
March 2017, Vol. 10, No. (1): Pgs. 255-259 An International Open Free Access, Peer Reviewed Research Journal
Published By: Oriental Scientific Publishing Co., India.
Comparative Evaluation of WOFOST and CERES-rice
Models in Simulating Yield of rice Cultivars at Navsari
NILESH J. HADIYA
1, NEERAJ KUMAR
1, B. M. MOTE
2*,
CHIRAGKUMARM. THUMAR
1and D. D. PATIL
21Agricultural Meteorological Cell, Department of Agriculutral Engineering,
Navsari Agricultural University, Navsari- 396 450 (Gujarat) India.
2Dept. of Agriliculture Meteorology, Anand Agricultural University,Anand-388 110, India.
*Corresponding author E-mail: [email protected] http://dx.doi.org/10.13005/ojcst/10.01.35
(Received: January 13, 2017; Accepted: January 30, 2017)
ABSTRACT
A field experiment was conducted during kharif season of 2015 to assess the prediction performance of CERES-Rice and WOFOST modelfor grain and straw yield of three rice cultivars viz., (V1:Jaya, V2: Gurjari and V3: GNR-2) sown under four different environments viz., (D1: 10/07/2015,
D2: 25/07/2015, D3: 09/08/2015 and D4: 24/08/2015) with two nitrogen levels N1:75 and N2:100 kg NPK/ha-1.Results showed that the prediction of WOFOST model for grain yield of rice cultivars under
different treatments more close to the corresponding observed value with percent error PE between (18.66%)as camper to CERES-rice model with PE (28.56%), but for straw yield CERES-rice model give moreclose prediction than WOFOST model with PE (20.99%) and (27.33%) between predicted and observed value.
Keywords: WOFOST, CERES, simulation, rice cultivars, date of sowing, nitrogen levels.
INTRODUCTION
Crop Simulation model is a computer model used to simulate reality it can be used to simulate crop growth, development and estimate yield of crop as a function of weather condition and management practices. Before using any model, it needs proper calibration and validation. Once model is properly validated, it can be used for various application viz., predicting growth, development and yield of crops, to study response of various climatic parameters and management practices on crops. The crop growth simulation model has
CERES, WOFOST, WTGROWS, INFOCROP etc. Among these models in present study CERES-rice and WOFOST model were used for prediction of grain and straw yield of different rice cultivars under different environment and nitrogen levels.
MATERIALS AND METHODS
Minimum data requirement
To generate the required experimental and crop management data, a field experiment was
conducted at Agronomy farm of N. M. College of Agriculture, Navsari Agricultural University, Navsari (20° 57' N, 72° 54' E and 16 m above mean sea level), Gujarat, India, during rainy season of the year 2015. Daily data on weather parameters, like sunshine hours, rainfall, minimum temperature and maximum temperature, required for the model were recorded at weather station located in the vicinity of the experimental field. The soil profile data needed for the model was retrieved from the publication of earlier research work on characterization of Navsari
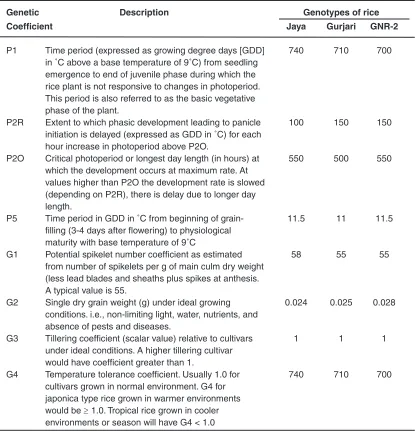
Table 1: Genetic coefficients of three different cultivars used in CERES-rice model
Genetic Description Genotypes of rice
Coefficient Jaya Gurjari GNR-2
P1 Time period (expressed as growing degree days [GDD] 740 710 700 in ˚C above a base temperature of 9˚C) from seedling
emergence to end of juvenile phase during which the rice plant is not responsive to changes in photoperiod. This period is also referred to as the basic vegetative phase of the plant.
P2R Extent to which phasic development leading to panicle 100 150 150 initiation is delayed (expressed as GDD in ˚C) for each
hour increase in photoperiod above P2O.
P2O Critical photoperiod or longest day length (in hours) at 550 500 550 which the development occurs at maximum rate. At
values higher than P2O the development rate is slowed (depending on P2R), there is delay due to longer day length.
P5 Time period in GDD in ˚C from beginning of grain- 11.5 11 11.5 filling (3-4 days after flowering) to physiological
maturity with base temperature of 9˚C
G1 Potential spikelet number coefficient as estimated 58 55 55 from number of spikelets per g of main culm dry weight
(less lead blades and sheaths plus spikes at anthesis. A typical value is 55.
G2 Single dry grain weight (g) under ideal growing 0.024 0.025 0.028 conditions. i.e., non-limiting light, water, nutrients, and
absence of pests and diseases.
G3 Tillering coefficient (scalar value) relative to cultivars 1 1 1 under ideal conditions. A higher tillering cultivar
would have coefficient greater than 1.
G4 Temperature tolerance coefficient. Usually 1.0 for 740 710 700 cultivars grown in normal environment. G4 for
soils (Jalalpur series). The initial soil characteristics were determined by collecting samples from the profile depth extending up to 45 cm depth and analyzing in the college laboratory. All records of inputs applied were maintained. Treatments of the field experiment included three rice cultivars (V1:Jaya, V2: Gurjari and V3: GNR-2) sown under four different environments viz., (D1: 10/07/2015, D2: 25/07/2015, D3: 09/08/2015 and D4: 24/08/2015) with two nitrogen levels N1:75 and N2:100 kg NPK/ ha-1. Both The model were validated with 2015 year experimental data and calibration with past years 2012, 2013 and 2014 data. The main aim was to find out which model give accurate prediction of rice cultivars under different environment and nitrogen levels. Both the model was run separately for each variety under different dates of transplanting and nitrogen levels. The calibration of both models are based on certain Genetic coefficients. Genetic coefficients of all three rice cultivars used in the both model safter carefully adjustment. However, the adjusted Genetic coefficients for all three rice cultivars of CERES-rice model given in (Table 1) and WOFOST model in (Table 2).The different test criteria viz. mean of observed and simulated values, root mean square error (RMSE), mean bias error (MBE) and mean percent error (PE) were used to evaluate the performance of model for simulation of yield and yield attributes characters of allthree rice cultivars.
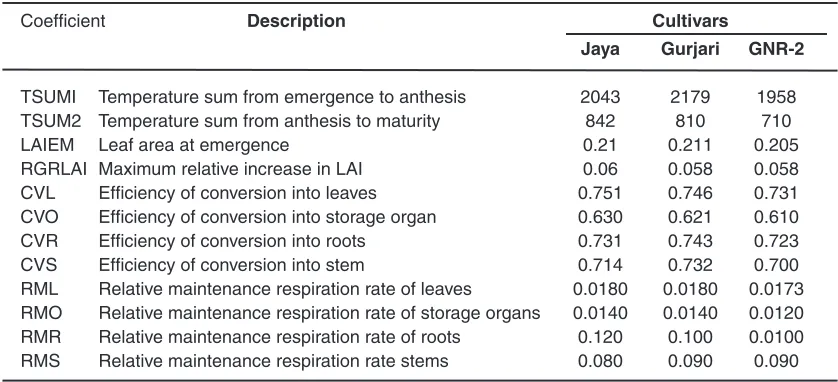
Table 2: Genetic coefficients of three different cultivars usedin WOFOST model
Coefficient Description Cultivars
Jaya Gurjari GNR-2
TSUMI Temperature sum from emergence to anthesis 2043 2179 1958 TSUM2 Temperature sum from anthesis to maturity 842 810 710
LAIEM Leaf area at emergence 0.21 0.211 0.205
RGRLAI Maximum relative increase in LAI 0.06 0.058 0.058 CVL Efficiency of conversion into leaves 0.751 0.746 0.731 CVO Efficiency of conversion into storage organ 0.630 0.621 0.610 CVR Efficiency of conversion into roots 0.731 0.743 0.723 CVS Efficiency of conversion into stem 0.714 0.732 0.700 RML Relative maintenance respiration rate of leaves 0.0180 0.0180 0.0173 RMO Relative maintenance respiration rate of storage organs 0.0140 0.0140 0.0120 RMR Relative maintenance respiration rate of roots 0.120 0.100 0.0100 RMS Relative maintenance respiration rate stems 0.080 0.090 0.090
RESULTS AND DISCUSSIONS
Grain yield
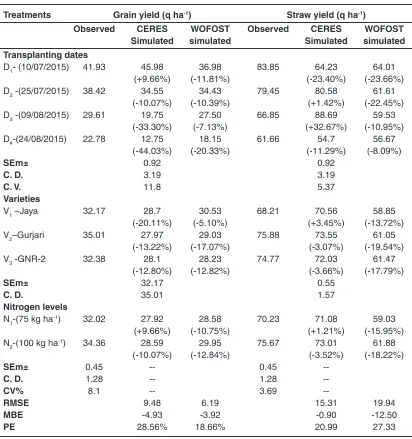
Among the dates of transplanting grain yield was higher D1 transplanted crop (41.39 q ha-1)
with compared to rest of the transplanting dates, with delay of transplanting after D1 (10h July) grain yield was decreases. (Mote, 2013) also reported that the grain yield is decreases due to delayed of date of transplanting. The difference between the D1and D4 transplanting was (19.15 q ha-1) Table 3. In
(RMSE), mean bias error (MBE) and percent error (PE) of (6.19,-3.92 and 18.66) and CERES-rice model (9.48, -4.93 and 28.56) respectively.
Straw yield
In different dates of transplanting straw yield was maximum in D1 transplanted crop (83.85 q ha-1) with compared to rest transplanting of date.
The difference between the D1 and D4 transplanting
was (22.19 q ha-1) Table 3. In case of prediction
of straw yield CERES-rice model was predicted more accurately with PE varied between (-1.43 to +32.67%) in different date of transplanting as compared to WOFOST model (-8.09 to +23.66%). Similarly in case of cultivars also CERES-ricemodel give better prediction with PE between (-3.66 to 3.45%) as compared to WOFOST model (-13.72 to-19.54%). Also in different nitrogen levels prediction
Table 3: Comparison between observed values and simulated values by CERES-Rice and WOFOST model for grain yield and straw yield of
different rice cultivars under different environment
Treatments Grain yield (q ha-1) Straw yield (q ha-1)
Observed CERES WOFOST Observed CERES WOFOST
Simulated simulated Simulated simulated
Transplanting dates
D1- (10/07/2015) 41.93 45.98 36.98 83.85 64.23 64.01 (+9.66%) (-11.81%) (-23.40%) (-23.66%) D2 -(25/07/2015) 38.42 34.55 34.43 79.45 80.58 61.61
(-10.07%) (-10.39%) (+1.42%) (-22.45%) D3 -(09/08/2015) 29.61 19.75 27.50 66.85 88.69 59.53
(-33.30%) (-7.13%) (+32.67%) (-10.95%) D4-(24/08/2015) 22.78 12.75 18.15 61.66 54.7 56.67
(-44.03%) (-20.33%) (-11.29%) (-8.09%)
SEm± 0.92 0.92
C. D. 3.19 3.19
C. V. 11.8 5.37
Varieties
V1 –Jaya 32.17 28.7 30.53 68.21 70.56 58.85
(-20.11%) (-5.10%) (+3.45%) (-13.72%)
V2–Gurjari 35.01 27.97 29.03 75.88 73.55 61.05
(-13.22%) (-17.07%) (-3.07%) (-19.54%)
V3 -GNR-2 32.38 28.1 28.23 74.77 72.03 61.47
(-12.80%) (-12.82%) (-3.66%) (-17.79%)
SEm± 32.17 0.55
C. D. 35.01 1.57
Nitrogen levels
N1-(75 kg ha-1) 32.02 27.92 28.58 70.23 71.08 59.03
(+9.66%) (-10.75%) (+1.21%) (-15.95%) N2-(100 kg ha-1) 34.36 28.59 29.95 75.67 73.01 61.88
(-10.07%) (-12.84%) (-3.52%) (-18.22%)
SEm± 0.45 -- 0.45
--C. D. 1.28 -- 1.28
--CV% 8.1 -- 3.69
--RMSE 9.48 6.19 15.31 19.94
MBE -4.93 -3.92 -0.90 -12.50
of CERES-rice model was closer at N1 level with PE (+1.21%) followed by N2 (-3.52%) compared to WOFOST model (-15.5%) and -18.22%). different test criteria viz., RMSE, MBE, and PE between the predicted and corresponding observed values for straw yield also showed that the performance of CERES-ricew as accurately than WOFOST model with root mean square error (RMSE), mean bias error (MBE) and percent error (PE) of (15.31,-0.99 and 20.99) and WOFOST model with (19.94,-12.50 and 27.33) respectively.
CONCLUSION
Prediction of grain and straw yield of rice cultivars under different treatment by CERES and WOFOST with more or less same percent error but prediction for grain yield was more accurately by WFOST model. In case of straw yield, CERES model give close prediction for all cultivars under different transplanting dates but under nitrogen levels accuracy of WFOST wasbetter.
REFERENCES
1. Mote (2013).Simulation modeling of rice (Oryza sativa L.) cultivars using DSSAT model (version 4.5) for South Gujarat heavy rainfall zone.Ph.D. (Agricultural Meteorology) thesis submitted to NAU, Navsari.