Modern Journal of Language Teaching Methods ISSN: 2251-6204
Vol. 6, Issue 7, October 2016
Page 1
Modern Journal of Language Teaching Methods ISSN: 2251-6204
Vol. 6, Issue 7, October 2016
Page 2
Modern Journal of Language Teaching Methods (MJLTM)
ISSN: 2251 - 6204
www.mjltm.com
Editor – in – Chief
Hamed Ghaemi, Assistant Professor in TEFL, Islamic Azad University (IAU)
Editorial Board:
1.
Abednia Arman, PhD in TEFL, Allameh Tabataba’i University, Tehran, Iran
2.
Afraz Shahram, PhD in TEFL, Islamic Azad University, Qeshm Branch, Iran
3.
Amiri Mehrdad, PhD in TEFL, Islamic Azad University, Science and research
Branch, Iran
4.
Azizi Masoud, PhD in Applied Linguistics, University of Tehran, Iran
5.
Basiroo Reza, PhD in TEFL, Islamic Azad University, Bushehr Branch, Iran
6.
Dlayedwa Ntombizodwa, Lecturer, University of the Western Cape, South Africa
7.
Doro Katalin, PhD in Applied Linguistics, Department of English Language
Teacher Education and Applied Linguistics, University of Szeged, Hungary
8.
Dutta Hemanga, Assistant Professor of Linguistics, The English and Foreign
Languages University (EFLU), India
9.
Elahi Shirvan Majid, PhD in TEFL, Ferdowsi University of Mashhad, Iran
10.
Fernández Miguel, PhD, Chicago State University, USA
11.
Ghaemi Hamide, PhD in Speech and Language Pathology, Mashhad University
of Medical Sciences, Iran
12.
Ghafournia Narjes, PhD in TEFL, Islamic Azad University, Neyshabur Branch,
Iran
13.
Grim Frédérique M. A., Associate Professor of French, Colorado State University,
USA
14.
Izadi Dariush, PhD in Applied Linguistics, Macquarie University, Sydney,
Australia
15.
Kargozari Hamid Reza, PhD in TEFL, Payame Noor University of Tehran, Iran
16.
Kaviani Amir, Assistant Professor at Zayed University, UAE
17.
Kirkpatrick Robert, Assistant Professor of Applied Linguistics, Shinawatra
International University, Thailand
Modern Journal of Language Teaching Methods ISSN: 2251-6204
Vol. 6, Issue 7, October 2016
Page 3
18.
Mehrani Mehdi, PhD in TEFL, University of Neyshabur, Neyshabur, Iran
19.
Morady Moghaddam Mostafa, PhD in TEFL, University of Tabriz, Iran
20.
Mouton Nelda, PhD in Education Management, North-West University
(NWU), South Africa
21.
Najafi Sarem Saeid, PhD Candidate in TEFL, Islamic Azad University, Science
and Research Branch, Tehran, Iran
22.
Naicker Suren, Department of Linguistics and Translation, University of South
Africa
23.
Ndhlovu Finex, PhD, Linguistics Programme, University of New England,
Australia
24.
Raddaoui Ali Hechemi, PhD, Associate Professor of Applied Linguistics,
University of Wyoming in Laramie, USA
25.
Rezaei Saeed, PhD in TEFL, Sharif University of Technology, Tehran, Iran
26.
Rolstad Kellie, PhD, Associate Professor of Education, University of Maryland,
USA
27.
Roohbakhshfar Hamid, PhD in TESOL, Islamic Azad University, Neyshabur
Branch, Iran
28.
Sanatifar Mohammad Saleh, PhD in Translation Studies, Tabaran Institute of
Higher Education, Mashhad, Iran.
29.
Shafiee Sajad, Department of English, Shahrekord Branch, Islamic Azad
University, Shahrekord, Iran
30.
Stobart Simon, PhD, Dean of Computing, Teesside University, UK
31.
Suszczynska Malgorzata, Senior Assistant Professor, University of Szeged,
Hungary
32.
Tabeifard Sayed Javad, PhD in ELT, University of Tehran, Kish International
Campus, Iran
33.
Weir George R. S., PhD in Philosophy of Psychology, University of Strathclyde,
Glasgow, UK
34.
Zabihi Reza, PhD in TEFL, University of Neyshabur, Neyshabur, Iran
35.
Zegarac Vladimir, PhD, University of Bedfordshire, UK
Modern Journal of Language Teaching Methods ISSN: 2251-6204
Vol. 6, Issue 7, October 2016
Page 4
Abstracting/Indexing
Index
Copernicus 2011
Modern Journal of Language Teaching Methods ISSN: 2251-6204
Vol. 6, Issue 7, October 2016
Page 5
Linguistics Abstract
EBSCO Publication
Lulu Publication
Modern Journal of Language Teaching Methods ISSN: 2251-6204
Vol. 6, Issue 7, October 2016
Page 6
Directory of Open Access Journals
ProQuest
Modern Language Association
Cabell's Directories
Modern Journal of Language Teaching Methods ISSN: 2251-6204
Vol. 6, Issue 7, October 2016
Page 7
COPE
Directory of Research Journal Indexing (DRJI)
Indian Citation Index
Modern Journal of Language Teaching Methods ISSN: 2251-6204
Vol. 6, Issue 7, October 2016
Page 8
International Society of Universal Research in Sciences
Ulrich's
Modern Journal of Language Teaching Methods ISSN: 2251-6204
Vol. 6, Issue 7, October 2016
Page 9
IRANIAN EFL LEARNERS’ LANGUAGE LEARNING STYLE
PREFERENCES AND EFL TEACHERS’ PERCEPTIONS
OF SUCH PREFERENCES
Sara Shafiee
Department of English, Shiraz Branch, Islamic Azad University, Shiraz, Iran [email protected]
Mohammad S.Bagheri
Department of English, Shiraz Branch, Islamic Azad University, Shiraz, Iran [email protected]
ABSTRACT
THE AIM OF THE PRESENT STUDY WAS TO INVESTIGATE THE EXTENT TO WHICH, TEACHERS ARE AWARE OF THEIR STUDENTS' LEARNING STYLE PREFERENCES. THE PARTICIPANTS IN THIS STUDY WERE 176 EFL LEARNERS (MALE AND FEMALE) AND 30 MALE AND FEMALE TEACHERS TEACHING ENGLISH AT THREE OF THE MOST WELL-KNOWN LANGUAGE INSTITUTES IN SHIRAZ. THE INSTRUMENT USED IN THIS STUDY WAS A QUESTIONNAIRE IN TWO VERSIONS (FOR TEACHERS AND LEARNERS SEPARATELY) DEVELOPED BY BRINDLEY (1984) AND MODIFIED BY THE RESEARCHER. IN ORDER TO FIND OUT THE EXTENT TO WHICH TEACHERS ARE AWARE OF THEIR LEARNERS’ LEARNING STYLE PREFERENCES, MULTIPLE INDEPENDENT SAMPLE T-TESTS WERE RUN. THE FINDINGS REVEALED THAT TEACHERS WERE WELL AWARE OF SUCH INTERESTS AND PREFERENCES, ONLY IN SOME CASES A FEW DISCREPANCIES WERE FOUND (COPYING FROM THE BOARD AS A LEARNING TECHNIQUE, AVOIDING VERBATIM TRANSLATION, BEING CORRECTED IMMEDIATELY, PREFERRED MEDIA OF LEARNING, GAMES AND ROLE PLAYS AS CLASS ACTIVITIES, AND SATISFACTION FROM GRADED WORKS).
KEYWORDS: LEARNERS’ PREFERENCES, TEACHERS‘PERCEPTIONS, LEARNING STYLE
1. Introduction
Learning styles are described in different terms as: leaning preferences, sensory orientations, and intelligence styles. But what exactly learning styles or preferences are, needs to be discussed. The concept of learning style or preference has been described by many researchers in different ways. Reid (1998) defines learning styles as internally based characteristics often not perceived or consciously used by learners for the intake and comprehension of new information. Keef (1989) describes learning styles as the cognitive, affective, and physiological factors that serve as relatively stable indicators of how learners perceive, interact with, and respond to the learning environment. Included in this comprehensive definition are "cognitive styles," which are intrinsic information-processing patterns that represent a person's typical mode of perceiving, thinking, remembering, and problem-solving. Celce-Murcia (2001) defines learning styles as the general approaches-- for example, global or analytic, auditory or visual-- that students use in acquiring a new language or in learning any other subject. These styles are the overall patterns that give general direction to language behavior. The gist of all-above mentioned definitions is that
Modern Journal of Language Teaching Methods ISSN: 2251-6204
Vol. 6, Issue 7, October 2016
Page 10
learning styles are the individual’s characteristic and personal ways of processing information, feeling, and behaving in learning context and that they differ from one language learner to another.
While learners’ preferences in learning are definitely of great importance, these are the teachers who have to put the theories of optimum learning into practice. So far, not many researchers have considered teachers’ perceptions of learners’ learning style preferences as the core of their studies.
Despite a large number of studies that have been carried out regarding learners’ preferences, a few of them have emphasized teachers’ styles and preferences in teaching as an indispensable part of such studies. Moreover, most teachers and learners are not aware of such differences in learning and teaching style, and those who are, rarely take them into account, practically.
2. Literature Review
It has been a long time since the scholars; teachers and applied linguists have taken learners’ needs and preferences into consideration while setting the lesson plans and teaching. The more the teachers are aware of their students preferences in learning, the more effective are the methods applied by them, and the greater achievement and satisfaction is gained as a result, Thus, it is not surprising that along with the latest teaching methods focusing on learners’ needs, more and more studies are concerned with learners, their needs and preferences as time goes by.
Learning styles have been classified in various ways by different educators and researchers through the years, of which several have been the basis of studies in this domain. The most general categorization seems to be offered by Reid (1995) who categorized learning styles in terms of cognitive; sensory, and personality learning styles. Brown (2000) considered tolerance of ambiguity as a style as well.
Another classification of learning styles was devised by Reid (1998). These six learning styles adopted from Reid’s Perceptual Learning Style Preference Questionnaire are Visual, Auditory, Kinesthetic, Tactile, Group learning, and Individual learning.
Another thorough and frequently-cited model of learning style in different studies of this type is the one devised by Kolb in 1984.For the first time he devised this model based on his observations of the students’ distress in classes due to mismatches between their learning styles and disciplinary majors (Kolb, 1981, cited in Montgomary & Groat, 1998). He considered learning styles on a continuum ranging from Concrete experience, Reflective observation, and Abstract conceptualization to Active experimentation.
In the 1940s, Briggs Myers developed the Myers-Briggs Type Indicator (MBTI), an instrument that measures, among other things, the degree to which an individual prefers sensing or intuition. This well-known model of identifying learners’ learning styles devised by Briggs Myers and Cooks Briggs (McCaulley, et al., 1983; Schroeder, 1993, cited in Montgomery and Groat, 1998) has been widely used in studies in this domain. It contains four dimensions classified as follows: Orientation to life, Perception, Decision making, and Attitude to the outside world.
Another well-known categorization is offered by Felder and Silverman (Felder, 1993; Felder and Silverman, 1988) who mention five aspects of learning styles of which two are a replication of Myers-Briggs and Kolb’s model. Their model investigates learners’ preferences for learning in terms of four dimensions: active v. reflective, sensing v. intuitive, visual v. verbal and sequential v. global.
One of the most noticeable studies in this domain was conducted by Reid in 1987. She examined 1388 students’ perceptual learning style using Perceptual Learning Style Preference Questionnaire (PLSPQ). As a result, it was found that kinesthetic and tactile learning styles are strongly preferred by ESL learners in comparison to audio and visual styles. Like the results of similar studies, group learning was not appealing to most learners compared to individual learning. According to the results of her study, graduate students were more interested in visual and tactile
learning styles than undergraduates, though kinesthetic and tactile learning styles were preferred by both graduates and undergraduates learners.
Modern Journal of Language Teaching Methods ISSN: 2251-6204
Vol. 6, Issue 7, October 2016
Page 11
Wintergerst, DeCapua, and Marilyn (2003) also examined the learning style preferences of three different populations (Russian EFL students, Russian ESL students, and Asian ESL students). It was uncovered through the findings that group works were preferred to individual works by all three groups, particularly by Russian EFL and Asian ESL students. Once more the role of cultural differences was emphasized in gaining the final results.
Stapa (2003) carried out a study among ESP learners at the National University of Malaysia. Her subjects were 53 students, who were doing a course called English for Hospitality Purposes offered by the Faculty of Language Studies, and three teachers, teaching these students. Adopting a questionnaire developed by Brindley (1984), the study aimed to investigate the styles preferred by these ESP learners and find out whether the teachers are aware of their students' learning preferences. The findings showed that students’ preferences do indeed correlate with those of teachers in many instances.
Considering all of the above-mentioned works in this field and the increasing need for more comprehensive and various studies with different study contexts and variables, the present study was conducted to take a step toward confronting this topical issue in current world of teaching.
3. Objectives of the Study
Learners’ preferences in learning have always been among topical issues in language teaching; taking such preferences and their variety among individual learners into consideration , the main objective of the present study is to investigate the extent to which the teachers are aware of their students' learning style preferences.
4. Research Question
Based on the objectives, this study seeks to answer the following question.
1. To what extent are teachers aware of their students' learning style preferences?
5. Methodology
5.1. Participants
176 Iranian EFL learners (66 male and 110 female) and 30 (15 male and 15 female) Iranian EFL teachers from three most well-known language institutes in Shiraz (Iran Language Institute, Bahar and Navid language institutes) constituted the sample. The participants were all native speakers of Persian. The learner participants ranged from upper-intermediate to advanced learners in terms of proficiency level. The sampling strategy for selecting the participants was convenience sampling; since the researcher gathered the required data in the language institutes she was teaching and thus had access to.
5.2 Instruments
The instrument used in this study was a 13-item questionnaire developed by Brindley (1984) and modified by the researcher. It asks about students' and teachers’ name, sex, age, and learners’ preferences in learning English and teachers’ perceptions in this regard. This questionnaire is used to determine the learners' learning style preferences and teachers' perceptions of such preferences. The questionnaire has two versions: Version 1 (see Appendix A), is designed for students and Version 2 (see Appendix B), for teachers.
In Version 1, the students are supposed to state how they prefer to learn the language, for example, if they are satisfied with their achievement in English, whether they benefit from working in groups, pairs, or individually, and how they allocate and utilize time for inside and/or outside classroom ( if they do), in addition to their preferred means of learning (e.g. listening, reading, note-making, copying from board, etc.); moreover their preferred ways of being corrected and getting informed about their improvement in language learning are evaluated through some other items in this questionnaire. In Version 2, the teachers are asked to express their opinions as to how they feel their students prefer to learn the language through similar items. In the current
Modern Journal of Language Teaching Methods ISSN: 2251-6204
Vol. 6, Issue 7, October 2016
Page 12
version modified by the researcher, the original yes/no responses are converted to Likert scale responses as: 1= never, 2=hardly ever, 3=sometimes, 4= usually, 5= always.
To investigate the reliability of the questionnaires, the researcher conducted a pilot study. Then, the researcher ran two Cronbach's Alpha tests independently for the teachers’ and learners’ modified versions of the questionnaires. The results showed that the questionnaire demonstrated internal reliability, achieving an alpha coefficient of .860 for the items measuring students’ learning preferences and .846 for those measuring teachers' perceptions of these preferences.
6. Data Analysis
In order to determine the extent of language teachers’ awareness of EFL learners’ learning style preferences, multiple t-tests were run for each item of the questionnaire separately. For analyzing the data, SPSS 16 was used.
7. Results
One of the main objectives of the current study is to examine the degree of agreement between teachers’ and learners’ responses to find out the extent to which the teachers are aware of the learners’ preferences in learning and encourage them to apply the techniques by which optimal conditions for learning could be created. To do so, after evaluating teachers’ and learners’ responses regarding the preferred ways of learning separately, several independent t-tests were run. Tables 1 and 2 show the results of the descriptive statistics and the independent sample t-test of part A.
Table 1. Descriptive Statistics of Teachers’ and Learners’ Opinions about the Items of Part A
job N Mean Std. Deviation Std. Error Mean
Achievement satisfaction learner 176 3.6250 .84600 .06377
teacher 30 3.7333 .78492 .14331
learning individually learner 176 2.77 1.350 .102
teacher 30 2.93 1.285 .235
in pairs learner 176 3.3352 1.15442 .08702
teacher 30 3.7667 .93526 .17075
in small groups learner 176 3.5227 1.11075 .08373
teacher 30 3.6000 1.00344 .18320
in one large group learner 176 3.1761 1.33853 .10090
teacher 30 3.0333 1.15917 .21163
Table 2. Independent Samples Test to Compare Teachers’ and Learners’ Opinions aboutItems of Part A
Levene's Test for Equ ality of Vari ance
s t-test for Equality of Means
F Sig. t df
Sig. (2-t a i l
Mean Diff eren ce
Std. Error Diff eren ce
95% Confidence Interval of the Differen ce
Modern Journal of Language Teaching Methods ISSN: 2251-6204
Vol. 6, Issue 7, October 2016
Page 13
e d
) Lower Upper
Achievement satisfac tion
Equal var ian ces ass um ed
.560 .455 -.655 204 .513 -.10833 .16544 -.43453 .21786
learning individ ually
Equal var ian ces ass um ed
.570 .451 -.606 204 .545 -.161 .265 -.683 .362
in pairs Equal var ian ces ass um ed
3.682 .056 -1.940 204 .054 -.43144 .22239 -.86991 .00703
in small groups Equal var ian ces ass um ed
1.161 .283 -.357 204 .722 -.07727 .21651 -.50416 .34961
in one large group
Equal var ian ces ass um ed
1.469 .227 .550 204 .583 .14280 .25965 -.36913 .65474
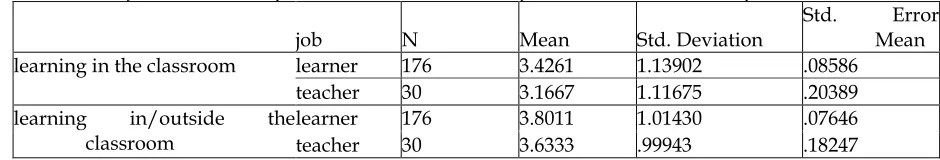
According to Table 2, the teachers’ perceptions and the learners’ preferences regarding the preferred ways of learning are not significantly different. Item B deals with the learners’ preferences for learning in or outside the classroom. Tables 3 and 4 show the results.
Table 3. Descriptive Statistics of Teachers’ and Learners’ Opinions about the Items of Part B
job N Mean Std. Deviation Std. Mean Error
learning in the classroom learner 176 3.4261 1.13902 .08586
teacher 30 3.1667 1.11675 .20389
learning in/outside the classroom
learner 176 3.8011 1.01430 .07646
teacher 30 3.6333 .99943 .18247
Modern Journal of Language Teaching Methods ISSN: 2251-6204
Vol. 6, Issue 7, October 2016
Page 14
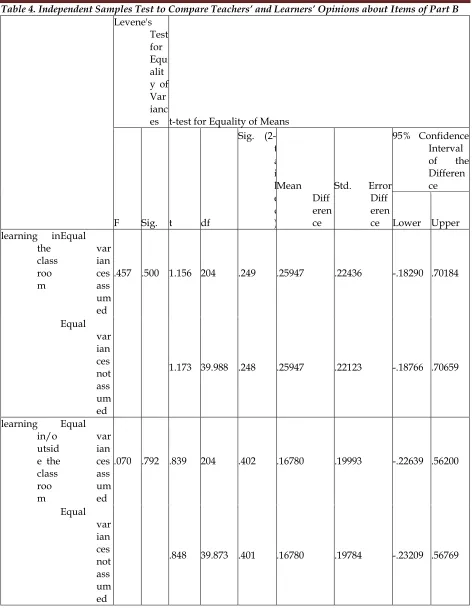
Table 4. Independent Samples Test to Compare Teachers’ and Learners’ Opinions aboutItems of Part B
Levene's Test for Equ alit y of Var ianc
es t-test for Equality of Means
F Sig. t df
Sig. (2-t a i l e d )
Mean Diff eren ce
Std. Error Diff eren ce
95% Confidence Interval of the Differen ce
Lower Upper learning in
the class roo m
Equal var ian ces ass um ed
.457 .500 1.156 204 .249 .25947 .22436 -.18290 .70184
Equal var ian ces not ass um ed
1.173 39.988 .248 .25947 .22123 -.18766 .70659
learning in/o utsid e the class roo m
Equal var ian ces ass um ed
.070 .792 .839 204 .402 .16780 .19993 -.22639 .56200
Equal var ian ces not ass um ed
.848 39.873 .401 .16780 .19784 -.23209 .56769
The results of the t-test presented in Table 4, do not reveal great differences among teachers’ and learners’ responses in either cases. However in this part, based on the mean scores in Table 4, learners’
Modern Journal of Language Teaching Methods ISSN: 2251-6204
Vol. 6, Issue 7, October 2016
Page 15
preferences for learning in/outside the classroom are a bit greater than teachers’ expectations with the learners’ means of 3.4 and 3.8 compared to those of the teachers as 3.1 and 3.6.
Item C of the questionnaire evaluates learners’ preferences for learning techniques as learning by a) listening b) reading c) copying from the board d) listening and taking notes e) reading and making notes f) repeating what you hear and g) making summaries. Tables 5 and 6 show the pertaining results.
Table 5. Descriptive Statistics of Teachers’ and Learners’ Opinions about the Items of Part C
job N Mean Std. Deviation
Std. Error Mea n
learning by listening learner 176 3.4943 1.20947 .09117
teacher 30 3.2000 1.06350 .19417
learning by reading learner 176 3.7500 1.03372 .07792
teacher 30 3.6333 1.15917 .21163
copying from the board learner 176 2.8011 1.17118 .08828
teacher 30 3.3000 1.02217 .18662
listening and taking notes learner 176 3.6136 1.18014 .08896
teacher 30 3.5333 1.13664 .20752
reading and making notes learner 176 3.4602 1.10511 .08330
teacher 30 3.6333 .96431 .17606
repeating learner 176 3.3750 1.24039 .09350
teacher 30 3.1667 1.20583 .22015
making summaries learner 176 3.3125 1.31326 .09899
teacher 30 3.2000 1.03057 .18815
Table 6. Independent Samples Test to Compare Teachers’ and Learners’ Opinions aboutItems of Part C
Levene's Test for Equ ality of Vari ance
s t-test for Equality of Means
F Sig. t df
Sig. (2-t a i l e d )
Mean Diffe renc e
Std. Error Diffe renc e
95% Confidence Interval of the Differenc e
Lower Upper learning by
listen ing
Equal vari anc es
1.863 .174 1.252 204 .212 .29432 .23502 -.16905 .75769
Modern Journal of Language Teaching Methods ISSN: 2251-6204
Vol. 6, Issue 7, October 2016
Page 16
ass um ed Equal
vari anc es not ass um ed
1.372 42.851 .177 .29432 .21451 -.13832 .72695
learning by readi ng
Equal vari anc es ass um ed
1.468 .227 .561 204 .575 .11667 .20789 -.29321 .52655
Equal vari anc es not ass um ed
.517 37.282 .608 .11667 .22552 -.34017 .57350
copying from the board
Equal vari anc es ass um ed
.257 .613 -2.194 204 .029 -.49886 .22738 -.94718 -.05054
Equal vari anc es not ass um ed
-2.416 43.074 .020 -.49886 .20645 -.91519 -.08254
listening and takin g notes
Equal vari anc es ass um ed
.451 .503 .346 204 .729 .08030 .23190 -.37693 .53754
Equal vari anc
.356 40.411 .724 .08030 .22578 -.37588 .53648
Modern Journal of Language Teaching Methods ISSN: 2251-6204
Vol. 6, Issue 7, October 2016
Page 17
es not ass um ed reading and
maki ng notes
Equal vari anc es ass um ed
.871 .352 -.807 204 .421 -.17311 .21455 -.59613 .24991
Equal vari anc es not ass um ed
-.889 43.080 .379 -.17311 .19477 -.56588 .21966
repeating Equal vari anc es ass um ed
.899 .344 .854 204 .394 .20833 .24405 -.27284 .68951
Equal vari anc es not ass um ed
.871 40.188 .389 .20833 .23918 -.27501 .69167
making sum marie s
Equal vari anc es ass um ed
5.611 .019 .446 204 .656 .11250 .25221 -.38478 .60978
Equal vari anc es not ass um ed
.529 46.683 .599 .11250 .21261 -.31529 .54029
Modern Journal of Language Teaching Methods ISSN: 2251-6204
Vol. 6, Issue 7, October 2016
Page 18
Table 6 indicates that the only difference observed among teachers’ and learners’ responses was in copying from the board (sig. =.02, p<.05). According to Table 6, it seems that learners (mean =2.8) are less willing to learn through copying from the board than what the teachers (mean =3.3) expect.
Part D deals with different vocabulary learning strategies. The findings of the descriptive statistics and independent sample t-test are presented in Tables 7 and 8 below.
Table 7. Descriptive Statistics of Teachers’ and Learners’ Opinions about the Items of Part D
job N Mean Std. Deviation Std. Error Mean Vocabulary learning using
words in sentence. learner teacher 176 30 3.9205 3.6667 .99394 1.12444 .07492 .20529 relationship between known
and new
learner 176 3.8636 1.00492 .07575
teacher 30 3.5333 1.04166 .19018
Saying & writing words several
times learner teacher 176 30 3.2443 3.4000 1.22939 1.19193 .09267 .21762 avoiding verbatim translation learner 176 3.0000 1.18563 .08937
teacher 30 2.5000 .93772 .17120
guessing unknown learner 176 3.1136 1.29113 .09732
teacher 30 2.8667 .86037 .15708
reading without looking up words
learner 176 2.8466 1.22091 .09203
teacher 30 2.9000 1.09387 .19971
Table 8. Independent Samples Test to Compare Teachers’ and Learners’ Opinions aboutItems of Part C
Levene's Test for Equa lity of Varia
nces t-test for Equality of Means
F Sig. t df
Sig. (2-t a i l e d ) Mean
Diff eren ce
Std. Error Diff eren ce
95% Confidence Interval of the Differen ce
Lower Upper Vocabulary
learni ng using word s in sente nce.
Equal var ian ces ass um ed
.903 .343 1.268 204 .206 .25379 .20019 -.14092 .64850
Equal 1.161 37.130 .253 .25379 .21854 -.18896 .69654
Modern Journal of Language Teaching Methods ISSN: 2251-6204
Vol. 6, Issue 7, October 2016
Page 19
var ian ces not ass um ed relationship
betwe en know n and new
Equal var ian ces ass um ed
.052 .821 1.655 204 .099 .33030 .19954 -.06313 .72373
Equal var ian ces not ass um ed
1.614 38.769 .115 .33030 .20471 -.08384 .74445
Saying & writin g word s sever al times
Equal var ian ces ass um ed
.024 .878 -.644 204 .520 -.15568 .24179 -.63242 .32105
Equal var ian ces not ass um ed
-.658 40.252 .514 -.15568 .23652 -.63362 .32226
avoiding verba tim transl ation
Equal var ian ces ass um ed
.978 .324 2.194 204 .029 .50000 .22787 .05072 .94928
Equal var ian ces not ass um
2.589 46.387 .013 .50000 .19313 .11135 .88865
Modern Journal of Language Teaching Methods ISSN: 2251-6204
Vol. 6, Issue 7, October 2016
Page 20
ed guessing
unkn own
Equal var ian ces ass um ed
10.283 .002 1.009 204 .314 .24697 .24474 -.23558 .72952
Equal var ian ces not ass um ed
1.337 54.214 .187 .24697 .18479 -.12347 .61741
reading witho ut looki ng up word s
Equal var ian ces ass um ed
1.162 .282 -.225 204 .822 -.05341 .23775 -.52217 .41536
Equal var ian ces not ass um ed
-.243 42.308 .809 -.05341 .21990 -.49708 .39026
According to Table 8, there is a significant difference among teachers’ and learners’ responses in avoiding verbatim translation (sig. =.02, p<.05). Table 7 indicating higher mean score of the learners’ responses to this item (mean=3) revealed their greater preferences for such strategy than teachers’ expectations (mean =2.5). It seems that teachers do not think their students are willing to avoid verbatim translation; that may result from learners’ great tendency towards finding an equivalent for every single target language word in their mother tongue which can easily be observed among EFL learners especially in Iran with non- native English teachers who share learners’ native language.
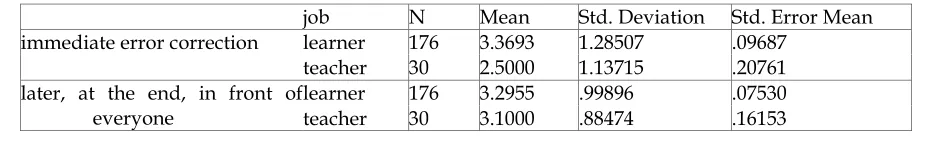
Part E deals with error correction techniques. The researcher ran the independent sample t-test to compare the teachers’ expectations and learners’ preferences. The results are tabulated in Tables 9 and 10 below.
Table 9. Descriptive Statistics of Teachers’ and Learners’ Opinions about the Items of Part E
job N Mean Std. Deviation Std. Error Mean immediate error correction learner 176 3.3693 1.28507 .09687
teacher 30 2.5000 1.13715 .20761
later, at the end, in front of everyone
learner 176 3.2955 .99896 .07530
teacher 30 3.1000 .88474 .16153
Modern Journal of Language Teaching Methods ISSN: 2251-6204
Vol. 6, Issue 7, October 2016
Page 21
later, in private learner 176 3.0170 1.39581 .10521
teacher 30 3.4667 1.27937 .23358
peer correction learner 176 2.9432 1.32111 .09958
teacher 30 3.1000 .95953 .17518
self-correction learner 176 3.7386 1.10577 .08335
teacher 30 2.8000 1.24291 .22692
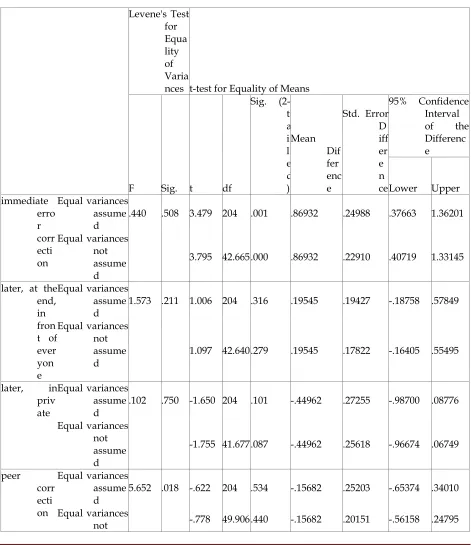
Table 10. Independent Samples Test to Compare Teachers’ and Learners’ Opinions aboutItems of Part E
Levene's Test for Equa lity of Varia
nces t-test for Equality of Means
F Sig. t df
Sig. (2-t a i l e d ) Mean Dif fer enc e
Std. Error D iff er e n ce
95% Confidence Interval of the Differenc e
Lower Upper immediate erro r corr ecti on Equal variances assume d
.440 .508 3.479 204 .001 .86932 .24988 .37663 1.36201
Equal variances not assume d
3.795 42.665 .000 .86932 .22910 .40719 1.33145
later, at the end, in fron t of ever yon e Equal variances assume d
1.573 .211 1.006 204 .316 .19545 .19427 -.18758 .57849
Equal variances not assume d
1.097 42.640 .279 .19545 .17822 -.16405 .55495
later, in priv ate
Equal variances assume
d .102 .750 -1.650 204 .101 -.44962 .27255 -.98700 .08776 Equal variances
not assume d
-1.755 41.677 .087 -.44962 .25618 -.96674 .06749
peer corr ecti on Equal variances assume d
5.652 .018 -.622 204 .534 -.15682 .25203 -.65374 .34010
Equal variances
not -.778 49.906 .440 -.15682 .20151 -.56158 .24795
Modern Journal of Language Teaching Methods ISSN: 2251-6204
Vol. 6, Issue 7, October 2016
Page 22
assume d
self-corr ecti on
Equal variances assume d
.580 .447 4.219 204 .000 .93864 .22247 .50001 1.37726
Equal variances not assume d
3.883 37.241 .000 .93864 .24175 .44892 1.42836
Considering error correction techniques in part E of the questionnaire, Table 10 reveals that there is a significant difference between teachers’ perceptions and learners’ preferences in the following items: immediate error correction (sig. =.00, p<.05) and self-correction (sig. =.00, p<.05). According to the results presented in Table 9, learners’ preference for immediate error correction (mean = 3.3) compared to that of the teachers (mean=2.5), exceeded teachers’ perceptions. Table 10 also shows that there is a significant difference between teachers’ perceptions and learners’
preferences regarding self-correction (sig. =.00, p<.05). The greater desire for self-correction was expressed through learners’ responses (mean = 3.7) compared to that of the teachers (mean= 2.8). In part F, preferred media of learning as: a) TV/Video/Films b) radio c) CDs/DVDs d) written material e) the whiteboard and f) pictures/posters are evaluated. Tables 11 and 12 illustrate the results of the descriptive statistics and the independent sample t-test.
Table 11. Descriptive Statistics of Teachers’ and Learners’ Opinions about the Items of Part F
job N Mean Std. Deviation Std. Error Mean
learning from TV/video/film learner 176 4.3125 .93140 .07021
teacher 30 4.2000 .92476 .16884
radio learner 176 2.7841 1.24165 .09359
teacher 30 2.3000 1.11880 .20426
CD/DVD learner 176 3.8920 1.13376 .08546
teacher 30 3.9333 1.04826 .19139
written material learner 176 3.5057 1.11610 .08413
teacher 30 4.0000 .83045 .15162
whiteboard learner 176 3.3523 1.17147 .08830
teacher 30 3.7333 1.11211 .20304
picture/poster learner 176 3.6193 1.26377 .09526
teacher 30 3.7333 1.08066 .19730
Table 12. Independent Samples Test to Compare Teachers’ and Learners’ Opinions aboutItems of Part F
Levene's Test for Equa lity of Vari ance
s t-test for Equality of Means
F Sig. t df Sig. (2-Mean Std. Error 95% Confidence
Modern Journal of Language Teaching Methods ISSN: 2251-6204
Vol. 6, Issue 7, October 2016
Page 23
t a i l e d )
Diff ere nce
Diff ere nce
Interval of the Differe nce
Lower Upper learning from
TV/vide o/film
Equal va ria nc es as su m ed
.033 .856 .612 204 .541 .11250 .18379 -.24986 .47486
Equal va ria nc es no t as su m ed
.615 39.699 .542 .11250 .18285 -.25714 .48214
radio Equal
va ria nc es as su m ed
.106 .745 2.001 204 .047 .48409 .24195 .00704 .96114
Equal va ria nc es no t as su m ed
2.155 42.147 .037 .48409 .22469 .03070 .93748
CD/DVD Equal
va ria nc
.983 .323 -.186 204 .852 -.04129 .22162 -.47825 .39567
Modern Journal of Language Teaching Methods ISSN: 2251-6204
Vol. 6, Issue 7, October 2016
Page 24
es as su m ed Equal
va ria nc es no t as su m ed
-.197 41.445 .845 -.04129 .20960 -.46444 .38187
written material Equal va ria nc es as su m ed
11.137 .001 -2.317 204 .021 -.49432 .21335 -.91496 -.07367
Equal va ria nc es no t as su m ed
-2.851 48.839 .006 -.49432 .17340 -.84280 -.14584
whiteboard Equal va ria nc es as su m ed
.299 .585 -1.659 204 .099 -.38106 .22976 -.83407 .07195
Equal va ria nc es no
-1.721 40.766 .093 -.38106 .22141 -.82829 .06617
Modern Journal of Language Teaching Methods ISSN: 2251-6204
Vol. 6, Issue 7, October 2016
Page 25
t as su m ed picture/poster Equal
va ria nc es as su m ed
2.489 .116 -.466 204 .642 -.11402 .24481 -.59669 .36866
Equal va ria nc es no t as su m ed
-.520 43.703 .605 -.11402 .21909 -.55565 .32762
In part F of this questionnaire; among these cases only radio (sig. =.04, p<.05) and written material (sig. =.00, p<.05) revealed significant differences. According to Table 12, teachers’ perception of more popularity of written material among learners (mean=4) was higher than learners’ actual willingness to this medium of learning (mean =3.5). Table 11 shows that although radio was more popular than what teachers expected ( the mean of 2.7 for learners’ responses compared to that of the teachers as 2.3 ) , it was considered as the least popular medium of learning by learners compared to other media of learning in this item .
In part G of the questionnaire, learners were supposed to rate some class activities based on the performing frequency in their classrooms as: 1) role play 2) language games 3) songs 4) talking with and listening to other students 5) memorizing dialogues 6) getting information from guest speakers 7) getting information from planned visits 8) writing diary 9) learning about culture. Teachers also determined the frequency of applying these learning techniques in their classroom. The results are tabulated in Tables 13 and 14 as follows.
Table 13. Descriptive Statistics of Teachers’ and Learners’ Opinions about the Items of Part G
job N Mean Std. Deviation Std. Error Mean
role play learner 176 3.1818 1.36525 .10291
teacher 30 4.0667 1.14269 .20863
games learner 176 2.8409 1.42938 .10774
teacher 30 3.4333 1.33089 .24299
songs learner 176 2.8523 1.56782 .11818
teacher 30 2.9667 1.42595 .26034
talking with & listening to others
learner 176 3.8295 1.05529 .07955
teacher 30 4.1333 1.07425 .19613
Modern Journal of Language Teaching Methods ISSN: 2251-6204
Vol. 6, Issue 7, October 2016
Page 26
memorizing dialogs learner 176 3.4830 1.36056 .10256
teacher 30 3.6667 1.37297 .25067
getting info from guest speakers
learner 176 3.1023 1.37354 .10353
teacher 30 2.7667 1.52414 .27827
getting info from planned visits learner 176 2.9886 1.36900 .10319
teacher 30 2.6667 1.34762 .24604
writing a learning diary learner 176 2.7727 1.31129 .09884
teacher 30 2.9000 1.32222 .24140
learning about culture learner 176 3.5682 1.16418 .08775
teacher 30 3.7000 1.17884 .21523
Table 14. Independent Samples Test to Compare Teachers’ and Learners’ Opinions aboutItems of Part G
Levene's Test for Equa lity of Varia
nces t-test for Equality of Means
F Sig. t df
Sig. (2-t a i l e d ) Mean
D iff er e nc e
Std. Error Dif fer enc e
95% Confidence Interval of the Differen ce
Lower Upper role play Equal
varian ces assum ed
3.739 .055 -3.353 204 .001 -.88485 .26386 -1.40510 -.36460
Equal
varian ces not assum ed
-3.804 44.394 .000 -.88485 .23263 -1.35356 -.41614
games Equal
varian ces assum ed
.590 .443 -2.118 204 .035 -.59242 .27965 -1.14380 -.04105
Equal
varian ces not assum ed
-2.229 41.260 .031 -.59242 .26580 -1.12912 -.05573
songs Equal 4.605 .033 -.374 204 .709 -.11439 .30585 -.71743 .48864
Modern Journal of Language Teaching Methods ISSN: 2251-6204
Vol. 6, Issue 7, October 2016
Page 27
varian ces assum ed Equal
varian ces not assum ed
-.400 41.888 .691 -.11439 .28591 -.69143 .46264
talking with & listen ing to other s
Equal
varian ces assum ed
.015 .902 -1.454 204 .148 -.30379 .20898 -.71583 .10825
Equal
varian ces not assum ed
-1.435 39.149 .159 -.30379 .21165 -.73183 .12426
memorizing dialo gs
Equal
varian ces assum ed
.282 .596 -.683 204 .496 -.18371 .26909 -.71427 .34685
Equal
varian ces not assum ed
-.678 39.338 .502 -.18371 .27084 -.73138 .36396
getting info from guest spea kers
Equal
varian ces assum ed
1.390 .240 1.217 204 .225 .33561 .27573 -.20804 .87925
Equal
varian ces not assum ed
1.130 37.466 .266 .33561 .29690 -.26573 .93694
getting info from plan ned visits
Equal
varian ces assum ed
.001 .974 1.193 204 .234 .32197 .26981 -.21001 .85395
Equal
varian ces
1.207 39.895 .235 .32197 .26681 -.21731 .86125
Modern Journal of Language Teaching Methods ISSN: 2251-6204
Vol. 6, Issue 7, October 2016
Page 28
not assum ed writing a
learn ing diary
Equal
varian ces assum ed
.003 .954 -.491 204 .624 -.12727 .25932 -.63856 .38401
Equal
varian ces not assum ed
-.488 39.355 .628 -.12727 .26086 -.65475 .40021
learning abou t cultu re
Equal
varian ces assum ed
.038 .846 -.572 204 .568 -.13182 .23037 -.58602 .32239
Equal
varian ces not assum ed
-.567 39.264 .574 -.13182 .23243 -.60185 .33821
According to Table 14, Learners’ responses are in agreement with those of the teachers in almost all cases except applying role plays (sig. =.00, p<.05) and language games in classes (sig. =.03, p<.05). Concerning the results of thedescriptive statistics, language games are the least common activity in classrooms in learners’ opinions (mean =2.8). However, teachers believe in applying language games more than what the students imagine (mean= 3.4). Role play was also the area of discrepancies among the teachers and the students (sig. =.00, p<.05). Teachers believe in higher frequency of role play and interaction among the students in their classes (mean =4.01) compared to the students’ opinions in this regard (mean =3.1).
The results of the descriptive statistics and the independent sample t-test for the items of part H which ask about the way learners prefer to learn about their progress in language learning are depicted in Tables 15 and 16.
Table 15. Descriptive Statistics of Teachers’ and Learners’ Opinions about the Items of Part H
job N Mean Std. Deviation Std. Error Mean
find improving by teachers tasks
learner 176 3.3466 1.04706 .07892
teacher 30 3.6000 .81368 .14856
real-life language use learner 176 4.1534 .89716 .06763
teacher 30 4.1667 .87428 .15962
Table 16. Independent Samples Test to Compare Teachers’ and Learners’ Opinions aboutItems of Part H
Levene's Test
for t-test for Equality of Means
Modern Journal of Language Teaching Methods ISSN: 2251-6204
Vol. 6, Issue 7, October 2016
Page 29
Equ ality of Vari ance s
F Sig. t df
Sig. (2-t a i l e d )
Mean Diff eren ce
Std. Error Diff eren ce
95% Confidence Interval of the Differen ce
Lower Upper find
impr ovin g by teac hers tasks
Equal var ian ces ass um ed
1.952 .164 -1.261 204 .209 -.25341 .20091 -.64954 .14272
Equal var ian ces not ass um ed
-1.506 47.060 .139 -.25341 .16822 -.59181 .08500
real-life lang uage use
Equal var ian ces ass um ed
.163 .687 -.075 204 .940 -.01326 .17657 -.36140 .33489
Equal var ian ces not ass um ed
-.076 40.131 .939 -.01326 .17336 -.36359 .33707
According to Table 14, teachers’ and learners’ opinions toward the items of part H of the questionnaire are highly close together and few differences are considered as dispensable.
Part I deals with the way through which they get a sense of satisfaction from learning. The results are presented in Tables 17 and 18.
Table 17. Descriptive Statistics of Teachers’ and Learners’ Opinions about the Items of Part I
Modern Journal of Language Teaching Methods ISSN: 2251-6204
Vol. 6, Issue 7, October 2016
Page 30
job N Mean Std. Deviation Std. Error Mean satisfaction from graded works learner 176 3.5284 1.03056 .07768
teacher 30 4.0333 .88992 .16248
being told you made progress learner 176 3.7159 .93746 .07066
teacher 30 3.8333 1.13664 .20752
feeling confident in previous
hard situations learner teacher 176 30 3.9830 3.9667 .93488 1.03335 .07047 .18866
Table 18. Independent Samples Test to Compare Teachers’ and Learners’ Opinions aboutItems of Part I
Levene's Test for Equa lity of Varia
nces t-test for Equality of Means
F Sig. t df
Sig. (2-t a i l e d ) Mean Diff ere nce
Std. Error Dif fer enc e 95% Confid ence Interva l of the Differe nce Lower Upper satisfaction fro m gra de d wo rks Equal varian ces assum ed
6.609 .011 -2.527 204 .012 -.50492 .19984 -.89895 -.11090
Equal varian ces not assum ed
-2.804 43.398 .008 -.50492 .18009 -.86802 -.14183
being told yo u ma de pr ogr ess Equal varian ces assum ed
1.689 .195 -1.183 204 .130 -.11742 .19126 -.79452 -.04033
Equal varian ces not assum ed
-1.904 36.035 .165 -.11742 .21922 -.86201 .02716
feeling co nfi
Equal
varian
ces .034 .855 .087 204 .931 .01629 .18755 -.35349 .38607
Modern Journal of Language Teaching Methods ISSN: 2251-6204
Vol. 6, Issue 7, October 2016
Page 31
de nt in pre vio us har d sit uat ion s
assum ed Equal
varian ces not assum
ed .081 37.535 .936 .01629 .20139 -.39158 .42416
Although in part I regarding the way through which they get a sense of satisfaction from learning in case of getting a sense of satisfaction of having their work graded, the learners’ responses are significantly different from those of the teachers (sig.=.00, p<.05). Learners are not that satisfied with their works being graded (mean =3.5) as the teachers believe (mean=4.03).
6. Conclusion
The main objective of the present study was to find out the extent to which teachers are aware of learners’ preferences. Considering the result of the t-test between teachers’ and learners’ responses, in most cases teachers’ perceptions of their learners’ preferences were greatly close to their actual preferences. The only cases revealing statistically significant discrepancies are as follows:
1. Teachers’ expectations regarding learners’ preferences for copying from the board as a learning technique fell short of learners’ actual preferences.
2. Concerning the vocabulary learning techniques, learners’ tendency towards avoiding verbatim translation was greater than teachers’ expectations.
3. In terms of error correction techniques, unlike teachers’ perceptions, learners have a greater tendency toward being corrected immediately and in front of everyone rather than later and in private correction that seemed more preferable by learners than teachers; moreover, learners had a greater desire for self-correction than their teachers’ expectations.
4. Considering preferred media of learning, learners were less willing to learn through written material than what the teachers expected and more interested in learning through radio than what teachers supposed, even though, radio was the least popular medium of learning among learners. 5. Rating the class activities performed by the teachers in classes, learners believed games and role plays
were not as frequently applied by the teachers as the teachers believed.
6. Learners are not that grade-minded as their teachers suppose, that is they are not that interested in having their work corrected in order to get a sense of satisfaction in learning neither they get such a sense by being told about their progress.
Taking such results into account, learners and teachers could be informed about various learning, error correction and assessment techniques. Neither the teachers nor the students should be restricted to certain teaching and learning techniques; furthermore, lesson planners and curriculum developers could include such preferences and techniques in their lesson plans and teachers could make use of such techniques based on their popularities among learners to increase the efficiency of their teaching and enhance learners’ interest and success in learning a foreign language.
REFERENCES
Brindley, G. (1984). Needs analysis and objective setting in the adult migrant education program. Sydney: NSW Adult Migrant Education Service.
Brown, H. D. (2000). Principles of language teaching and learning (4th ed.). New York: Longman.
Celce-Murcia, M. (2001). Teaching English as a second or foreign language (3rd ed.). Dewey Publishing Services: NY.
Modern Journal of Language Teaching Methods ISSN: 2251-6204
Vol. 6, Issue 7, October 2016
Page 32
Felder, R. (1993). Reaching the second tier: Learning and teaching styles in college science education.
College Science Teaching, 23(5), 286-290.
Felder, R., & Silverman, L. (1988). Learning styles and teaching styles in engineering education. Education, 78(7), 674–681.
Keefe, J. W. (1989). Learning style profile handbook: Accommodating perceptual, study and instructional preferences.Reston, VA: NASSP.
Kolb, D. (1984). Experiential learning: Experience as the source of learning and development. Englewood Cliffs, New Jersey: Prentice Hall.
Kolb, D. A. (1981). Learning styles and disciplinary differences. Needham Heights, MA: Ginn Press.
Mc.Caulley, M. H., Godleski, E.S., Yokomoto, C.F., Harrisberger, L., & Sloan, E.D. (1983). Applications of psychological type in engineering educator. Engineering Education, 39, 4-400.
Montgomery, M. S., & Groat, N. L. (1998). Students’ learning styles and their implication for teaching.
CRLT Occasional Paper, 10, 1-8.
Reid, J. (1995). Learning styles in the ESL/EFL classroom. Boston, MA: Heinle and Heinle Publishers. Reid, J. M. (1987). The learning style preferences of ESL students. TESOL Quarterly, 21, 87-111. Reid, J.M. (1998). Understanding learning styles in the second language classroom. Prentice Hall Regents. Schroeder, C. C. (1993). New Students – new learning styles. Change, 25(5), 21-26.
Stapa, S. H. (2003). ESP students’ learning preferences: Are the teachers aware? Retrieved December 12, 2015 from http://www.Esp-world.Info/rticles/stapa.htm.
Wintergerst, A. C., DeCapua, A., & Marilyn, A. V. (2003). Conceptualizing learning style modalities for ESL/EFL students. System, 31, 85-106.
Modern Journal of Language Teaching Methods ISSN: 2251-6204
Vol. 6, Issue 7, October 2016
Page 33
THE EFFECT OF FLASH CARD-BASED INSTRUCTION ON
VOCABULARY LEARNING BY EFL LEARNERS
Gholam-Reza Abbasian
Imam Ali & Islamic Azad (South Tehran Branch) universities [email protected]
Elham Ghorbanpour
PhD Candidate, Islamic Azad University, Kish International Branch, Iran Corresponding author
ABSTRACT
THE PRESENT STUDY SOUGHT TO INVESTIGATE THE EFFECT OF FLASH CARD-BASED INSTRUCTION ON VOCABULARY LEARNING AMONG INTERMEDIATE EFL LEARNERS WITH A CONSIDERATION OF THE ROLE GENDER. THE STUDY WAS A QUANTITATIVE ONE. THE PARTICIPANTS WERE 60 IRANIAN MALE AND FEMALE EFL LEARNERS GROUP WHO WERE SCREENED BY THE OXFORD PLACEMENT TEST (2011) AS HOMOGENEOUS GROUP IN TERMS OF PROFICIENCY LEVEL. HAVING RECEIVED A 10-HOUR TREATMENT USING FLASH CARD-BASED AND CONVENTIONAL INSTRUCTION OF VOCABULARY RESPECTIVELY, BOTH GROUPS RECEIVED A POST TEST OF READING COMPREHENSION TO ASSESS THEIR READING COMPREHENSION KNOWLEDGE. T-TEST-BASED ANALYSIS OF THE DATA SUGGESTED SIGNIFICANT DIFFERENCE BETWEEN THE TWO METHODS OF TEACHING IN FAVOUR OF THE FLASHCARD-BASED INSTRUCTION OF VOCABULARY. HOWEVER, THE DIFFERENCE BETWEEN MALE AND FEMALE PARTICIPANTS IN VOCABULARY LEARNING WAS NOT FOUND TO BE SIGNIFICANT. THE MAJOR IMPLICATION OF THE STUDY IS THAT FLASHCARD-BASED INSTRUCTION AS AN IMPORTANT METHOD OF VOCABULARY LEARNING SHOULD RECEIVE FURTHER ATTENTION IN LANGUAGE TEACHING PROGRAMS.
KEYWORDS: FLASHCARD-BASED INSTRUCTION; VOCABULARY LEARNING; INTERMEDIATE LEVEL.
Introduction
Successful second language learning has been a great concern of applied linguists. It is believed that words are the heart of any language which makes the process of learning easier. Aitchison (1989) found words as a tool of thought, and one will often find that he is thinking inappropriately because he is using the wrong tool. According to Rivers (1983), the acquisition of an adequate vocabulary is essential for successful second language use because, without an extensive vocabulary, one will be unable to use the structures, and functions we may have learned for comprehensible communication. Laufer (1997) has the same opinion about vocabularies and believes that no comprehension accrues, unless there is an understanding of text’s words. Therefore vocabularies as the indispensible components of language have always received a great attention.
Vocabulary learning and teaching has been considered as one of the most important mechanisms of any educational program since early on. Thornbury (2004) stated that much of development of new approaches to language teaching is ‘word-centered’. It also should be noted that teaching
Modern Journal of Language Teaching Methods ISSN: 2251-6204
Vol. 6, Issue 7, October 2016
Page 34
vocabulary is supposed to not only consists of teaching specific words but also aims at providing learners with strategies necessary to speed up their vocabulary knowledge (Hulstjin, 1993, cited in Morin & Goebel, 2001). Teachers have been using many techniques to help the learners to develop their knowledge of vocabularies in quality and quantity. Words can be learnt verbally and visually; since verbally refers to the old-fashion way of learning vocabulary like reading and memorizing, most attention has been drawn on visual techniques like pictures, flashcard-based instruction , photographs, word pictures, and wordlists.
Reviewing recent teaching methodologies, could confirm that except Reading Method which emphasizes on reading and vocabulary control. Other teaching methodology did not address vocabulary in any principled way. According to Brown (2001) Grammar-Translation focused on grammar teaching and translation as language practice, the Direct Method dealt with oral skills, the Audio-Lingual tried to build good language habits through drills, and Communicative Language Teaching emphasized on fluency over accuracy.
During the first part of the twentieth century, several scholars were working on ways to lighten students' vocabulary learning load. Particularly as applied to reading, they developed principles of presenting common vocabulary first, and limiting the number of new words in any text. Later on, many books and word lists have been presented to help the learners to organize their vocabulary knowledge. Since then, many studies have been conducted to present some strategies for vocabulary leaning, and flashcard-based instruction as one of the popular strategies was in most of these studies.
According to Walters and Bozkurt (2009), vocabulary notebooks are frequently advocated as a way for students to take control of their vocabulary learning. The study attempted to lend empirical support to these claims, by investigating the effect of vocabulary notebooks on EFL students’ vocabulary acquisition. These findings lead the authors to conclude that vocabulary notebooks can be an effective learning tool in EFL classrooms, but positive impacts on learner autonomy may not be seen in the absence of appropriate motivation for language learning. Başoğlu and Akdemir (2010) conducted a study on the comparison of undergraduate students’ English vocabulary learning using mobile phones and flash card-based instruction. Results indicated that using mobile phones as a vocabulary learning tool is more effective than one of the traditional vocabulary learning tools. Erbey, Mclaughlin, Derby and Everson (2011) studied the effects of using flashcard-based instruction with reading racetrack to teach letter sounds, sight words, and math facts to elementary students with learning disabilities. The purpose of this study was to measure the effects of reading racetrack and flashcard-based instruction when teaching phonics, sight words, and addition facts. The results show that some students had more success with it than others. Baleghizadehand Ashoori (2011) presented a study to observe students’ responses to teaching vocabulary using flash card-based instruction and word lists. But they have got a different result; they found no significant difference in the efficacy of either of the two techniques. Komachali and Khodareza (2012) also conducted a study to investigate the effect of using vocabulary flash card on Iranian pre-university students' vocabulary knowledge. The results showed the students in the experimental group outperformed the students in the control group in their vocabulary knowledge. Hence, it was concluded that the contribution of vocabulary flash card in teaching vocabulary to students led to a higher level of vocabulary improvement. Khodashenas, Farahani and Alishahi (2014) attempted to investigate the effect of using flash card-based instruction in comparison to educational cartoons on vocabulary learning of the intermediate English as a Foreign Language learners. After administrating a vocabulary pretest all 44 participants of the study were randomly selected to form the experimental and comparison groups of the study. In the experimental group the participants were taught through the using of Magic English cartoons, while the participants of the comparison group were taught through the use of flash card-based instruction. After the instruction a post test was administered to both groups. The result of the study indicated that there was a statistically significant
Modern Journal of Language Teaching Methods ISSN: 2251-6204
Vol. 6, Issue 7, October 2016
Page 35
difference between the groups. Therefore, it was concluded that the use of Magic English series could improve the students’ vocabulary knowledge.
A flashcard is a set of card-based instruction bearing information, as words or numbers, on either or both sides, used in classroom drills or in private study. One writes a question on a card and an answer overleaf. Flashcard-based instruction can bear vocabulary, historical dates, formulas or any subject matter that can be learned via a question-and-answer format. Flashcard-based instruction is widely used as a learning drill to aid memorization by way of spaced repetition. According to Brown (2000), one main advantage of flash card-based instruction is that, they can be taken almost anywhere and studied whenever one wants.
Students often find vocabulary as the main obstacle in acquiring a second language. They also believe that poor vocabulary knowledge blocks their reading and listening comprehension which cause problems in communication. Most foreign language teachers can confirm that most learners have no special way for learning vocabulary, they usually write the new words in a notebook and the definition next to it. They do not know how they can learn words in an easy way. The present study is an attempt in the direction of tackling the problems of vocabulary learning and offering a technique (using flash card-based instruction) in learning vocabulary. As it was discussed earlier, lack of needed vocabulary is found to be the main cause of learner’s
inability in communication activities. According to Celce-Murcia (1991), one effective way to help learners in communication is to increase their vocabulary knowledge. Also, Chastain (1988) stated that, vocabulary usually plays a greater role in communication than the other components of language. And many other scholars like Laufer (1997), believe that lexical problem, hinder successful comprehension. Hence, because of this important attribution in the process of vocabulary learning and enhancement, the present paper aims at investigating the effect of flash card-based instruction on vocabulary learning in English as a foreign language context.
In order to address this objective, two research questions followed in the form of their respective null hypotheses were posed as follows:
1. Does flash card-based instruction have any significant effect on learning vocabulary on Iranian
intermediate learners?
2. Is there any significant difference between male and female EFL learners regarding the effect of
flashcard-based instruction on vocabulary learning?
Method
The participants were 60 Iranian male and female EFL learners group who were screened by the Oxford Placement Test (2011) as homogeneous group in terms of proficiency level. Having received a 10-hour treatment using flash card-based and conventional instruction of vocabulary respectively, both groups received a post test of reading comprehension to assess their reading comprehension knowledge. 504 Absolutely Essential Words book and flashcard (Bromberg, Liebb and Traiger, 2005) were used to teach the participants some new vocabularies.
Those words were first presented to learners in three sample sentences; next, the new words appeared in a brief passage; the last part of each lesson was a set of exercises that gave learners practice using the new words. One of the most important features of the book was that each of the new words was repeated over and over again throughout the book so that learners would have a greater chance to become familiar with it. The book had also a comprehensive flashcard-based instruction which contained all vocabularies in the same order, but there was no exercise. And a researcher-made test on first 6 units of 504 absolutely essential words was to find out the effect of
teaching. In order to have an accurate result on vocabulary, a careful selection of different tests existed in the book was made. The test consisted of 50 questions that should have been answered in 35 minutes. All items in the test were either multiple choice questions or filling the blanks items, and there were no essay type question.
In order to check the reliability of the instruments, a pilot study was carried out with 16 EFL learners similar to the participants of the study to ensure the reliability of the tests through KR 20
Modern Journal of Language Teaching Methods ISSN: 2251-6204
Vol. 6, Issue 7, October 2016
Page 36
technique. The resulting value was found to be .83 which is indicative of high reliability of the instrument.
After selecting the final participants they were randomly placed in two different classes. The participants were taught the first six unit of the book in two different ways. In Class A which was the controlled group the book were used and in Class B which was the treatment class the flashcard-based instruction of the same book were utilized. In both classes six units were taught in six sessions (one in each session). At the end the research-made test of the book were taken. In order to eliminate any possible difference in two classes, the two classes took the test together.
Data Analysis and Results
Investigation of the first Research Question
In order to address the first question, before any special analysis, mean, mode and standard deviations of two sets of scores were calculated for further actions. This descriptive data is outlined in tables 1 and 2.
Table 1
Descriptive statistics of the scores
Class Mean Mode Standard Deviation Class A 34.73 50 6.74
Class B 44.4 50 4.83
Table 2
Group Statistics
Groups N Mean Std. Deviation Std. Error Mean Vocabulary
Test Class B Class A 30 30 44.4000 34.7333 4.83949 6.76672 .88357 1.23543
As Figure 1 presents, participants in Class B had a better performance than participants in class A.
Figure 1. Distribution of participants' vocabulary test scores in both Classes
50 47 49
37 45
50 38 39
48 49 46
35 50 47 39 49 42 43 50 44 41 40 48 44 37 50 47 38 49 41 31 30 50 30 29 42
29 32 30 47 30 39 33 38 31 50 31 27 37 32 40 28 35 31 30 49 34 29
35 33
0 10 20 30 40 50 60
1 2 3 4 5 6 7 8 9 10 11 12 13 14 15 16 17 18 19 20 21 22 23 24 25 26 27 28 29 30
Participants' vocabulary test scores in both Classes
Class B Class A
Modern Journal of Language Teaching Methods ISSN: 2251-6204
Vol. 6, Issue 7, October 2016
Page 37
Inferential Statistics: Independent T-Test
In order to see the differences between the two classes of the study, the mean scores of the participants were calculated and an independent samples t-test was administered. (Table 3)
Table 3
Independent Samples Test
t-test for Equality of Means
t df
Sig. (2-tail ed)
Mean Di ffe re nc e
Std. Error Di ffe re nc e
95% Confidence Interval of the Difference
Lower Upper
Vocabulary Test
Equal variances
assumed 6.364 58 .000 9.66667 1.51887 6.62631 12.70702 Equal variances
not assumed
6.364 52.515 .000 9.66667 1.51887 6.61954 12.71380
In Class A which was the controlled class and the book 504 absolutely essential words was taught in a usual way, the mean was reported to be 34.73. In the second class which the participants were taught by 504 absolutely essential words flashcard-based instruction, the scores had the mean score of 44.40. As it can be seen, the difference between the means of two classes is about 10. The T-Test reported the difference of the two means to be Significant; the T-value is 6.364. The P-Value is < 0.00001. The result is significant at p < 0.01.
Investigation of the Second Research Question
In order to address the second question, the performance of the participants in Class B and Class B was measured considering the gender factor, which shows no great difference between male and female participants (as illustrated in Table 4 and Figure 2).
Table 4
Group Statistics
Groups N Mean Std. Deviation Std. Error Mean Vocabulary
Test Male Female 11 19 45.2727 43.8947 4.94148 4.84074 1.48991 1.11054
Modern Journal of Language Teaching Methods ISSN: 2251-6204
Vol. 6, Issue 7, October 2016
Page 38
Figure 2. Distribution of vocabulary test scores in Class Bamong different Gender
Inferential Statistics: Independent T-Test
For the sake of the second research question of the study regarding gender, the difference between the mean of male performance in Class B and female performance in Class B was also calculated. As it was reported the mean of male participants was 45.27, and female participants was 43.89. As it can be guessed the difference was reported not to be Significant. The T-value is 0.746. The P-Value is 0.462. The result is not significant at p < 0.05 (Table 5).
Table 5
Independent Samples Test
t-test for Equality of Means
t df
Sig. (2-tai le d) Mean Di ffe re nc e
Std. Error Di ffe re nc e
95% Confidence Interval of the
Difference
Lower Upper Vocabulary Test Equal varia nces assu med
.746 28 .462 1.37799 1.84772 -2.40689 5.16287
Equal varia nces not assu med
.742 20.656 .467 1.37799 1.85826 -2.49040 5.24638
Discussion and Conclusion
The findings of the study confirmed the positive effect of using flashcard-based instruction on vocabulary learning among intermediate learners. This finding is in contrast with Khodashenas, Farahani, and Alishahi (2014) who did not find any special difference between using flashcard-based instruction and the conventional way teaching vocabulary. But the finding is in line with Altiner (2011) which also found the positive effect of using flashcard-based instruction on
50
47 49 37
45 50
38 39
48 49 46 35
50 47
39 49
42 4