ScholarWorks @ Georgia State University
ScholarWorks @ Georgia State University
Public Health Theses School of Public Health
Spring 5-3-2010
Examination of the Association between Patient Empowerment
Examination of the Association between Patient Empowerment
and Diabetes Management among an Urban African American
and Diabetes Management among an Urban African American
Population by Gender, Age, Socioeconomic Status and Education
Population by Gender, Age, Socioeconomic Status and Education
Level
Level
Nyo Yamonn
Georgia State University
Follow this and additional works at: https://scholarworks.gsu.edu/iph_theses Part of the Public Health Commons
Recommended Citation Recommended Citation
Yamonn, Nyo, "Examination of the Association between Patient Empowerment and Diabetes Management among an Urban African American Population by Gender, Age, Socioeconomic Status and Education Level." Thesis, Georgia State University, 2010.
https://scholarworks.gsu.edu/iph_theses/83
EXAMINATION OF THE ASSOCIATION BETWEEN PATIENT EMPOWERMENT AND
DIABETES MANAGEMENT AMONG AN URBAN AFRICAN AMERICAN POPULATION BY
GENDER, AGE, SOCIOECONOMIC STATUS AND EDUCATION LEVEL
by
NYO YAMONN
MB;BS, Institute of Medicine (I), Myanmar
A Thesis Submitted to the Graduate Faculty
of Georgia State University in Partial Fulfillment
of the
Requirements for the Degree
MASTER OF PUBLIC HEALTH
ATLANTA, GEORGIA
EXAMINATION OF THE ASSOCIATION BETWEEN PATIENT EMPOWERMENT AND
DIABETES MANAGEMENT AMONG AN URBAN AFRICAN AMERICAN POPULATION
BY GENDER, AGE, SOCIOECONOMIC STATUS AND EDUCATION LEVEL
by
NYO YAMONN
Approved:
Frances McCarty, Ph.D.
__________________________________________ Committee Chair
Catherine S. Barnes, Ph.D.
__________________________________________ Committee Member
April 27, 2010
ABSTRACT
NYO YAMONN
Examination of the association between patient empowerment and diabetes management among an urban African American population by gender, age, socioeconomic status and education level (Under the direction of FRANCES McCARTY, Ph.D., FACULTY MEMBER)
Diabetes mellitus is a significant problem in the United States with the burden being greater in the African American population. Because diabetes is complex and costly, the importance of self-care management changes the disease management paradigm from “provider-centered” to “patient-centered”. Empowerment is recommended as a possible solution for barriers to self-management education and better diabetes care. “Patient empowerment is defined as helping patients discover and develop the inherent capacity to be responsible for one’s own life.”
Although patient empowerment is a valuable philosophy, there are gaps between the philosophy and actual practice. There are limited studies addressing the effectiveness of patient
empowerment at improving diabetes management. Therefore, this study examined the
Author’s Statement Page
In presenting this thesis as a partial fulfillment of the requirements for an advanced degree from Georgia State University, I agree that the Library of the University shall make it available for inspection and circulation in accordance with its regulations governing materials of this type. I agree that permission to quote from, to copy from, or to publish this thesis may be granted by the author or, in his/her absence, by the professor under whose direction it was written, or in his/her absence, by the Associate Dean, College of Health and Human Sciences. Such quoting, copying, or publishing must be solely for scholarly purposes and will not involve potential financial gain. It is understood that any copying from or publication of this thesis which involves potential financial gain will not be allowed without written permission of the author.
Nyo Yamonn
All theses deposited in the Georgia State University Library must be used in accordance with the
stipulations prescribed by the author in the preceding statement.
The author of this thesis is:
Student’s Name: Nyo Yamonn
Street Address: 642 Centennial Olympic Park Dr.
City, State, and Zip Code: Atlanta, Georgia 30313
The Chair of the committee for this thesis is:
Professor’s Name: Dr. Frances McCarty
Department: Institute of Public Health
College: Health and Human Science
Georgia State University P.O. Box
4018
Users of this thesis who not regularly enrolled as students at Georgia State University are required to attest acceptance of the preceding stipulation by signing below. Libraries borrowing this thesis for the use of their patrons are required to see that each user records here the
Atlanta, GA 30313, USA. Tel: (626)602-4373 (Cell) Email- [email protected]
Georgia State University, (GSU), Atlanta, GA
Master of Public Health Candidate – anticipated 5/2010 Specialization: Health Promotion and Behavior
Institute of Medicine (I), Yangon, Myanmar
Bachelor of Medicine and Bachelor of Surgery (MB;BS) – 03/1999
Freelance Writer, Myanmar 12/1990 to current
Intern, 05/2009 to 08/2009
American Diabetes Association, Southeast Division, Atlanta, USA
Program Officer, 07/2007 to 06/2008 International HIV/AIDS Alliance, Sex Workers Program, Yangon, Myanmar
Consultant, 04/2007 to 07/2007 International HIV/AIDS Alliance, Sex Workers Program, Yangon, Myanmar
Behavior Change and Communication Officer, 04/2005 to 03/2007 Medecins Du Monde, Yangon, Myanmar
IEC developer, Medecins Du Monde, Yangon, Myanmar 01/2005 to 03/2005 Medical Officer, 08/2003 to 12/2004 Jivitadana Sangha Hospital,Yangon, Myanmar
Medical Officer /Intern, 04/1999 to 03/2000
Teaching Hospitals of Institute of Medicine (I), Myanmar
Study report on “Utilization of Voluntary Health Workers 11/ 1995 at the Grass Roots Level” based on the research conducted by
a group of fourth year medical students
Diane Caves Memorial Award 04/ 2010
by the Institute of Public Health, Georgia State University, USA
South East Asia Supplemental Award 03/2010
by Institute of International Education, USA
Fulbright Scholarship Award 2008
by the United States Department of State for a 2-year MPH program
EDUCATION
PRFESSIONAL EXPERIENCE
RESEARCH & PUBLICATION EXPERIENCE
TABLE OF CONTENTS
LIST OF TABLES .………...……... vii
ACKNOWLEDGEMENTS...…... viii
CHAPTER I ...…...…. 1
Introduction: ...…. 1
Purpose of Study: ...…... 3
Hypotheses: ...……. 4
CHAPTER II ...……….. 5
Literature Review: ... 5
Racial & Cultural Issue: ...………... 8
The Concept of Patient Empowerment in the Diabetes Care: ... 9
Self-management education: ...……. 11
Goal settings: ...……... 13
Patient-provider communication: ...……. 14
Literacy: ...……... 15
Areas of future research: ...……... 16
CHAPTER III ...………....……. 18
Methods and Procedures: ... 18
Primary Data Collection: ...…………... 18
Secondary Data Analysis: ...…... 23
CHAPTER IV...……...…… 26
Results: ...……... 26
CHAPTER V ...…………. 43
Discussion: ...…… 43
Limitations: ...…….…. 48
Conclusion: ...…...…… 49
REFERENCES...…………... 50
APPENDICES………. 58
Appendix A: ... 58
Appendix B: ...……… 59
Appendix C: ...…...….. 60
Appendix D: ...…...….. 61
LIST OF TABLES
Table 1: Descriptive characteristics of the study sample at baseline……….. 33 Table 2a: HbA1c levels at baseline and 12 month in different study groups……….. 33 Table 2b: HbA1c levels at baseline and 12 month in different study groups stratified by age………... 34 Table 2c: HbA1c levels at baseline and 12 month in different study groups stratified by gender……. 34 Table 2d: HbA1c levels at baseline and 12 month in different study groups stratified by income…… 34 Table 2e: HbA1c levels at baseline and 12 month in different study groups stratified by educational
attainments ……….. 35 Table 3a: DES scores at baseline and 12 month in different study groups………. 35 Table 3b: DES scores at baseline and 12 month in different study groups stratified by age …………. 35 Table 3c: DES scores at baseline and 12 month in different study groups stratified by gender…….... 36 Table 3d: DES scores at baseline and 12 month in different study groups stratified by income……... 36 Table 3e: DES scores at baseline and 12 month in different study groups stratified by educational
attainments………... 37 Table 4a: PAM scores at baseline and 12 month in different study groups……… 37 Table 4b: PAM scores at baseline and 12 month in different study groups stratified by age……….... 37 Table 4c: PAM scores at baseline and 12 month in different study groups stratified by gender……... 38 Table 4d: PAM scores at baseline and 12 month in different study groups stratified by income ……. 38 Table 4e: PAM scores at baseline and 12 month in different study groups stratified by educational
attainments……….. 38 Table 5a: Correlations between DES scores and HbA1c levels at different time periods in different
study groups………. 39 Table 5b: Correlations between DES scores and HbA1c levels at different time periods in different
study groups stratified by age ………. 39 Table 5c: Correlations between DES scores and HbA1c levels at different time periods in different
study groups stratified by gender ..………. 39 Table 5d: Correlations between DES scores and HbA1c levels at different time periods in different
study groups stratified by income ..……… 40 Table 5e: Correlations between DES scores and HbA1c levels at different time periods in different
study groups stratified by educational attainments………... 40 Table 6a: Correlations between PAM scores and HbA1c levels at different time periods in different
study groups………. 41 Table 6b: Correlations between PAM scores and HbA1c levels at different time periods in different
study groups stratified by age ………... 41 Table 6c: Correlations between PAM scores and HbA1c levels at different time periods in different
study groups stratified by gender………. 41 Table 6d: Correlations between PAM scores and HbA1c levels at different time periods in different
study groups stratified by income ………... 41 Table 6e: Correlations between PAM scores and HbA1c levels at different time periods in different
viii
ACKNOWLEDGMENTS
I would like to acknowledge Dr. Frances McCarty and Dr. Catherine S. Barnes for their support and dedication on this project. The expertise of Dr. Frances McCarty in the statistics field and the expertise of Dr. Catherine S. Barnes in the diabetes field are invaluable and ever so needed.
Additionally, I would like to thank Adrienne R. Herron and the research team of the
Endocrinology Department of the Medical Department of the Emory University for their support and understanding throughout the entire process.
Furthermore, I would like to thank Dr. Michael P. Eriksen and the Institute of Public Health faculty and staff of the Georgia State University for empowering me with their understanding and support throughout my studying period.
Also, I would like to thank Dr. Ye Mon Myint, MBBS, MPH, DrPH candidate who inspired me and empowered me to study abroad and for being a mentor to me since before the scholarship application process.
1
Chapter I
Introduction
According to the Centers for Disease Control and Prevention (CDC), 23.6 million people
living in the United States—7.8% of the total population—is estimated to be suffering from diabetes
mellitus. Among them, 75% are diagnosed and 25% do not know their diabetic health status (CDC,
2009).
“Diabetes is a disease in which the body has a shortage of insulin or a decreased ability to use
insulin, a hormone that allows glucose (sugar) to enter cells and be converted to energy. When
diabetes is not controlled, glucose and fats remain in the blood and, over time, damage vital organs”
(CDC, 2009). There are two major types of diabetes: type 1 and type 2 diabetes. Type 1 diabetes
develops when the body’s immune system destroys pancreatic beta cells which make the insulin
hormone that regulates blood glucose in the body (CDC, 2007). This form of diabetes mainly occurs
in children and young adults but it can actually occur at any age. Type 1 diabetes accounts for 5 to
10% of all diagnosed diabetes cases and type 2 diabetes accounts for 90 to 95% of all diagnosed
diabetes cases. Although there is no known way to prevent type 1 diabetes, type 2 diabetes can be
prevented or its onset delayed up to a certain extent (CDC, 2007).
Type 2 diabetes usually develops when the need for insulin rises and the pancreas gradually
loses its ability to produce it (CDC, 2007). Type 2 diabetes is usually associated with older age,
obesity, a history of gestational diabetes, impaired glucose metabolism, physical inactivity, and race
Native Hawaiians or Other Pacific Islanders are at particularly high risk for type 2 diabetes (CDC,
2007).
Almost 12% of those diagnosed with diabetes are African Americans and 3.7 million or
14.7% of all non-Hispanic blacks age 20 and older were estimated to have diabetes (National
Institute of Health, 2008). African Americans were twice as likely to be diagnosed with diabetes as
non-Hispanic Whites. According to 2006 data, African American men were 2.2 times as likely to
start treatment for end-stage renal disease related to diabetes, as compared to non-Hispanic white
men. African Americans were 2.3 times as likely as non-Hispanic Whites to die from diabetes.
According to 2005 data, diabetic African Americans have twice the chance of being hospitalized
compared to diabetic non-Hispanic Whites (U.S Department of Health and Human Services, 2009).
In Georgia, the rate of diabetes is even higher than the national rate. In 2007, 10.1% of
Georgia adult population had been diagnosed with diabetes. It is estimated that for every two people
who have been diagnosed with diabetes, another has not yet been diagnosed, and therefore, the actual
rate is estimated to be doubled which would be 20.2% (Georgia Department of Community Health,
Division of Public Health, 2008).
Diabetes was the seventh highest cause of death listed on U.S. death certificates in 2006 in
the U.S. as well as in Georgia. In Georgia, the age-adjusted death rate per 100,000 populations was
2.3 times higher among the African American population than among Whites and it is identical to the
national estimation (Georgia Department of Community Health, Division of Public Health, 2008).
These data indicate the size of the burden of diabetes and its complications in the African American
population in Georgia.
In addition, the cost of diabetes is very high. The total health care cost for diabetes is
estimated to be $174 billion, which includes direct medical costs of $116 billion and indirect costs of
$58 billion (The American Diabetes Association (ADA), 2008). Indirect medical costs are related to
U.S. is spent caring for someone with diagnosed diabetes, while 1 in every 10 health care dollars is
attributed to diabetes (ADA, 2008). These estimations do not include social cost of intangibles such
as pain and suffering, care provided by non paid caregivers, excess medical cost associated with
undiagnosed diabetes, and diabetes-attributed costs for health care expenditure categories. Therefore,
the actual national burden of diabetes is likely to be higher than the $174 billion estimation (ADA,
2008).
Moreover, people with diagnosed diabetes have medical expenditures that are about 2.3 times
higher than medical expenditures for people without diabetes (CDC, 2009). Diabetes related
complications account for nearly 50% of direct health care or medical cost due to diabetes (ADA,
2008). Secondary and tertiary prevention methods that is, effective management to prevent
complications related to diabetes and reduced morbidity and mortality related to complications of
diabetes, can play a very important role in reducing diabetes related health care costs.
Purpose of Study
The purpose of this study is aimed at understanding the factors which may improve diabetes
disease management. Understanding the factors that influence diabetes management will provide
significant information regarding areas in which diabetes disease management can be improved. In
diabetes disease management, the importance of patient empowerment has been recognized and the
paradigm is shifting from a traditional provider-centered model to a patient-centered model (Funnell
& Anderson, 2004; Funell et al., 1991). “Patient empowerment is defined as helping patients
discover and develop the inherent capacity to be responsible for one’s own life” (Funnell &
Anderson, 2004, p.124; Funnell et al., 1991). There are many inherent issues, such as gaps between
the theoretical concept and practical application of patient empowerment in diabetes care and its
short-term and long-term effects in diabetes management. It is important that the total effects of the
the association between patient empowerment and glycated hemoglobin (HbA1c) level. HbA1c test
is one of the recommended tests for diagnosis and it is also used to predict the risk for the long-term
complications of diabetes (ADA, 2010a; ADA, 2010b). It gives the average blood glucose level of a
person over the past two to three months and the measure is given as a percentage (ADA, 2010a).
Specifically, this study is focused on whether or not there is an association between patient
empowerment and diabetes management in terms of HbA1c by age, socioeconomic status, education
and gender.
Hypothesis
Based on the aforementioned research question, the following hypotheses were created:
1. H0 = DES score in diabetes care is not negatively associated with the HbA1C level of diabetes
patient
Ha = Diabetes Empowerment Scores (DES score) in diabetes care is negatively associated with the
HbA1c level of diabetes patient
2. H0= PAM score is not negatively associated with the HbA1c level of diabetes patient
Ha= Patient Activation Measure score (PAM score) in diabetes care is negatively associated with the
5
Chapter II
Literature Review
Currently in the United States, nearly 8% of population is living with diabetes mellitus (CDC,
2009). Moreover, diabetes is a serious disease and it can lead to severe complications, such as
blindness, kidney damage, cardiovascular disease, stroke, and lower-limb amputations. To date, no
cure for diabetes has been found. However, once a person has diabetes there are ways to manage it
(CDC 2007).
Diabetes is the leading cause of new cases of blindness among adults aged 20-74 years old,
kidney failure and non-traumatic lower extremities amputation (CDC 2007). Therefore, it is
imperative for the people living with diabetes to learn how to correctly manage the disease in order to
prevent these complications and maintain their quality of life. For both type 1 and type 2 diabetes,
the best prophylaxis against microvascular complications is tight glycemic control. The best
prophylaxis against macrovascular complications is comprehensive risk reduction including
glycemic, lipid and blood pressure control, smoking cessation, regular eye and feet examinations and
other regular care according to the recommendations of the American Diabetes Association (ADA)
(ADA, 2010b; CDC 2007; Stratton, et al., 2000).
In general, every percentage point drop in HbA1c blood levels can reduce the risk of micro
vascular complications such as eye, kidney and nerve diseases by 40% (CDC, 2007). Blood pressure
control for patients with diabetes reduces the risk of cardiovascular disease such as heart disease or
in systolic blood pressure, the risk for any complication related to diabetes is reduced by 12% (CDC,
2007).
Improved control of low density lipoprotein cholesterol can reduce cardiovascular
complications by 20-50% for patient with diabetes. Detection and treating diabetes eye disease with
laser therapy can reduce the development of severe vision loss by about 50 - 60%. Comprehensive
foot care programs can reduce amputation rates by 45-85%. Detecting and treating early diabetes
kidney disease by lowering blood pressure can reduce the decline in kidney function by 30-70%
(CDC, 2007).
Glycemic control is a fundamental requirement for day-to-day management of diabetes. It is
also the most important factor in care and prevention (ADA, 2005; Stratton, et al., 2000). Glycemic
control is measured by different types of blood glucose level measurement such as fasting blood
glucose, random blood glucose level, two hour postprandial blood glucose level and HbA1c level
(ADA, 2005).
Fasting glucose is the standard measure used to diagnose diabetes in the United States.
Currently, HbA1c test is also recommended for diagnostic purpose as well as prediction of the risk
for the long-term complications of diabetes (ADA, 2010a; ADA, 2010b). It gives the average blood
glucose level of a person over the past two to three months and its measure is given as a percentage
(ADA, 2010a). The recommended testing frequency of HbA1c is approximately every three months
but it can be more or less frequent depending on the stability of glycemic control (ADA, 2010b).
Selvin et al. (2010) said HbA1c test have certain advantages over fasting glucose test for the
diagnosis of diabetes. In their study, HbA1c levels were found to be an accurate predictor of future
diabetes and a better predictor for diabetes related complications such as stroke and heart disease
(Selvin et al., 2010). HbA1c tests have an advantage over the fasting blood glucose because they do
not require patients to fast for accurate results; they have stability as they are not affected by stress,
In January 2010, the ADA revised their recommendation for the screening and diagnosis of
diabetes. In the revised guidelines, the ADA classified people with HbA1c levels 5.7 to 6.4 percent
as very high risk for developing diabetes over the following five years (ADA, 2010b). A person
without diabetes would have an HbA1c of about five percent and the diagnosis of diabetes would be
made if the level rose to 6.5 percent or higher (ADA, 2010b). The ADA recommends people with
diabetes to keep HbA1c level below seven percent in order to manage their disease properly and
prevent complications (ADA, 2010b).
Although people with type 1 diabetes need insulin delivered by an injection or a pump for
their survival, people with type 2 diabetes may be able to control their glucose level just by following
an exercise program and a healthy meal plan (CDC, 2007). Among adults with diagnosed diabetes in
both type 1 or type 2, 14% take insulin only, 13% take both insulin and oral medication, 57% take
oral medication only and, 16% do not take either insulin or oral medication. Medications for each
individual with diabetes usually change during the course of the disease (CDC, 2007).
Because of its long-term nature and importance of day to day care, diabetes self-care
management and active participation of patients in their care are important factors in successful
diabetes management (Funnell et al., 2010). Although good practices of physicians and other health
care providers are important, disease management is not solely in the hands of health care providers.
Moreover, many psychological, emotional, social, spiritual, cognitive, economic, literacy, and
cultural factors are intertwined with diabetes management, and traditional medical models usually
ignore these important factors (B. Anderson & Funnell, 2005; Funnell & Anderson, 2004).
Therefore, Funnell et al. (1991) proposed the empowerment model as an appropriate model for
diabetes management to address the areas neglected in traditional medical models in diabetes care
(Funnell & Anderson, 2004; Funnell et al., 1991).
In this literature review, the empowerment model in diabetes care will be discussed by its
concept of patient empowerment in the diabetes care, (3) self-management education, (4) goal
setting, (5) patient-provider communication, and (6) literacy.
(1)
Racial & Cultural Issue
Racial or ethnic minority populations and people with low socioeconomic status are facing a
greater risk of developing diabetes complications (Liburd, 2010). As stated, the African American
population is one of the populations who are having a higher burden of diabetes both in terms of
prevalence and complications. Correa-de-Araujo, McDermott, & Moy (2006) found that
hospitalization due to diabetes complications decrease with higher income level in each racial and
ethnic group (Correa-de-Araujo et al., 2006). Therefore, income appears to be a very important factor
in diabetes management and control.
However, disparities in quality of health care, differences in health care behavior such as
nutritional habits or physical inactivity, adherence to medication, psychosocial factors such as
differing level of trust in providers or the health care systems, health literacy, educational attainment,
access to health care, lack of or inadequate health insurance are also possible factors in the disparities
of diabetes control (Dreeben, 2001; Liburd, 2010).
“Research has shown that doctors have poorer communication with minority patients than
with others, but problems in doctor-patient communication have received little attention as a
potential cause, a remedial one, of health disparities” (Ashton, et al., 2003). Cultural competency and
cultural sensitivity of health care provider is a necessity to address health disparities in the different
racial and ethnic groups. The patient empowerment approach is one of the possible solutions for
addressing racial disparity in diabetes care (Dreeben, 2001; Greene, McClellan, Gardner & Larson,
(2)
The Concept of Patient Empowerment in Diabetes Care
Patient empowerment is a philosophy that requires “a paradigm shift” from the traditional
provider-centered medical model to a patient-centered collaborative care (Funnell & Anderson, 2004;
Funnell & Anderson, 2003; Funnell et al., 1991). “Patient empowerment is defined as helping
patients discover and develop the inherent capacity to be responsible for one’s own life” (Funnell &
Anderson, 2004, p.124; Funnell et al., 1991).
To foster the philosophy of empowerment in their practice, the health care providers need to
recognize that people with diabetes are the experts of their own lives and are responsible for choices
they make (Funnell & Anderson, 2003). Within this model, the role of the health care providers is “to
inspire, inform, support and facilitate their patients to identify and attain their own goals” (Funnell &
Anderson, 2003, p.456). Instead of applying behavior strategies to patients to change behavior, the
health care providers should explain these strategies to their patients and allow them to make changes
in behaviors of their own choosing (Funnell & Anderson, 2003; Funnell et al, 1991; Anderson,
Funnell, Barr, Dedrick, & Davis, 1991). Because these changes are identified by the patients as being
important to them, they are more likely to maintain the changes (Anderson et al., 1991; Funnell &
Anderson, 2003; Funnell et al, 1991).
In the empowered caring model, which evolved out of a qualitative explanatory study with
public health nurses, these nurses conceptualized empowerment as “an active, internal process of
growth that was rooted in one’s own cultural or religious or personal belief systems, reached toward
actualizing one’s full potential, and occurred within the context of a nurturing nurse-client
relationship” (Falk-Rafael, 2001, p.4, Appendix A). The public health nurses believed that providers
could only facilitate empowerment in others and could not create it for them. They identified that the
empowerment process included active participation and increased awareness of one’s own strengths
directly affecting one’s health, and social and political factors that influence health and health care
(Falk-Rafael, 2001).
Moreover, an increase in knowledge and skills to act correctly on informed choices are also
interwoven with active participation and increased awareness. They asserted that the process of
empowerment began internally and it produces a ripple effect that positively affected the family
members and other individuals that patients interacted with. Therefore, the health care providers are
also empowered through their patients in a reciprocal effect (Falk-Rafael, 2001).
However, mere assumption of equal partnership in disease management is not sufficient to
empower patients (Paterson, 2001). In health care settings, it is very common for the health care
providers to discount the experiential knowledge of diabetes patients. Also, it is very common that
the health care providers do not provide enough information and skills to support informed decision
making process of diabetes patients. The health care providers are unable to let go of their own
agendas, their control in the decision making process, feeling responsible for their patients (Funnell
& Anderson, 2004; Paterson, 2001).
Embracing the philosophy of empowerment and integrating it into practice is easier said than
done. The health care providers not only need to believe in the empowerment philosophy but also
need to be aware of their own behaviors and learn to reflect and make necessary changes in their
practice. Therefore, it takes behavior change and commitment of health care providers in order to
cultivate a real empowerment approach in diabetes care (B. Anderson & Funnell, 2005; R. Anderson
& Funnell, 2005; Funnell & Anderson, 2003). In a study from Sweden, the researchers found that
physicians and nurses needed ongoing support to use an empowerment approach in their practices
because it was difficult to define their role in the empowerment caring practice and they did not feel
secure with the new roles (Adolfsson, Smide, Gregeby, Fernström, & Wikblad, 2004).
In the health care settings, empowered behaviors of patients are found to be associated with
self-treatment (Pierce & Schwartz, 2008, p. 3). A patient-centered collaborative approach in chronic
illness care has been found to be effective (Wagner, et al., 2001). Research has documented that the
patient empowerment approach is effective in the diabetes care (Anderson et al., 1995).
(3)
Self-Management Education
Arnold, Butler, Anderson & Funnell (1995) proposed that as much as 95% of self-care is
usually provided by the ill persons or their families in diabetes management. In the study by
O’Connor et al. (2008), it was also found that the 95% of variance in HbA1c control was attributable
to the patient level such as increased adherence to treatment guidelines or readiness to change (O’
Connor et al., 2008). Diabetes self-management education (DSME) has been recognized as an
essential component in diabetes care (ADA, 2010b; CDC, 2009; Funnell et al., 2010; National
Institute of Health, 2008). The National Standard for DSME is designed on the evidence and are
reviewed and updated every 5 years by a task force from the representatives of the key organizations
in the field of diabetes education and care (ADA, 2010b; Funnell et al., 2010).
However, the actual DSME practice in the diabetes care seems to be very limited. Even
though many health care settings are providing self-care management education, there are gaps in
patient knowledge of diabetes care. The barriers in self-care management education include poor
patient-provider communication, low health literacy of patients, low self-efficacy of patients, race,
cultural and gender issues (Clark, 2008; Leichter, 2005; Gazmararian, Ziemer & Barnes, 2009;
Odegard & Gray, 2008).
Moreover, the requirements of self-care management education for diabetes patients are very
diverse and therefore, an individualized approach is recommended by national standards of DSME
(Funnell et al., 2010). To keep the patient’s glycemic index at the desirable level requires knowledge,
stress management, nutrition, importance of adherence to medication, significance of exercise and
physical activity, and self-monitoring of glucose level. Both hypoglycemia and hyperglycemia can
cause acute life threatening complications like diabetic ketoacidosis and hyperosmolar nonketotic
coma. Patients need to learn how to diagnose, appropriately treat and prevent these life threatening
complications (Funnell et al., 2010; Funnell & Haas, 1995). In addition to that, they need to learn
how to prevent, detect and seek treatments for chronic complications. Comorbidities are very
common in diabetes patients and the care of comorbid diseases cannot be ignored in the DSME
(Funnell et al., 2010; Funnell & Haas, 1995).
Furthermore, a one time education program is rarely effective; patients need on-going
self-management education and support from their providers and the entire diabetes health care team. The
researchers suggested that diabetes education should aim at a positive attitude to active self-care
because it was found that patient’s attitude was the most important determinant for active self-care.
Social environment also has an important influence on the attitude of the patients and a supportive
atmosphere is very important for the patient with diabetes (de Weerdt, Visser, Kok, & van der Veen,
1990). The supportive environment can be facilitated through support group formation, educating
and counseling for family members, as well as creating supportive health care settings.
The objective of DMSE within the empowerment philosophy is to help patients to clarify
their own problems, values and motivations and to identify diabetes related goals they really want to
achieve in their diabetes care (Anderson et al., 1995; Funnell et al., 1991). To achieve DSME
objectives, patients need a psychologically safe environment to explore their own emotions. Patients
also need to have enough information on diabetes care and various treatment options, benefits and
drawbacks of these options and enough knowledge and skills to change their own behaviors and
solve their own problems (Arnold et al., 1995). The collaborative goal setting approach is an
(4)
Goal settings
The DSME within this approach enables patients to participate in the decision making
process, have informed choices, and affords the ability not to blindly comply with or adhere to
provider-selected goals (Funnell & Anderson, 2004). In general, the goal setting approach was found
to have beneficial effects such as an increase in motivation and higher performance if they are
self-set and attainable goals. However, conflicts between the provider’s and patient’s goals can cause
undesirable effects (Locke & Latham, 2002). The collaborated goal setting approach is a solution to
avoid conflicts between health care provider goals and patient goals. Goal setting helps both patients
and providers. For patients, the process creates a sense of accountability and ownership which are
very important in successful self-care management. For providers, collaborative goal setting helps
them to identify the barriers to successful treatment (B. Anderson & Funnell, 2005; Langford,
Sawyer, Gioimo, Brownson, & O'Toole, 2007).
Since the patients participate in the selection of goals, they are clear about these goals and
therefore, more likely to be successful in achieving them (Heisler et al., 2002). Engaging patients in
the goal setting process not only improves their self-efficacy but also provides emotional support and
facilitates learning (Funnell & Anderson, 2004). Moreover, goal setting can enhance self-monitoring
skill of the patient which is an integral part of the behavior change process (Delamater, 2006).
Funnell & Anderson identified a five step goal setting empowerment process: 1. explore the
problem or issue; 2. clarify feelings and meaning; 3. commit to action; 4. experience and 5. evaluate
the plan (Funnell & Anderson, 2004). Diabetes educators that have used collaborative goal setting
approach have found some unexpected barriers to diabetes management (B. Anderson & Funnell,
2005). Implementing a successful empowerment process takes time, commitment, tolerance,
understanding of patients’ needs, patient support, and self-directed behavior change by the health
collaborated goal setting can be an effective part of diabetes management (B. Anderson & Funnell,
2005; Falk-Rafael, 2001; Langford et al., 2007).
(5)
Patient-Provider Communication
Provider behavior is a very important part of patient empowerment. Anderson & Funnell
(1999) said attitude and vision of diabetes educators can influence the outcome of disease
management. Physician behavior change has the possibility of fostering faster improvement in
disease management (Solomon, 1995). Patient-centered care is now recognized as a core public
health professional competency, central to meeting patients’ evolving needs, improving the quality of
care, and transforming the health care system (Institute of Medicine, 2003). This approach is
especially important given the ethnic and cultural diversity in the United States (Institute of
Medicine, 2003).
Research suggests that patient-provider interaction styles can influence patients’
self-management in diabetes care (Heisler, Bouknight, Hayward, Smith, & Kerr, 2002). Physicians who
used a participatory decision making style of communication can improve patients’ self-care
management. Patient perception of how well their physicians provide information on their illness and
treatment were also strongly associated with diabetes self-management (Heisler et al., 2002). Patient
understanding of their care was also found to have a strong independent effect on diabetes
self-management (Heisler et al., 2002). Increasing patient motivation and patient engagement in the
treatment may also be the secondary effect of patient involvement in the decision making process
which improves the self-care management behavior (Worlpert & Anderson, 2001).
Physicians can provide essential basic knowledge needed for their patients to make their own
decisions about their treatment and self-care priorities. Therefore, measures to promote better
(Heisler et al., 2002). However, many studies found that patients desire to seek more information
from their physicians are not met. Many patients leave a physician’s office visit without knowing
how they should take care of themselves (Beisecker & Beisecker, 1990; DiMatteo, 1998).
In actual health care settings, primary care physicians and specialists are often unable to
give the required amount of time to talk and educate the patient, which are vital to the adherence to
treatment. Patients should be referred to diabetes educators for additional information and essential
DSME but that does not always happen in diabetes care. The barrier includes restriction of DSME by
health insurance providers (Powell, Glover, Probst, & Laditka, 2005).
Studies have found that feedback and reminders to providers improve the physicians’
adherence to clinical guidelines (Phillips et al., 2002; Schectman, et al., 2004). Receiving patient
feedback can have an effect on treatment. Improving provider-patient communication can facilitate
positive health care outcomes by both improving patient adherence to self-care management and
provider adherence to diabetes management guidelines.
(6)
Literacy
Since patients need enough knowledge to make rational decisions for their own lives to feel
empowered, communication materials are regarded as very useful tools for providing knowledge.
Currently internet-based self care education is being provided by many organizations, but people
with no or low computer literacy skills and general literacy skills are unable to access them. Printed
materials are commonly used by health care centers to give additional information to the patients to
compensate for the limited period of consultation (Mayer & Villaire, 2007).
However, communication materials should not be a replacement for the necessary education
provided by health care providers. A meta-analysis of randomized controlled trial studies on
patient and educator contact time and improvement of HbA1c. It is noted that there is a decrease of
1% HbA1c for every additional 23.6 hours of contact between patients and educators (Norris, Lau,
Smith, Schmid, & Engelgau, 2002). Therefore, the importance of interpersonal communication
should not be discounted.
Because of health literacy issues, the communication materials should be simple, clear and
designed for an audience of low reading level. Health literacy is the term used for literacy skills in
the context of health care (Institute of Medicine, 2004). Literacy skills of Americans range from the
nonreader to the highly literate. Half the U.S population read at the ninth-grade level or lower and
most current health care instructions are above that level. About one out of five adult Americans read
below the fifth-grade level (Doak, Doak & Root, 1996, p. 9).
In a study of adult health literacy in urban clinics, almost half of the patients were unable to
read well enough to follow the instructions for laboratory tests and radiology procedures. Out of
those patients, 43% denied difficulty in reading (Nurss et al., 1997). In the review by Roter, Rudd, &
Comings (1998), they also noted that patients did not confess the reading difficulties to their health
care providers, spouses, family members and friends (Roter et al., 1998). However, the intelligence
levels of these patients were not limited and they were able to understand and learn the health
education information provided by the health care providers (Doak et al., 1996; Nurss et al., 1997).
Therefore, it is very important to understand and address the literacy issue properly in the
implementation of patient empowerment interventions in diabetes care.
Areas of Future Research
There has been limited research on the comprehensive intervention of patient empowerment.
Although there are interventions which claim to have a “patient empowerment in diabetes care”
targeted to self-care management education and training of nurses and diabetes educators. Changes in
attitude and behaviors of physicians are rarely addressed even though it is a very important area in
the empowerment process.
Aujoulat, Luminet, & Deccache (2007) investigated the patient’s experience in the
empowerment process and they found “powerlessness” of patients in an empowerment care setting
because the need of empowerment goes beyond medical settings. These are areas of future research
because it is imperative to understand methods which can be used to enhance and sustain the
empowerment of patients. Even though empowerment is a philosophy that is possible to enhance the
practice of the providers, its effectiveness will depend on the vision and skills of the providers who
are using it (Anderson & Funnell, 1999). It is important to develop evidence-based interventions by
using this philosophy in its entirety. There are many questions to be answered in the
patient-empowerment practices in diabetes care and looking at the association of patient patient-empowerment level
and desired outcome of metabolic control is an important preliminary step in addressing the
18
Chapter III
Methods & Procedures
Primary Data Collection
Participants
Participants in this study were recruited in the Diabetes Clinic of the Grady Health System
(GHS), Atlanta, Georgia for the intervention study named Patient Empowerment to Improve
Diabetes Care (PEIDiC). The Endocrinology Division of the Medical Department of the Emory
University conducted the study in collaboration with the Diabetes Clinic of the Grady Health System.
The study was funded by ADA.
About 50% of patients in the Diabetes Clinic of GHS do not reach their ADA HbA1c goal.
Ninety percent of first time visitors to the Diabetes Clinic of GHS are African Americans, 61%
female and 87% have type 2 diabetes with median diabetes duration of 1.3 years. The average patient
age is 52 years with 80% of patients age 40 and above. Average BMI is 31.7 kg/m2 and 29% are
overweight and 68% are obese. Patients tend to be economically disadvantaged, less than half have
any type of health insurance, and literacy levels are low in many patients. Almost half of the patients
are unable to read well enough to follow instructions for laboratory tests and radiology procedures
(Barnes, C.S, personal communication, November 12, 2009).
For the primary study, eligibility requirements included a) being a patient in the Diabetes
Clinic of the Grady Health System, b) Type 2 diabetes on insulin, c) and HbA1c greater than 7.
that precluded reliable communication. A total of 828 patients who met the criteria voluntarily
participated in the study; 450 patients were in the control group and 378 patients were in the
intervention group.
Procedures
The research team of the Endocrinology Division of the Medical Department of the Emory
University collected the data from June 2005 to June 2008. Recruitment took place at the Diabetes
Clinic of the GHS. The researchers randomized patients into control group or the intervention group
based on the last digit of the patient’s medical record number: even digits to intervention group and
odd digits to the control group. During recruitment, the patients were systematically approached and
screened for possible participation. Those who choose to consider the study were taken to a private
room in the Diabetes Clinic. If the patient consented to participate in the study, the pre-intervention
questionnaires were administered primarily by interview because of the low literacy of many of the
patients of the Diabetes Clinic of the Grady Health System.
While control patients received care as usual, the intervention patients received a) a “real
time” (current values) road map (Appendix B), b) a communication card (Appendix C), c) coaching
by a nurse or coach on goal setting of A1c and blood sugar level, and d) instructions on how to use
these communication tools at home. The real time road map was a visual graphic report on the
progress of A1c level and random blood glucose (sugar) level of patients over time (usually the last 6
clinic visits); it was generated by the nurse or coach from the computer at each intervention patient
visit. A traffic spotlight analogy was used to present the status of glycemic control and the road maps
were printed in color and given to the patient to post at home. They used red bars to show the
patient’s glycemic control being in the danger zone, yellow bars to show the patient’s glycemic
normal. It is visually attractive and patient-friendly and an easy to follow progress report on the
patient’s glycemic control.
The communication card was a wallet-sized card which contains three questions related to
A1c: what should my A1c be to stay healthy?; what is my A1c?; and what can we do to get my A1c
better? The patients in the intervention groups were coached to practice the questions and were
encouraged to use the card during their visits to the health care providers. The coach and patient,
together, set diabetes management goals and documented these goals on the road maps. The coach
helped the patients practice how to ask questions and negotiate goals with their doctors.
The panel of questionnaires were collected at 6 month (≥4 to <10 months), 12 month (≥10 to
<16 month), 18 months (≥16 to <22 months) and 24 months (≥22 to <28 months). The research
coach recruited participants from month 3 until month 33 of the study period; the duration of
participation in the study varied from 8 to 26 month depending on the accrual date. All procedures
were conducted by a trained research nurse or coach and were approved by appropriate Institutional
Review Boards (IRB).
Measures
The study measures included data obtained from questionnaires, clinical lab values,
self-report demographics (such as income and education level), and chart review. The data used in this
sub-analysis included diabetes-related psychosocial self-efficacy measured by the 28-item Diabetes
Empowerment Scale-Short Form (DES-SF) and the 13-item Patient Activation Measure (PAM).
DES-SF was developed by the Michigan University Diabetes Research and Training Center
(Anderson, Funnell, Fitzgerald & Marrero, 2000; Anderson, Fitzgerald, Gruppen, Funnell, & Oh,
2003; Appendix D). Survey items for the DES-SF began with the common stem, “In general, I
believe that I…” and sample statements include: “…know what part(s) of taking care of my diabetes
enough about myself as a person to make diabetes care choices that are right for me.” Possible
responses on a 5-point Likert scale ranged from one (Strongly Disagree) to five (Strongly Agree).
The scale is scored by averaging the scores of all completed items. Reliability and validity data
provided preliminary evidence that the DES is a valid and reliable measure of overall
diabetes-related psychosocial self-efficacy (Anderson et al., 2003).
The original questionnaire contained 37 items representing eight conceptual dimensions
which assessed the need for change, developing a plan, overcoming barriers, asking for support,
supporting oneself, coping with emotion, motivating oneself, and making diabetes care choices
appropriate for one’s priorities and circumstances. Using factor analyses the questionnaire was
reduced to the current 28-item containing these three subscales: 1) managing the psychosocial
aspects of diabetes with 9 items, 2) assessing dissatisfaction and readiness to change with 9 items,
and 3) setting and achieving goals with 10 items (Anderson et al., 2003). The total scale score was
used in this study.
PAM was developed by Dr. Judy Hibbard at the University of Oregon (Hibbard, Mahoney,
Stockard, & Tusler, 2005; Hibbard, Stockard, Mahoney, & Tusler, 2004; Appendix E). The PAM
score measures the knowledge, skills and confidence for managing one’s own health and healthcare.
It is generally used as a measure of patient empowerment in managing healthcare and disease status.
The version used in the PEIDiC study is a shortened 13-item instrument which is down from the
original 22-item that specifically deals with patients suffering from chronic conditions like diabetes.
The Patient Activation Measure is scored by summing the 13 question survey (Hibbard et al., 2005).
Each question used a Likert-type agreement scale with four possible answers: disagree strongly,
disagree, agree and agree strongly. If one or two questions were missing answers the score was
computed from the available answers and scaled up to represent the score from the 13-item
questionnaire. If more than two answers were missing then the whole test is regarded as a missing a
the lowest activation and 100 being the highest. This score is also reported as one of four
corresponding levels of activation with the lowest level being the least empowered.
Levels of Activation are categorized as follows:
Stage 1- “Starting to Take a Role” (score ≤47): Patient does not yet grasp that they must take an
active role in their health.
Stage 2- “Building Knowledge and Confidence” (score≥47.1 and ≤55.1): Patient lacks the basic facts
or has not connected these facts into a larger understanding of their health.
Stage 3- “Taking Action” (score ≥55.2 and ≤67.0): Patients have the key facts and are beginning to
take action but may still lack confidence.
Stage 4- “Maintaining Behaviors” (score ≥67.1): Patients have adopted new behaviors but are still
working to maintain these under stress or crises (Rask et al., 2009).
The Patient Activation Measure was developed using Rasch analyses and is an interval level,
Guttman like measure. Validity has generally been shown by demonstrating that patients falling into
a specific activation stage could be categorized the same way by independent judges who looked at
interviews done with the patients (Hibbard et al., 2005; Hibbard et al., 2004). Previous research has
shown that higher PAM scores indicate better adherence to medication, more self-management
behaviors, and healthier behaviors (Hibbard, Mahoney, Stock, & Tusler, 2007; Mosen, Schmittdiel,
Hibbard, Sobel & Remmers, 2007; Rask et al., 2009).
The knowledge level of patients on diabetes management was measured by a
non-standardized questionnaire. In the questionnaire, the knowledge level of HbA1c is measured by the
question “what should your A1c be?” Based on the responses, the patients were divided into three
groups: patients who know the correct A1c goal; patients who do not know correct A1c goal but
recognized the A1c term; patients who did not recognized the term A1c.
The socio-demographic data, clinical data and laboratory data were collected from the
an electronic database with feedback, reporting and decision support modules used to track patient
outcomes. Clinical data from every diabetic visit to the Medical and Diabetes Clinic of the GHS were
manually entered. Laboratory and administrative data were obtained by electronic transfer from GHS
main laboratory. Therapy and disease markers, such as A1c, blood pressure, and lipid profiles can be
linked to a single patient and monitored overtime.
Secondary Data Analysis
The data from PEIDiC randomized controlled longitudinal intervention study were provided
for this analysis by the Diabetes Clinic of the GHS and by the research team of the Endocrinology
Division of the Medical Department of the Emory University. The data were de-identified through
the removal of identifiers such as patient medical record numbers, date of birth and addresses. This
study was approved by the Georgia State University IRB.
Eligibility
As stated, 828 patients participated in the study and their data were incorporated into the data
set. After non-African American patients were omitted from the study, 786 patients were left for this
analysis. Of these 786 patients, 529 patients who have complete DES and PAM score and HbA1c
data for the study period were used for this study.
Study Variables
The cross-sectional data analysis utilized three dependent variables: Diabetes Empowerment
Score which is the summary score from the 28-item DES-SF, the summary score from the 13-item
PAM, and the HbA1c level of each patient. Patients in the intervention group received additional
in the control group received Diabetes Clinic Standard care. The independent variables were the
intervention and demographic factors of age, gender, educational attainment and income level.
Data Management
SPSS Version 16.0 was utilized for data management and statistical analysis purposes. Age
was recoded from a continuous variable to the categorical variables of “50 and younger”, “51-64”
and “65 and older”. Educational attainment was recoded from 6 categories to 3 categories which
were “lower than high school graduate level”, “high school graduate or GED” and “some college or
technical school and higher”.
Socioeconomic status or income level was recoded from 10 categories to 3 categories which were
“income less than $5,000”, “income between $5,000 to $9,999” and “income $10,000 and more”.
Statistical Analysis
Descriptive analyses were conducted on the demographic variables of age, gender,
educational attainment, employment, marital status, income level and other patient characteristics
such as Body Mass Index (BMI), duration of diabetes, insulin use, HbA1c level, DES score and
PAM score at the baseline level. The mean and standard deviations (SD) were computed for all the
continuous variables while frequencies and percentages were computed for all categorical variables.
Additional descriptive analyses were conducted to compare the control group and intervention group
on these variables at baseline.
Two-Way ANOVA was conducted on DES score, PAM score and HbA1c level at the
baseline and 12 month study period and with intervention group and demographic characteristics as
independent variables. The mean and SD were computed for all variables. These analyses were
conducted for descriptive purposes in order to describe these variables with respect to different levels
Correlation
Pearson correlation was conducted to determine the degree of association of the dependent
variables, (for example, HbA1c with DES and PAM scores overall as a group, at different
intervention periods and by study group). These analyses were also stratified at by levels of age,
26
Chapter IV
Results
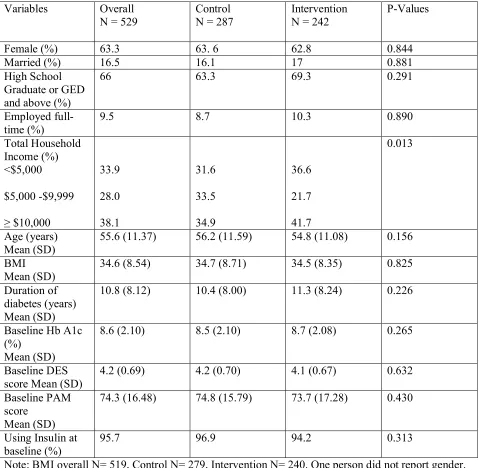
The overall sample was 63.3% female and 66% reported an education level greater than or
equal to high school graduate or GED. Only 16.5% of the overall sample was married and only 9.5%
were employed full-time. The insulin use for the treatment of diabetes at the baseline level was
95.7% for the overall sample. Mean age was 55.6 years (SD = 11.37) and mean BMI of the overall
sample was 34.6 (SD = 8.54, N = 519). Mean duration of diabetes of the overall sample was 10.8
years (SD = 8.12). Mean baseline HbA1c of the overall sample was 8.6% (SD = 2.10), mean baseline
DES score of the overall sample was 4.2 (SD = 0.69) and mean baseline PAM score of the overall
sample was 74.3 (SD = 16.48). The two treatment groups did not differ on any of these variables at
the baseline assessment. However, the two groups did differ (p = 0.013) on income with the
intervention group having a slightly higher percent (41.7%) in the upper income category compared
to the control group (34.9%).
Two-Way ANOVAs were utilized to understand how HbA1c, DES scores and PAM scores
differed between the study groups at the baseline and 12 month intervention period. Analyses were
cross-sectional and the samples were stratified by age, gender, income and educational attainment to
assess effect modification.
As seen in Table 2a, HbA1c did not appear to differ between the treatment and the control
control group at the 12 month appeared to be lower than mean HbA1c of baseline at the different
levels of age groups.
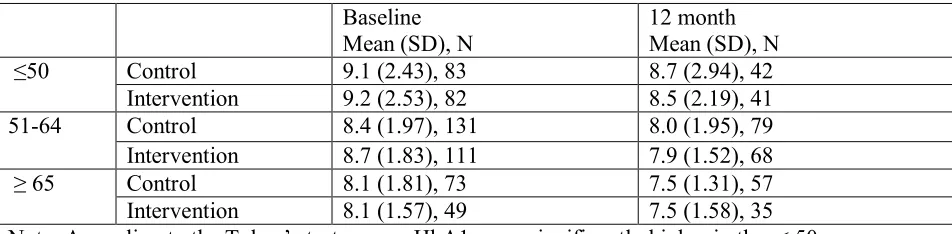
The result of a Two-Way ANOVA with baseline HbA1c as the dependent variable and
treatment group and age group as independent variables indicated a significant main effect for age
group (F(2, 523) = 9.11, p < 0.001), but no effects for either the treatment group main effects or the
treatment by age group interaction. Based on the Tukey’s post hoc test, mean HbA1c was
significantly higher in the <50 age group compared to both the 51-64 age group (p = 0.01) and ≥ 65
age group (p < 0.001). The means for the two other age groups did not differ significantly. The result
of a Two-Way ANOVA with 12 month HbA1c as the dependent variable and treatment group and
age group as independent variable indicated a significant main effect for age group (F(2, 316) =
6.53, p = 0.002) but no effects for either two treatment groups or the treatment by age group
interaction. Based on the Tukey’s post hoc test, mean HbA1c was significantly higher in the <50 age
group compared to the ≥ 65 age group (p = 0.001). The means for the other age groups did not differ
significantly. As seen in Table 2b, the mean HbA1c of the both treatment and control groups at the
12 month appeared to be lower than mean HbA1c of baseline at all the different levels of age groups.
The results of Two-Way ANOVAs with baseline and 12 month HbA1c as the dependent
variables and treatment group and gender as independent variables indicated no statistically
significant effects for either the main effects or the interaction effect. As seen in Table 2c, the mean
HbA1c of both treatment and control groups at the 12 month appeared to be lower than mean HbA1c
of baseline for both genders.
The results of Two-Way ANOVAs with baseline and 12 month HbA1c as the dependent
variable and treatment group and income as independent variables indicated no statistically
significant effects for either the main effects or the interaction effect. As seen in Table 2d, the mean
HbA1c of both treatment and control groups at the 12 month appeared to be lower than mean HbA1c
The results of Two-Way ANOVAs with baseline and 12 month HbA1c as the dependent
variable and treatment group and educational attainment as independent variables indicated no
statistically significant effects for either the main effects or the interaction effect. As seen in Table
2e, mean HbA1c of both the treatment and control group at the 12 month appeared to be lower than
mean HbA1c of baseline at all the different levels of educational attainment except in the control
group for those with some college or technical school and higher where the values were very similar.
As seen Table 3a, DES scores did not appear to differ between the treatment and the control
groups at baseline and 12 month. The result of a Two-Way ANOVA with baseline DES scores as the
dependent variable and treatment group and age group as independent variables indicated a
significant main effect for age group (F(2, 523) = 3.675, p = .026) and significant interaction effect
for age group and treatment group (F(2, 523) = 4.161, p = .016). There was no main effect for
treatment group. Based on Tukey’s post hoc test, mean DES score was significantly higher in the
51to 64 age group compared to ≥ 65 age group in the control groups (p = 0.011) and it was
significantly higher in the < 50 age group compared to 51to 64 age group in the intervention groups
(p = 0.025). The means for the other age groups did not differ significantly at the baseline.
The results of a Two-Way ANOVA with 12 month DES scores as the dependent variable and
treatment group and age as independent variables indicated no statistically significant effects for
either the main effects or the interaction effect. As seen Table 3b, DES scores did not appear to differ
between the treatment and the control groups at baseline and 12 month of the intervention period at
any age groups except at the ≥ 65 age group which appeared have higher DES score in the
intervention group at the 12 month.
The results of Two-Way ANOVAs with baseline and 12 month DES scores as the dependent
variable and treatment group and gender as independent variables indicated no statistically
scores of the study groups at 12 month did not appear to differ from DES scores at baseline for either
gender.
The result of a Two-Way ANOVA with baseline DES score as the dependent variable and
treatment group and income as independent variables indicated a significant main effect for income
(F(2, 498) = 4.094, p = 0.017) but no effects for either treatment group or the treatment by age group
interaction. Based on Tukey’s post hoc test, mean DES score was significantly higher in the
≥$10,000 income group compared to $5,000 to $9,999 group (p = 0.023). The means for the other
income groups did not differ significantly at the baseline. The results of a Two-Way ANOVA with
12 month DES scores as the dependent variable and treatment group and income as independent
variables indicated no statistically significant effects for either the main effects or the interaction
effect. As seen in Table 3d, DES scores did not appear to differ between the treatment and the
control groups at baseline and 12 month of the intervention period at any income levels.
The result of a Two-Way ANOVA with baseline DES scores as the dependent variable and
treatment group and educational attainment as independent variables indicated a significant main
effect for educational attainment (F(2, 521) = 5.949, p = 0.003) and significant interaction effect for
educational attainment and treatment group (F(2, 521) = 3.438, p = 0.033). There was no main effect
for treatment group. Based on the Tukey’s post hoc test, mean DES score was significantly higher in
the some college or technical school and above group compared to the mean DES scores of lower
than high school graduate level group (p = 0.009) and high school graduate or GED group (p =
0.001) in the intervention groups. The means between the other educational attainment groups did
not differ significantly.
The results of a Two-Way ANOVA with 12 month DES scores as the dependent variable and
treatment group and educational attainment as independent variables indicated no statistically
scores did not appear to differ between the treatment and the control groups at baseline and 12 month
of the intervention period at any levels of educational attainment.
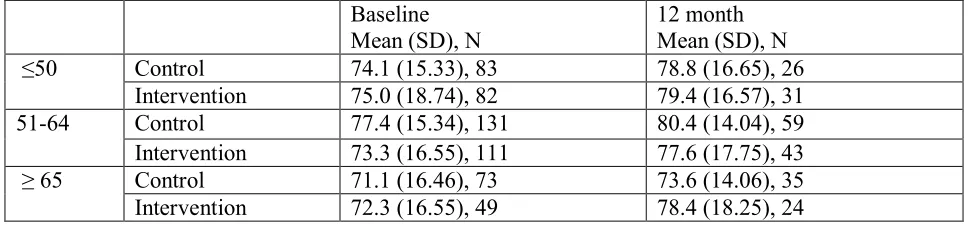
As seen in Tables 4a to 4e, the results of Two-Way ANOVA with baseline and 12 month
PAM scores as the dependent variables and treatment group and age, gender, income, or educational
attainment as independent variables indicated that there were no statistically significant effects for
either the main effects or the interaction effects. As seen in Tables 4a to 4e, PAM scores appeared to
be higher at the12 month period in both treatment and the control groups.
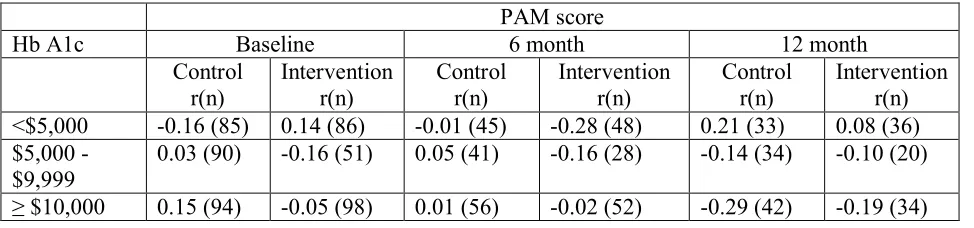
In order to understand the association between DES score and HbA1c and PAM score and
HbA1c, Pearson’s correlations were utilized to determine the degree of association of these variables
at the baseline, 6 month and 12 month intervention periods. The sample was also stratified by age,
gender, income and educational attainment to assess confounding and effect modification. A seen in
Table 5a, a negative association between DES score and HbA1c was found in the intervention group
at the 6 month period of intervention at p < 0.05 level (r (132) = -0.21, p = 0.014) but there was no
other significant association in the other groups. As seen in Table 5b, a negative association between
DES score and HbA1c was found in the intervention group age more than or equal to 65 at the 6
month period of intervention at p < 0.01 level (r (31) = -0.52, p = 0.003) and no other significant
association between DES score and HbA1c was found in any other groups.
As seen in Table 5c, a negative association between DES score and HbA1 was found in the
intervention group female at the 6 month period of intervention at p < 0.01 level (r (89) = -0.31, p =
0.003) but there were no other significant associations in the other groups. As seen in Table 5d, a
negative association between DES score and HbA1c was found in the control group with income of
$5,000 to $9,999 at the 12 month period at p < 0.05 level (r (34) = -0.42, p = 0.015) but there were
no other significant association between DES score and HbA1c in any other groups.
As seen in Table 5e, a negative association between DES score and HbA1c was found in the