6597
MULTI-OBJECTIVE GENETIC ALGORITHMS FOR THE
GREEN VEHICLE ROUTING PROBLEM: A COMPARATIVE
STUDY
1JABER JEMAI, 2MANEL ZEKRI, 3KHALED MELLOULI 1Information Systems Department, Prince Sultan University, Saudi Arabia
2,3LARODEC Lab, High Institute of Management, Tunisia
E-mail: 1[email protected], 2[email protected], 3[email protected]
ABSTRACT
The Green Vehicle Routing Problem (GVRP) is an extension of the standard VRP taking into account the awareness of companies and governments of the dangerous effect of gases emissions. The primary objective of the GVRP is to minimize the volume of emitted carbon dioxide (co2) in adding to the optimization of the traveled distance and other functional objectives. In this paper, we model the GVRP as a bi-objective optimization problem for which many solving algorithms can be adapted and applied including deferent variants and extensions of Multi-Objective Genetic Algorithms (MOGAs). We select three elitist MOGAs: Non-dominated Sorting Genetic Algorithm II (NSGA-II), Strength Pareto Evolutionary Algorithm - II (SPEA-II) and the Indicator-Based Evolutionary Algorithm (IBEA) to evaluate the quality of the returned Pareto fronts using deferent metrics: computation time, traveled distance, emissions volume, generational distance, spacing, entropy, and contribution. The comparison is performed on a set of standard benchmark problems. The experimental results show that IBEA outperforms other algorithms over many metrics.
Keywords: Green Supply Chain, Green Multi-Objective VRP, Multi-Objective Genetic Algorithms
1. INTRODUCTION
The green supply chain management concept has emerged following the increasing awareness of people, governments and Non-Governmental Organizations (NGO) about the threatening effect of co2 emissions. By definition, a supply chain is a network of suppliers, manufacturers, warehouses and distribution channels organized to acquire raw materials, convert them into finished products and distribute them to clients. The concept of green supply has been launched by several logistics companies to reduce carbon dioxide emissions caused by transportation operations. The co2 is a global pollutant, it represents a greater threat to the global environment since it affects the air in wide areas. co2 is present in the atmosphere in significant quantities, representing 99.4 % of the six greenhouse gasses by tonnage [4]. Carbon dioxide is released from industrial processes, waste collection and transportation. Transportation companies have devoted significant efforts to upgrade and improve their transportation systems by developing strategies and policies to route their fleet of vehicles safely with minimized emissions.
Emissions minimization in logistics operations passes through the integration of co2 emission in optimization models [34]. The main transportation model is the VRP that consists of minimizing routing costs in terms of distance, time, number of vehicles, etc. In the context of green logistics, vehicles routing strategies consider minimizing the volume of emitted co2 as a primary objective in adding to VRP classical objectives. The emitted co2 volumes are estimated using two different types of models namely the macroscopic and the microscopic model depending on the considered variables like the speed, road gradient, traffic congestion, etc. [4]. Optimization models have integrated such emission estimation functions as objectives or constraints [29].
6598 Obviously, emissions minimization should be considered with other functional objectives like distance, time and number of vehicles minimization which will lead to a multi-objective optimization problem. The Multi-Objective Green VRP (M-GVRP) is then defined to represent a class of environment aware multi-objective optimization problems.
As a Multi-Objective Optimization Problems (MOOP), the solution of the bi-objective GVRP is a non-dominated solution from an optimal Pareto front [8]. Elitist multi-objective genetic algorithms represents a class of efficient solvers of MOOPs. They apply some sorting strategies to preserve best solutions and use them in future genetic combinations and future populations. In this paper, we present the results of an empirical study to evaluate the potential of multi-objective genetic algorithms for solving the bi-objective GVRP. We implemented three evolutionary algorithms namely NSGAII, SPEA-II and IBEA to solve the bi-objective GVRP. The selected algorithms were applied to solve 4 known benchmark problems and the generated Pareto fronts are then compared using different metrics. The initial comparisons are made on the computation time, the volume of emitted co2 and the total traveled distance. Deep analysis on the quality of the returned Pareto fronts is then performed using specific metrics namely generational distance, spacing, entropy, and contribution. The objective of the paper is to show and prove the effectiveness of modeling the GVRP as a bi-objective optimization problem and to experimentally determine the most appropriate evolutionary algorithm for solving the bi-objective GVRP.
The paper is organized as follows. In the next section, we review the literature on green routing models, solving strategies and real life applications. In Section 3, we define formally the bi-objective GVRP and present a mathematical formulation. The following section is devoted to the candidate algorithms, we survey the main MOGAs and justify the choice of the three elitist algorithms and present their algorithmic schemas. Section 5 reports the results of the comparative study. We present initially, the comparison framework, followed by the experimentation environment and then the comparison results based on the defined metrics. Deeper statistical analysis is reported to strengthen the findings of this paper. Finally, we present the outcomes of this project with concluding remarks.
2. THE GREEN VEHICLE ROUTING PROBLRM: LITERATURE REVIEW
In green logistics, the main interest is grant to the process of carrying the transportation, warehousing, and manufacturing activities without affecting the environment. The transportation is one of the most pollutant activities due to the huge volumes of emitted co2 by moving engines. Recent reviews on green routing problems [4, 6, 10, 22, 26, and 29] present the answers to the requirements of green and sustainable transportation. We present the GVRP literature over its three pillars:
1. Emission factors and fuel consumption estimation models,
2. Routing models including emission requirements and their solving approaches, 3. Real life applications.
2.1 Emission Factors And Fuel Consumption Estimation Models
6599
2.2 Green Routing Models And Solving Approaches
As mentioned in the introduction different problems were introduced to integrate emissions as constraints or objectives. The PRP was introduced by Bektas and Laporte [5] considering additional environmental objectives rather than distance like the amount of green emissions and the consumed fuel following the emission model. The authors study the effect of different parameters such as vehicle load and speed on the environmental objectives. Similarly, Huang et al. [18] studied the green VRP with simultaneous pickups and deliveries by including the fuel consumption and the carbon emission cost. In [11], the authors introduce the green VRP to help organizations to design routes with alternative fuel. In [42], the Fuel Consumption Rate (FCR) was studied and integrated within the classical Capacitated VRP. Figliozzi [14] studied the correlation between the co2 emissions and the level of congestion using an archive of freeway sensors real data. The same author present in [13] some VRP models with emission minimization components. In [12], Faulin et al. integrated also environmental criteria into a capacitated VRP model and solved it.
The proposed GVRP models was solved by different algorithms and approaches ranging from exact methods to heuristics and metaheuristics. We enumerate below the main approaches applied for solving the GVRP per category:
Exact methods including Branch and Bound algorithm, Dynamic Programming [29] and constraint programming [23].
Heuristics like the Modified Clarke and Wright Savings heuristic (MCWS) and Density Based Clustering Algorithm (DBCA) of Erdogan and Miller-Hooks [11].
Metaheuristics:
Simulated annealing [24, 42, 43]
Genetic algorithms [39],
Ant systems [1],
Tabu search [19],
Scatter search [31].
Routing problems with emission components were modeled also as multiobjective problems to integrate the emissions minimization objective along with other functional objectives [20, 27, 32, and 41]. The implemented algorithms are mainly based on genetic algorithms. For instance, the
bi-objective pollution routing problem was studied by Demir et al. [10] considers the emissions and the driving time minimization and was solved by the Adaptive Large Neighborhood Search (ALNS) algorithm.
2.3 GVRP Real Life Applications
From the application side, many real life problems were modeled and solved as GVRP. The very first investigations were summarized in [30] where the authors reported a set of real automotive emissions from Fort McHenry and Tuscarora Mountain tunnels. In [40], Ubeda et al. modeled a real case at Eroski as a green routing problem with backhauls. Bauer et al. [3] studied the greenhouse gas emission minimization in the rail service design problem. Soysal et al. [36] modeled the international beef supply chain considering emissions minimization. Govindan et al. [16] proposed two-echelon multiple vehicle locations of sustainable supply chain network of perishable food. Kuo et al. [25] developed a carbon footprint inventory route planning and selection of hot spot supplier. Konur [23] developed a carbon constrained integrated inventory control and truckload transportation with heterogeneous freight trucks. Apaydin et al. [2] and Tavares et al. [38] studied the emission minimization in the waste collection problem. A real application in timbre transport solved with a three level algorithm by Obersheider et al. [27].
3 THE BI-OBJECTIVE GREEN VRP: FORMAL DEFINITION AND MATHEMATICAL MODEL
Formally, the bi-objective green vehicle routing problem is defined as the problem of designing a set of routes for serving geographically dispersed customers over a transportation network using a fleet of K vehicles. The set of customers is named V augmented with the central depot where vehicles are initially hosted.
The cardinality of the set V is then (n + 1) where n is the number of customers and the depot is indexed to 0. Moreover, to each customer i is associated a demand qi. The transportation network
is noted G(V;E) where E is the set of edges between customers defined by E = {(i; j): i,jϵV; i≠j}. Each two vertices in E are distanced by dij. Vehicles
6600 also to be minimized. To estimate co2 emissions we use the distance based approach defined in [4] as microscopic model and used also in [18] and [42]. The emissions are calculated as follows:
Where µ is the emission rate of the used fuel, a and
b are the coefficients of vehicle fuel consumption and lki is the load of the vehicle k at point i. A route
is then defined as the ordered sequence of customers to be visited by a vehicle k starting and ending at the depot. Each customer must be visited exactly once and the maximum vehicle capacity should be not exceeded. The routing plan should optimize two objectives; the overall traveled distance and the volume of emitted carbon dioxide. A bi-objective non-linear integer programming formulation is given as follows where xij is a binary
decision variable set to 1 if the customer j is visited just after the customer i and to 0 if not. The positive integer variable lki represents the load of the vehicle
k at the customer i. The mathematical model is reported below.
In the objective function (2), the first objective is the estimated volume of emitted carbon dioxide to be minimized and the second objective is the overall traveled distance. The constraint sets (3) and (4) ensure that each customer has to be visited exactly once. Constraint (5) set that the number of used vehicles is at most K and constraint (6) ensure that the number of vehicles leaving and going back to the depot are equal (flow conservation). The initial load (at the depot) of each vehicle is set to the maximum capacity Q (constraints 7) and the load lkj of vehicle k is decreased by the demand qi
after leaving the customer i to visit customer j
(constraints 8). Constraints 8 ensures also sub-tour breaking. In constraint (9), circular paths are avoided between the same two customers. Decision
variables xij are defined to be binary in constraint
(10) and lki should be positive integers in constraint
(11).
4 MULTIOBJECTIVE GENETIC ALGORITHMS
Genetic Algorithms (GAs) are stochastic and evolutionary optimization algorithms based on mechanisms of natural selection and genetics. The basic GA starts by generating a population of solutions and then apply iteratively as set of genetic operators (crossover, mutation, selection, etc.) until a stopping condition is met (finite number of iterations, no significant improvement of best solutions, etc.). Multi-objective GAs are adapted to the concept of Pareto dominance, which emphasizes on solutions satisfying all objectives. Multi-objective GAs are well suited for the search of Pareto front for their implicit parallelism to search over many good solutions at a time. The first multi-objective GA, called Vector Evaluated Genetic Algorithms (VEGA), was proposed by Schaffer et al. [35]. Afterward, several major multi-objective GA were developed such as Multi-Objective Genetic Algorithm (MOGA) [15], NSGA (Non-Dominated Sorting Genetic Algorithm) [37], NPGA (Niched Pareto Genetic Algorithm) [17], SPEA-II (Strength Pareto Evolutionary Algorithm) [44], PAES (Pareto Archived Evolution Strategy) [21], PESA (Pareto Envelope Based Selection Algorithm) [21], PESA-II [21], NSGA-II [9] and MICRO-GA (Micro-Genetic Algorithm) [7].
6601 indicators where a function I assigns to each Pareto set a real value reflecting its quality that should be maximized [45]. The main advantage of the indicator concept is that no additional diversity preservation mechanisms are required. Since the principle is simple and the number of parameters is small, IBEA could be adapted to other types of problem approaches. It is for the above reasons that we selected the NSGA-II, IBEA, and SPEA-II for solving the bi-objective GVRP. Next subsections detail their algorithmic schemas.
4.1 Non-dominated Sorting Genetic Algorithm-II
This technique was proposed by Deb et al. [9]. In NSGAII, the child population Q(t) is first created from the parent population P(t) (randomly filled). They are then met into a set R(t)=P(t)ᵁQ(t) that is sorted according to the principle of dominance: All no dominated solutions of the population are assigned a fitness value 1 (first front), then they are removed from the population. All non-dominated solutions of the population are assigned a fitness value 2 (second front), then they are removed from the population. This process is iterated until all solutions are evaluated. To select subsets that will be placed in the population, a measure of the density of solutions in the space of criteria called crowding distance is used (Algorithm 2). The Pseudo Code of the NSGA-II is shown in algorithm 1.
4.2 Strength Pareto Evolutionary Algorithm-II
SPEA-II [44] is an extension of the SPEA algorithm, where an affectation strategy of improved fitness values is proposed. SPEA-II manages intrinsically an internal archive of fixed size containing enough non dominated individuals, the archive is complemented by those dominated. The calculation of performance in SPEA-II considers the density of solutions. First, the value of Strength Si is calculated for any solution i,
preliminary performance Ri (row fitness) is defined
as the sum of values of the strength of solutions that dominate i. Further, a preservation strategy of diversity based on a technique of kth nearest
6602
4.3 Indicator Based Evolutionary Algorithm
It is a method based on a quality indicator I. The principle of IBEA [45] is to define initially the purpose of optimization, by establishing an operator of performance, and to use it directly in the selection process of the evolutionary algorithm. This one being chosen depending on the preference of the decision maker. Among the possible binary indicators, we can cite in particular the calculation of hyper-area (IH) and Iɛ. IBEA algorithm is shown
in Algorithm 4.
5 COMPARATIVE STUDY
The objective of this paper is to determine which algorithm among NSGA-II, SPEA-II and IBEA can provide better solutions for the bi-objective GVRP. The algorithms are implemented and applied to solve bi-objective GVRP benchmark problems and compared using the following criteria:
• Computation time required to return the final Pareto front for each algorithm per benchmark problem.
• The total volume of emitted co 2 (1st objective). • The total traveled distance (2nd objective). • Generational Distance (GD) which measures how far from the Pareto front is located a set of solutions.
• Spacing (S) metric to measure the distribution uniformity of points of the set of the solutions in the plan (1st objective, 2nd objective).
• Entropy (E) metric that uses the concept of a niche to evaluate the distribution of solutions on the front.
• Contribution (C) that compares two Pareto fronts A and B. If C(A,B)=0 then B is better than
A.
5.1 Implementation Environment and Benchmarks
The three algorithms were implemented under ParadisEO-MOEO framework. We use the statistical software R to perform the hypothesis
testing. Computational runs were performed on an Intel(R) Core™ 2 Duo CPU T7250 (2×2.00 GHz) machine, with 2 Go of RAM. The performance of the metaheuristics has been tested on 4 different instances token from the VRPLIB [28]. These instances involve between 16 and 500 nodes. The number at the end of an instance’ name represents the number of vehicles for the instance under consideration while the number at the first represents the number of customers. The stopping condition of all methods tested is a maximum number of generations. The results presented below are based on the following GA parameters: the population size is 100, the maximum number of generations is 100, the crossover probability is
0.25, the mutation probability is 0.35, and the IBEA scaling factor kappa=0.05.
5.2 Comparison Results
Below, we present the results of the comparative study.
6603 The time consumed by each algorithm is a function of its complexity and the size of the problem being solved. Ordered by complexity, the IBEA has a complexity on O(N2) where N is the population
size. Second, the SPEA-II with a complexity on
O(M2logM) where M is the sum of the size of the
main population and the archive population. Third, the NSGA-II with a complexity on O(MN2) with M
is the number of objectives and N is the size of the population. It is obvious to see that the time required by IBEA is always around half of that needed by NSGA-II. Moreover, the computation time needed by SPEA-II is better than the time of NSGA-II but worse than IBEA due to the logarithmic multiplier. These observations are empirically confirmed by the computation times (in seconds) reported in Figure 1.
Figure 1: Computation time per problem (s)
2. Emissions and travelled distance:
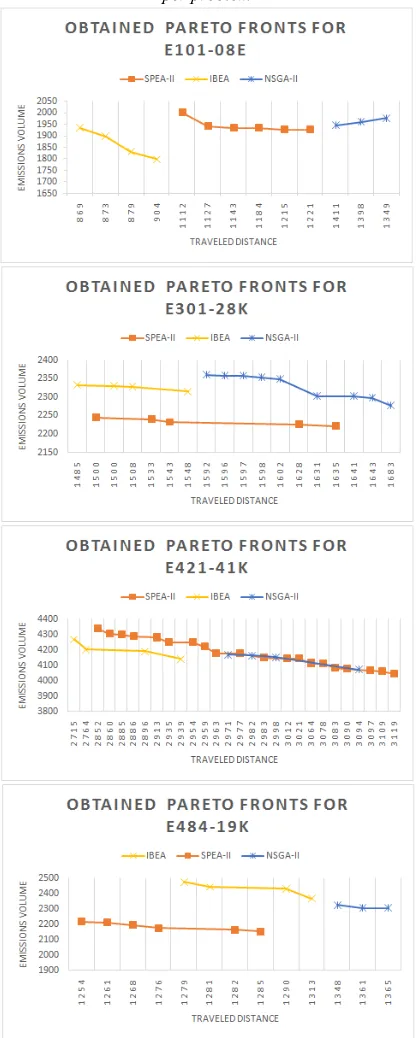
[image:7.612.314.522.112.631.2]The initial trivial observation from the returned Pareto fronts is their small cardinality. This fact can be explained by the correlation between the objectives. For instance, the emission objective is written as a function of the distance objective (Equation 1). From another side, we can see for the four instances, that obtaining solutions with minimal distance do not imply minimal emissions. For example, the minimum emission for the instance E101-08E is 1928 with a distance of 1221. However, the best distance for the same instance is obtained Pareto front is 1112 with 2001 emitted co2. As plotted in Figure 2, it is important to see that the Pareto fronts of IBEA are located in the bottom left corner of the graph for instances E101-08E and E421-41K which means that IBEA solutions are better than those returned by SPEA-II and NSGA-II for such problems. However, for instances E301-28K and E484-19K, SPEA-II returns better Pareto fronts than those of IBEA and NSGA-II. It is important to mention also that the solutions returned by NSGA-II are always worse than those of IBEA and SPEA-II.
Figure 2: The generated Pareto fronts by each algorithm per problem
5.3 Statistical Analysis
6604 distribution, we found that it’s a normal distribution. Consequently, we used a two-factor analysis of variance (ANOVA) test which is based on the central assumption of normally data distribution to check whether a factor has a significant effect on the performance of the algorithm. In our case, the experiments and algorithm are taken as a factor and the metrics are taken as dependents variables. The hypothesis is:
H0: µ1=µ2=µ3=µ4 Versus H1: µi=µj
With i,j € {1,2,3,4} and i≠j
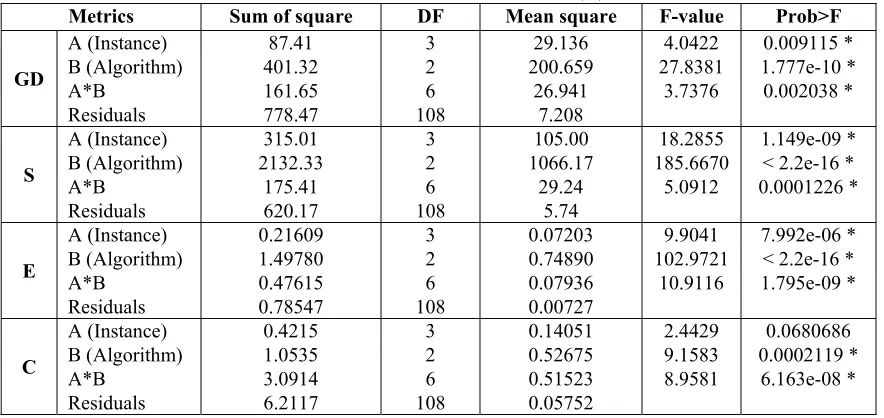
Table 2 shows the ANOVA results for metrics GD, S, E and C. The ANOVA for metric GD, S, E and C found significant differences (p-value < 0.05). In fact, the linear effect of the instance and algorithm are significant. Moreover, the intersection of the instance and algorithm are significant. Hence, the effect of the factors experiment and algorithm influence the variables of measures of performance and consequently, we conclude that there is a significant difference among the three algorithms.
TABLE 2:ANOVATABLE FOR METRICS GD,S,E AND C.
*give significant effect (0.05)
To meaningfully compare the algorithms, we performed the hypothesis test of Wilcoxon which is a nonparametric test that makes no assumptions about the distribution of variables. For the metrics GD, S, and E, we made a right-sided test. The test is as follows:
H0: no difference between the algorithms (µ1=µ2)
H1: The values of sample 1 are generally higher
than that of sample 2 (µ1>µ2)
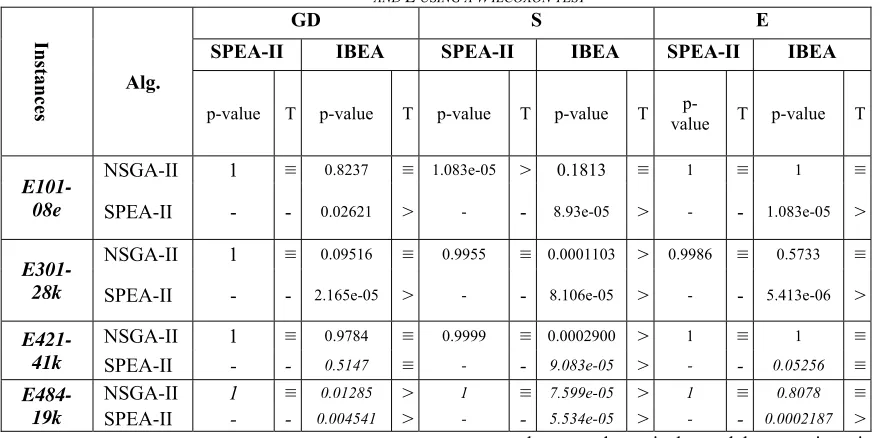
In Table 3, the T column indicates the result of the statistical test for a p-value less than 5 percent: For each instance whether the algorithm located on a column dominates significantly the algorithm on a given line (>) whether there is no difference (≡). According to the GD metric, the IBEA algorithm is significantly more efficient than NSGA-II and
SPEA for all instances except for instance E421.41K. For the S metric, we found that there is no significant difference between IBEA and NSGA-II for the instance E101-08E. Similarly, there is no difference between SPEA-II and NSGA- II for instances E301-28K, E421-41K, and E484-19K. However, we note that the IBEA algorithm is more efficient for all instances except for E101-08E. For the metric E, the IBEA algorithm is more efficient than SPEA-II for the four instances. However, there is no significant difference between IBEA and NSGA-II. The contribution metric is used to compare two Pareto fronts A and B of 2 different algorithms. Indeed, if C(A, B) = 0 then B is better than A. We realized a Wilcoxon test to determine the best algorithm. The test is as follows:
H0: no difference between 2 algorithms (µ1=µ2=0)
H1: Algorithm 2 is better than Algorithm 1 (µ1≠µ2)
Metrics Sum of square DF Mean square F-value Prob>F
GD
A (Instance) 87.41 3 29.136 4.0422 0.009115 *
B (Algorithm) 401.32 2 200.659 27.8381 1.777e-10 *
A*B 161.65 6 26.941 3.7376 0.002038 *
Residuals 778.47 108 7.208
S
A (Instance) 315.01 3 105.00 18.2855 1.149e-09 *
B (Algorithm) 2132.33 2 1066.17 185.6670 < 2.2e-16 *
A*B 175.41 6 29.24 5.0912 0.0001226 *
Residuals 620.17 108 5.74
E
A (Instance) 0.21609 3 0.07203 9.9041 7.992e-06 *
B (Algorithm) 1.49780 2 0.74890 102.9721 < 2.2e-16 *
A*B 0.47615 6 0.07936 10.9116 1.795e-09 *
Residuals 0.78547 108 0.00727
C
A (Instance) 0.4215 3 0.14051 2.4429 0.0680686
B (Algorithm) 1.0535 2 0.52675 9.1583 0.0002119 *
A*B 3.0914 6 0.51523 8.9581 6.163e-08 *
[image:8.612.84.526.252.461.2]6605
TABLE 3:COMPARISON OF THE THREE ALGORITHMS ACCORDING TO THE METRICS GD,S
AND E USING A WILCOXON TEST
Table 4 shows that there is no difference between NSGA-II and IBEA. However, NSGA-II and IBEA are better than SPEA-II.
TABLE 4:COMPARISON OF THE THREE ALGORITHMS
ACCORDING TO THE METRIC CONTRIBUTION USING A
WILCOXON TEST.
6 CONCLUSIONS AND PERPSECTIVES
The interest grant to green logistics is growing due to customers, governments and international organizations pressure on transportation companies to implement eco-friendly operations. Reducing co2 emissions starts to be the key performance indicator of transportation policies. In this paper, we define the green bi-objective vehicle routing problem with the co2 emission minimization as primary objective along with the overall traveled distance. We developed a synthesis of the GVRP literature and
proposed a mathematical model capturing its features. We focused on the performance of multi-objective genetic algorithms to solve the green bi-objective GVRP and implemented three elitist MOGAs namely: NSGA-II, SPEA-II, and IBEA and applied them to solve bi-objective GVRP benchmark problems. The obtained results are evaluated using different specific metrics. The performed evaluations are strengthened by advanced statistical analysis and show that the IBEA algorithms outperform NSGA-II and SPEA-II.
REFRENCES:
[1] B. I. Adiba, M. H, H. A. Ahmed, K. Ahmed, C. Dalila, S. Priya, C. ARUN, S. Sabri, I. Mahamod, and H. Rosilah. A hybrid ant colony system for green capacitated vehicle routing problem in sustainable transport. Journal of Theoretical and Applied Information Technology, 54(2), 2013.
[2] O. Apaydin and M. T. Gonullu. Emission control with route optimization in solid waste collection process: A case study. Sadhana, 33(2):71–82, Apr. 2008.
[3] J. Bauer, T. Bekta¸ s, and T. G. Crainic. Minimizing greenhouse gas emissions in intermodal freight transport: an application to rail service design. Journal of the Operational Research Society, 61(3):530–542, Sep. 2010. [4] T. Bekta¸ s, E. Demir, and G. Laporte. Green
vehicle routing. In Green Transportation Logistics, pages 243–265. Springer, 2016.
Instances
Alg.
GD S E
SPEA-II IBEA SPEA-II IBEA SPEA-II IBEA
p-value T p-value T p-value T p-value T value p- T p-value T
E101-08e
NSGA-II 1 ≡ 0.8237 ≡ 1.083e-05 > 0.1813 ≡ 1 ≡ 1 ≡
SPEA-II - - 0.02621 > - - 8.93e-05 > - - 1.083e-05 >
E301-28k
NSGA-II 1 ≡ 0.09516 ≡ 0.9955 ≡ 0.0001103 > 0.9986 ≡ 0.5733 ≡
SPEA-II - - 2.165e-05 > - - 8.106e-05 > - - 5.413e-06 >
E421-41k
NSGA-II 1 ≡ 0.9784 ≡ 0.9999 ≡ 0.0002900 > 1 ≡ 1 ≡
SPEA-II - - 0.5147 ≡ - - 9.083e-05 > - - 0.05256 ≡
E484-19k
NSGA-II 1 ≡ 0.01285 > 1 ≡ 7.599e-05 > 1 ≡ 0.8078 ≡
SPEA-II - - 0.004541 > - - 5.534e-05 > - - 0.0002187 >
Instances Alg
orithm
s
SPEA-II IBEA
p-value T p-value T
E101-08e
NSGA-II 0.009152 > 1 ≡
SPEA-II 0.00714 > - >
E301-28k
NSGA-II 0.009152 > 0.005889 ≡ SPEA-II 0.001953 > - >
E421-41k
NSGA-II 0.001953 > 0.001953 ≡
SPEA-II 0.001953 > - ≡
E484-19k
NSGA-II 0.01379 > 0.008551 >
[image:9.612.84.524.111.330.2] [image:9.612.84.299.408.594.2]6606 [5] T. Bekta¸ s and G. Laporte. The
pollution-routing problem. Transportation Research Part B: Methodological, 45(8):1232–1250, Sep. 2011.
[6] P. Boulter, I. S. McCrae, and T. J. Barlow. A review of instantaneous emission models for road vehicles. TRL Limited, 2007.
[7] C. A. C. C. Coelho and G. T. Pulido. A micro-genetic algorithm for multi-objective optimization. In Evolutionary multi-criterion optimization, pages 126–140. Springer, Springer Nature, 2001.
[8] C. C. Coelho, G. B. Lamont, and D. A. Van Veldhuizen. Evolutionary algorithms for solving multi-objective problems. Springer Science & Business Media, 2007.
[9] K. Deb, S. Agrawal, A. Pratap, and T. Meyarivan. A fast elitist non-dominated sorting genetic algorithm for multi-objective optimization: NSGA-II. Lecture notes in computer science, 1917:849–858, 2000.
[10] E. Demir, T. Bekta¸ s, and G. Laporte. A review of recent research on green road freight transportation. European Journal of Operational Research, 237(3):775–793, Sep. 2014.
[11] S. Erdogan and E. Miller-Hooks. A green vehicle routing problem. Transportation Research Part E: Logistics and Transportation Review, 48(1):100–114, Jan. 2012.
[12] J. Faulin, A. Juan, F. Lera, and S. Grasman. Solving the capacitated vehicle routing problem with environmental criteria based on real estimations in road transportation: a case study. Procedia-Social and Behavioral Sciences, 20:323–334, 2011.
[13] M. Figliozzi. Vehicle routing problem for emissions minimization. Transportation Research Record: Journal of the Transportation Research Board, 2197(2197):1–7, Dec. 2010. [14] M. A. Figliozzi. The impacts of congestion on
time-definitive urban freight distribution networks co 2 emission levels: Results from a case study in Portland, Oregon. Transportation Research Part C: Emerging Technologies, 19(5):766–778, Aug. 2011.
[15] C. M. Fonseca, P. J. Fleming, et al. Genetic algorithms for multiobjective optimization: Formulation discussion and generalization. In ICGA, volume 93, pages 416–423. Citeseer, 1993.
[16] K. Govindan, A. Jafarian, R. Khodaverdi, and K. Devika. Two-echelon multiple-vehicle location–routing problem with time windows for optimization of sustainable supply chain network of perishable food. International Journal of Production Economics, 152:9–28, Jun. 2014.
[17] J. Horn, N. Nafpliotis, and D. E. Goldberg. A niched Pareto genetic algorithm for multiobjective optimization. In Evolutionary Computation, 1994. IEEE World Congress on Computational Intelligence, Proceedings of the First IEEE Conference on, pages 82–87. IEEE, Institute of Electrical and Electronics Engineers (IEEE), 1994.
[18] Y. Huang, C. Shi, L. Zhao, and T. Van Woensel. A study on carbon reduction in the vehicle routing problem with simultaneous pickups and deliveries. In Service Operations and Logistics, and Informatics (SOLI), 2012 IEEE International Conference on, pages 302– 307. IEEE, Institute of Electrical and Electronics Engineers (IEEE), July 2012. [19] O. Jabali, T. Woensel, and A. de Kok. Analysis
of travel times and co2 emissions in time-dependent vehicle routing. Production and Operations Management, 21(6):1060–1074, Apr. 2012.
[20] J. Jemai, M. Zekri, and K. Mellouli. An NSGA-II algorithm for the green vehicle routing problem. In Evolutionary computation in combinatorial optimization, pages 37–48. Springer, 2012.
[21] J. D. Knowles and D. W. Corne. Approximating the non-dominated front using the Pareto archived evolution strategy. Evolutionary computation, 8(2):149–172, Jun. 2000.
[22] C. Koc¸ c and I. Karaoglan. The green vehicle routing problem: A heuristic based exact solution approach. Applied Soft Computing, 39:154–164, Feb. 2016.
[23] D. Konur. Carbon constrained integrated inventory control and truckload transportation with heterogeneous freight trucks. International Journal of Production Economics, 153:268–279, July 2014.
6607 [25] T. C. Kuo, G. Y.-H. Chen, M. L. Wang, and M.
W. Ho. Carbon footprint inventory route planning and selection of hot spot suppliers. International Journal of Production Economics, 150:125–139, Apr. 2014.
[26] C. Lin, K. L. Choy, G. T. Ho, S. Chung, and H. Lam. Survey of green vehicle routing problem: Past and future trends. Expert Systems with Applications, 41(4):1118–1138, mar 2014. [27] M. Oberscheider, J. Zazgornik, C. B.
Henriksen, M. Gronalt, and P. Hirsch. Minimizing driving times and greenhouse gas emissions in timber transport with a near-exact solution approach. Scandinavian Journal of Forest Research, 28(5):493–506, July 2013. [28] U. U. of Bologna. A vehicle routing problem
library, 2015.
[29] Y. Park and J. Chae. A review of the solution approaches used in recent G-VRP (green vehicle routing problem). International Journal of Advanced Logistics, 3(1-2):27–37, may 2014.
[30] W. R. Pierson, A. W. Gertler, N. F. Robinson, J. C. Sagebiel, B. Zielinska, G. A. Bishop, D. H. Stedman, R. B. Zweidinger, and W. D. Ray. Real-world automotive emissions summary of studies in the fort machinery and Tuscarora mountain tunnels. Atmospheric Environment, 30(12):2233–2256, Jun. 1996.
[31] L. Pradenas, B. Oportus, and V. Parada, Mitigation of greenhouse gas emissions in vehicle routing problems with backhauling. Expert Systems with Applications, 40(8):2985– 2991, Jun. 2013.
[32] W. Rao and C. Jin. A model of vehicle routing problem minimizing energy consumption in urban environment. In 2012 Asian conference of management science and Applications. Proceedings, pages 21–29, 2012.
[33] G. K. Saharidis. Environmental externalities score: a new emission factor to model green vehicle routing problem. Energy Systems, pages 1–19, Apr. 2015.
[34] A. Sbihi and R. W. Eglese. Combinatorial optimization and green logistics. 4OR, 5(2):99– 116, Jun. 2007.
[35] J. D. Schaffer. Multiple objective optimization with vector evaluated genetic algorithms. In Proceedings of the 1st International Conference on Genetic Algorithms, Pittsburgh, PA, USA, July 1985, pages 93–100, 1985.
[36] M. Soysal, J. Bloemhof-Ruwaard, and J. Van der Vorst. Modelling food logistics networks with emission considerations: The case of an international beef supply chain. International Journal of Production Economics, 152:57–70, Jun. 2014.
[37] N. Srinivas and K. Deb. Muiltiobjective optimization using non-dominated sorting in genetic algorithms. Evolutionary computation, 2(3):221–248, Sep. 1994.
[38] G. Tavares, Z. Zsigraiova, V. Semiao, and M. d. G. Carvalho. Optimization of MSW collection routes for minimum fuel consumption using 3D GIS modelling. Waste Management, 29(3):1176–1185, mar 2009.
[39] A. Tiwari and P.-C. Chang. A block recombination approach to solve green vehicle routing problem. International Journal of Production Economics, 164:379–387, Jun. 2015.
[40] S. Ubeda, F. Arcelus, and J. Faulin. Green logistics at EROSOKI: A case study. International Journal of Production Economics, 131(1):44–51, may 2011.
[41] N. Urquhart, C. Scott, and E. Hart. Using an evolutionary algorithm to discover low co2 tours within a travelling salesman problem. In Applications of Evolutionary Computation, pages 421–430. Springer, 2010.
[42] Y. Xiao, Q. Zhao, I. Kaku, and Y. Xu. Development of a fuel consumption optimization model for the capacitated vehicle routing problem. Computers & Operations Research, 39(7):1419–1431, July 2012.
[43] M. Yasin and F. Y. Vincent. A simulated annealing heuristic for the green vehicle routing problem. In Proceedings of the Institute of Industrial Engineers Asian Conference 2013, pages 1261–1269. Springer, Springer Nature, 2013.
[44] E. Zitzler and S. Künzli. Indicator-based selection in multiobjective search. In Parallel Problem Solving from Nature-PPSN VIII, pages 832–842. Springer, Springer Nature, 2004. [45] E. Zitzler and S. Künzli. Indicator-based