Technology (IJRASET)
Object Shadow Detection and Removal from
Remotely Sensed Images
Atul A. Kolge1, Yogita K. Dubey2 1
M.Tech Student (Dept. Of E&TC), YCCE Nagpur, India
2
Prof. (Dept. Of E&TC), YCCE Nagpur, India
Abstract— In accordance with the characteristics of urban high-resolution color remote sensing images, we put forward an object shadow detection and removal method from remotely sensed images. In object shadow detection method, during image segmentation, shadow features are taken into consideration and after that using statistical feature of the images, suspected shadows are extracted. In our method, first color image is converted to gray image, after that global thresholding process is performed to detect the suspected shadow region. Next to that morphology erosion process is performed, then convolution filtering to elimination of false shadow and finally obtain coarse-shadow map, to classify the input color image into the candidate shadow pixels and the nonshadow pixels. After shadow detection, removal method used to remove shadow region to enhance the shadow images. Finally obtain recovered image. Experiments show that the new method can accurately detect shadows and remove from urban remote sensing images.
Keywords— Color aerial images, convolution filtering, Morphology erosion, Adaptive histogram equalization, Image adjustment, Shadow detection.
I. INTRODUCTION
There are various high spatial resolution satellites like Resource 3, Quick Bird, IKONOS, and GeoEye for the observation of Earth and the speedy development of aerial platforms like unmanned aerial vehicles and airships. In urban areas, surface features are more complex, with a variety of objects and shadows formed by elevated objects such as high buildings, bridges, and trees. This shadow may cause faulty results in the change detection, object classification, image fusion. Detection of shadow is very important in the applications of urban remote sensing images like object recognition, image fusion, object classification and change detection. It is an important research issue to detect shadows for urban aerial images and remove it [1]. To detect shadows of color aerial images, Polidorio et al. [9] considered two properties of shadows, first is highly saturated blue/violet wavelength and second is low luminance.
Using this two shadow properties, the red, green, and blue (RGB) color aerial image is first transformed into the hue, saturation, and intensity (HSI) color model, after that segmentation process is applied to the saturation component and the intensity component to identify shadows [4],[7]. Later, Huang et al. [10] observed that the pixels in a shadow region have large hue value, low blue color value and small difference between green and blue color values. Using this observation, three experimental thresholds are determined to detect shadows in the HSI color image or model [8]. After that Tsai [2] presented an efficient algorithm to detect shadows for color aerial images. The input image can be first transformed into the hue, saturation, and intensity (HSI); hue, saturation, and value (HSV); luma, blue-difference chroma, and red-difference chroma (Y CbCr); hue, chroma, and value (HCV); or luminance, hue, and saturation (YIQ) color models [5-6]. After transformation of invariant color model, Tsai construct the ratio map by calculated the ratio of the hue over the intensity for each pixel and after then global threshold (otsu’s method) of the constructed ratio map is determined to identify shadows. Experimental results show that Tsai’s algorithm has better shadow detection accuracy when compared to the previous works. Also among these invariant color models, Tsai’s algorithm has the best shadow detection performance for the HSI color model. In this paper, a new analysis (algorithm) method is given to detect shadows for color aerial images. First RGB color aerial image is transform to gray image and then applies a global thresholding process using Otsu’s method to create a coarse-shadow map which is used for classifying the input color aerial image into the candidate shadow pixels and the non-shadow pixels. In shadow removal method, select only shadow region and then apply adaptive histogram equalization and image adjustment to enhance contrast of shadow regions. Then apply patch inpainting to obtain proper recovered original image.Under testing images, experimental results show that, the shadow detection accuracy of our new analysis (algorithm) method has better shadow detection accuracy when compared with the Tsai’s (algorithm) method.
II. PASTSHADOWDETECTIONWORKBYTSAI
In this section, we survey the method (algorithm) proposed by Tsai [2]. The flowchart of Tsai’s (algorithm) method is shown in Fig.1. To detect shadows in the color aerial image, Tsai algorithm first transforms the input RGB image into an invariant color image or model, i.e. HSI, HCV, HSV, YIQ, or Y CbCrcolor models. For each pixel, the ratio of the hue over the intensity is obtained to determine whether the pixel is a shadow pixel or not. Among these invariant color models, Tsai’s algorithm has the best shadow detection performance for the HSI model or image.
Fig.1-Tsai’s algorithm flowchart
The following equations transform the RGB color model into the HSI color model or image:
In the HSI model, H components called intensity, I components called hue-equivalent and S components called saturation.by scaling I and H components to the range in [0, 1], we can obtain the intensity-equivalent image Ie and hue-equivalent image He, respectively. The ratio map R is obtain by
Where R (x, y), He (x, y) and Ie (x, y) denote the pixel at position (x, y) of R, the image He, and the image Ie, respectively. In Tsai’s algorithm, the value of R (x, y) is scaled to the range [0, 255] for shadow detection. Then Otsu’s thresholding method is applied on ratio map R to calculate the threshold Twhich can be used for separating all the pixels of R into two classes. Based on threshold T, a shadow map S can be obtained by
1 1 1
3 3 3
6 6 6
1
6 6 3
2 1 2
0 6 6 I R V G V B 1 2 1 1
tan (V ) if V 1
V H
H is undefined
( , ) 1
( , )
( , ) 1
ee
H x y
R x y
I x y
1, ( , ) ( , )
0 ,
R x y T
S x y
O th er w ise
Non-Shadow pixel Input Image
Ratio Map (R)
Otsu Method
Shadow pixel R(x,y)>T
Technology (IJRASET)
III. OURSHADOWDETECTIONALGORITHMIn this section, our new analysis (algorithm) method is presented to detect shadows for color aerial images. The flowchart of our new analysis (algorithm) method is shown in Fig.2. We first transform RGB color image into thegray image and then, global thresholding (Otsu’s method) is used to determine a global threshold T for gray image to constructing the coarse-shadow map. Next to that morphology erosion operator with 5× 5 square structuring elements is applied.
Fig.2- our new analysis based algorithm flowchart.
After that convolution filter is applied to remove noise effect and edge detection without blurring the boundaries between candidate shadow regions and nonshadow regions.
IV. SHADOWREMOVALALGORITHM
In this section, Shadow removal (algorithm) method is presented to remove shadow which is detected by our new shadow detection method. Shadow removal flowchart shown in figure 3. In that shadow map is obtained from shadow detection method and input image is taken. After that selection of shadow region to obtain only shadow image. Applying adaptive histogram equalization and image adjustment on only shadow image to enhance the contrast of image .Next to patch inpainting apply to finally get enhanced shadow image.
Figure 3- Shadow removal flowchart Input Image
Image Transformation
Global Thresholding
Morphology Erosion
Convolution Filtering
Coarse Shadow Map
Shadow map and Input Image
Selection of Shadow Region
Enhance Contrast Using Adaptive Histogram Equalization and Image
Adjustment Only Shadow Image
Patch Inpainting
V. EXPERIMENTALRESULTS
In this section, some experimental results are demonstrated to show the shadow detection accuracy comparison between Tsai’s algorithm and our new analysis algorithm along with shadow removal. All algorithms for shadow detection and removal are executed using MATLAB.
(a) (b) (c)
(d) (e) (f)
Figure 4-(a) Original image.(b) Shadow detection by Tsai’s algorithm. (c) Shadow detection by our new analysis based algorithm.(d) shadow removal(Enhanced shadow image) using adaptive histogram equalization.(e) shadow removal(Enhanced shadow image) using image adjustment.(f) final shadow removal for image(a).
In Figure 4-(a) Show original image, in which shadow is formed on road due to high building on roadside and car in shadow not visible clearly. Shadow detection by tsai’s algorithm shown in Figure 4(b).In that white portion nothing but shadow regions and dark portion is non-shadow regions. Shadow detection by our new analysis based algorithm shown in Figure 4(c).In which white portion is shadow regions and dark portion is non-shadow regions. Image enhancement using adaptive histogram equalization and image adjustment shown in Figure 4(d), 4(e), respectively. Final shadow removal for original image (a) shown in Figure 4(f).
(a) (b) (c)
(d) (e) (f) Shadow map (in white) Shadow map (in white)
[image:5.612.127.480.143.410.2]Technology (IJRASET)
Figure 5-(a) Original image.(b) Shadow detection by Tsai’s algorithm. (c) Shadow detection by our new analysis based algorithm.(d) shadow removal(Enhanced shadow image) using adaptive histogram equalization.(e) shadow removal(Enhanced shadow image) using image adjustment.(f) final shadow removal for image(a).
In Figure 5-(a) Show original image. In which shadow on road due to high building on roadside. Shadow detection by tsai’s algorithm shown in Figure 5(b).In that white portion nothing but shadow regions and dark portion is non-shadow regions. Shadow detection by our new analysis based algorithm shown in Figure 5(c).In which white portion is shadow regions and dark portion is non-shadow regions. Image enhancement using adaptive histogram equalization and image adjustment shown in Figure 5(d), 5(e), respectively. Final shadow removal for original image (a) shown in Figure 5(f). In Figure 5(f) shown that shadow remove and obtain enhanced image, and it improve quality of image.
A. Subjective Evaluation
Figure 6(a)-10(a) show the five testing images, and the corresponding manually interpreted shadow maps, which are used as the ideal shadow maps to evaluate the shadow detection performance, are shown in Figure 6(b)–10(b), respectively. The shadow detection results of the algorithm of Tsai’s algorithm and our proposed algorithm are demonstrated in Figure6(c)–10(c), and Figure6 (d)–10(d), respectively.
(a) (b)
(c) (d)
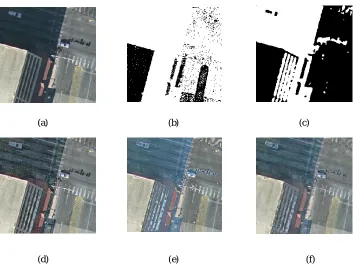
Figure6-(a) Original image. (b) Ideal shadow map. (c) Shadow detection using Tsai’s algorithm. (d)Shadow detection using our based algorithm.
Original image shown in Figure 6(a). Manually interpreted shadow maps, which are used as the ideal shadow maps to evaluate the shadow detection performance, are shown in Figure 6(b).Shadow detection by Tsai’s algorithm shown in Figure 6 (c) and Shadow detection by Our algorithm shown in Figure 6(d).
(a) (b)
Figure7-(a) Original image. (b) Ideal shadow map. (c) Shadow detection using Tsai’s algorithm. (d)Shadow detection using our based algorithm.
(a) (b)
(c) (d)
Figure8-(a) Original image. (b) Ideal shadow map. (c) Shadow detection using Tsai’s algorithm. (d)Shadow detection using our based algorithm.
(a) (b)
(c) (d)
Figure9-(a) Original image. (b) Ideal shadow map. (c) Shadow detection using Tsai’s algorithm. (d)Shadow detection using our based algorith
(a) (b)
Technology (IJRASET)
Figure10-(a) Original image. (b) Ideal shadow map. (c) Shadow detection using Tsai’s algorithm.
(d)Shadow detection using our based algorithm
In five testing images as shown in Figure 6(a)-10(a), it is observed that our proposed algorithm has the best accuracy performance than Tsai’s algorithm and the detection results by our proposed algorithm are close to the ideal shadows marked in Figure 6(b)-10(b), respectively.
B. Objective Evaluation
In this section, three types of accuracy, namely the producer’s accuracy, the user’s accuracy, and the overall accuracy for Tsai’s and our algorithm are used in the objective evaluation. The three types of accuracy are described as follows.The first type of accuracy is the producer’s accuracy, which contains two parameters ηs and ηn, and they are defined by
ηs=TP/(TP+FN)
ηn=TN/(FP+TN)
where true positive (TP) denotes the number of true shadow pixels which are identified correctly; false negative (FN) denotes the number of true shadow pixels which are identified as nonshadow pixels; false positive (FP) denotes the number of nonshadow pixels which are identified as true shadow pixels; and true negative (TN) is the number of nonshadow pixels which
are identified correctly. The parameter ηs (ηn) denotes the ratio of the number of correctly detected true shadow (nonshadow)
pixels over that of total true shadow (nonshadow) pixels. The second type of accuracy is the user’s accuracy in terms of ps and pn, which are defined as
ps=TP/(TP+FP) pn=TN/(TN+FN)
The parameter ps (pn) denotes the ratio of the number of correctly detected true shadow (nonshadow) pixels over that of the total detected true shadow (nonshadow) pixels, and thus, the user’s accuracy can be used to measure the precision of the shadow
detection algorithm. Combining the accuracies of the user and the producer, the third type of accuracy (overall accuracy) τ
defined as follows can be used to evaluate the correctness percentage of the algorithm: τ=(TP+TN)/(TP+TN+FP+FN)
Where TP + TN denote the number of correctly detected true shadow and nonshadow pixels; TP + TN + FP + FN is equal to the number of total pixels in the image.
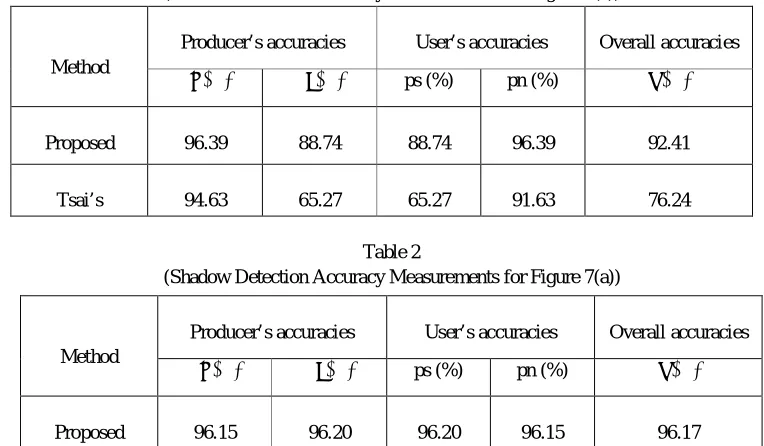
Table 1
(Shadow Detection Accuracy Measurements for Figure 6(a))
Method
Producer’s accuracies User’s accuracies Overall accuracies
ηs (%) ηn(%) ps (%) pn (%) τ (%)
Proposed 96.39 88.74 88.74 96.39 92.41
[image:8.612.110.492.449.672.2]Tsai’s 94.63 65.27 65.27 91.63 76.24
Table 2
(Shadow Detection Accuracy Measurements for Figure 7(a))
Method
Producer’s accuracies User’s accuracies Overall accuracies
ηs (%) ηn(%) ps (%) pn (%) τ (%)
Proposed 96.15 96.20 96.20 96.15 96.17
Table 3
(Shadow Detection Accuracy Measurements for Figure 8(a))
Table 4
(Shadow Detection Accuracy Measurements for Figure 9(a))
Table 5
[image:9.612.92.513.381.719.2](Shadow Detection Accuracy Measurements for Figure 10(a))
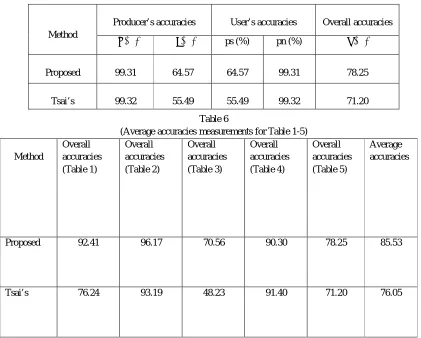
Table 6
(Average accuracies measurements for Table 1-5)
Method
Overall accuracies (Table 1)
Overall accuracies (Table 2)
Overall accuracies (Table 3)
Overall accuracies (Table 4)
Overall accuracies (Table 5)
Average accuracies
Proposed 92.41 96.17 70.56 90.30 78.25 85.53
Tsai’s 76.24 93.19 48.23 91.40 71.20 76.05
Method
Producer’s accuracies User’s accuracies Overall accuracies
ηs (%) ηn(%) ps (%) pn (%) τ (%)
Proposed 99.57 54.65 54.65 99.57 70.56
Tsai’s 99.16 31.87 31.87 99.16 48.23
Method
Producer’s accuracies User’s accuracies Overall accuracies
ηs (%) ηn(%) ps (%) pn (%) τ (%)
Proposed 96.89 84.56 84.56 96.89 90.30
Tsai’s 93.44 89.46 89.46 93.44 91.40
Method
Producer’s accuracies User’s accuracies Overall accuracies
ηs (%) ηn(%) ps (%) pn (%) τ (%)
Proposed 99.31 64.57 64.57 99.31 78.25
Technology (IJRASET)
From the aforementioned three types of accuracy, Table 1-5 show the accuracy comparison between Tsai’s algorithm and our new algorithm for Figure 6(a)-10(a), respectively. Table 6 shown Average accuracies of our proposed and tsai’s algorithm for Table 1-5 shown that accuracy of our new method is better than tsai’s algorithm. Hence overall shadow detection using our new method gives better results than tsai’s.
VI. CONCLUSION
In this paper, our new analysis algorithm has been presented for detecting shadows of color aerial images. RGB color image transform into thegray image and then Otsu’s method is used to determine a global threshold T for gray image to constructing the coarse-shadow map. Experimental results demonstrated that our new analysis algorithm has better shadow detection accuracy when compared with the Tsai’s algorithm.
REFERENCES
[1] K.-L. Chung, Y.-R. Lin, and Y.-H. Huang "Efficient Shadow Detection of Color Aerial Images Based on Successive Thresholding Scheme,” IEEE Transactions On Geoscience And Remote Sensing, Vol. 47, No. 2, February 2009.
[2] V. J. D. Tsai, “A Comparative Study on Shadow Compensation of Color Aerial Images in Invariant Color Models,” IEEE Transactions On Geoscience And Remote Sensing, Vol. 44, No. 6, June 2006.
[3] L. Lorenzi, F. Melgani, and G. Mercier, “A Complete Processing Chain for Shadow Detection and Reconstruction in VHR Images,” IEEE Transactions On Geoscience And Remote Sensing, Vol. 50, No. 9, September 2012.
[4] H. Ma, Q. Qin, and X. Shen, “Shadow segmentation and compensation in high resolution satellite images,” in Proc. IEEE IGARSS, Jul. 2008, vol. 2, pp. 1036–1039.
[5] D. Cai, M. Li, Z. Bao, “Study on shadow detection method on high resolution remote sensing image based on HIS space transformation and NDVI index,” in Proc. 18th Int. Conf. Geoinformat., Jun. 2010, pp. 1–4.
[6] A. Makarau, R. Richter, R. Müller, and P. Reinartz “Adaptive Shadow Detection Using a Blackbody Radiator Model”, IEEE Transactions On Geoscience And Remote Sensing, Vol. 49, No. 6, June 2011.
[7] T. Kim, T. Javzandulam, and T.-Y. Lee, “Semiautomatic reconstruction of building height and footprints from single satellite images,” in Proc. IGARSS, Jul. 2007, vol. 2, pp. 4737–4740.
[8] W. Zhou, G. Huang, A. Troy, and M. L. Cadenasso, “Object-based land cover classification of shaded areas in high spatial resolution imagery of urban areas: A comparison study,” Remote Sens. Env., vol. 113, no. 8, pp. 1769–1777, 2009.
[9] A. M. Polidorio, F. C. Flores, N. N. Imai, A. M. G. Tommaselli, and C. Franco,”Automatic shadow segmentation in aerial color images,” in Proc.XVI Brazilian Symp. Comput. Graph. Image Process.,Oct. 12-15,2003,pp. 270-277.