2017 2nd International Conference on Artificial Intelligence and Engineering Applications (AIEA 2017)
ISBN: 978-1-60595-485-1
A Novel Kinship Verification Method Based on Deep
Transfer Learning and Feature Nonlinear Mapping
YONG YANG and QINGSHAN WU
ABSTRACT
There are some problems when the discriminative features are used in the traditional kinship verification methods, such as focusing on the local region information, containing a lot of noisy in non-face regions and redundant information in overlapping regions, manual parameters setting and high dimension. To solve the above problems, a novel kinship verification method based on deep transfer learning and feature nonlinear mapping is proposed in this paper. Firstly, a new deep learning model trained on the face recognition dataset is transferred to the kinship datasets to extract high-level feature. Secondly, siamese multi-layer perceptrons and triangular similarity metric learning are combined to reduce the dimensionality of feature vector by nonlinear mapping. Meanwhile it would guarantee a smaller distance between kin pairs while a larger distance between non-kin pairs. Lastly, the cosine similarity of feature vector pairs is computed, and traditional classifier, such as SVM, is used. Experiments on the TSKinFace, KinFace W-I and KinFace W-II datasets indicate the proposed method could achieve better performance than the traditional methods.
KEYWORDS
Kinship Verification; Deep Transfer Learning; Feature Nonlinear Mapping; Siamese Multi-Layer Perceptrons; Triangular Similarity Metric Learning.
INTRODUCTION
To our best knowledge, the DNA detection technology has the highest accuracy in verifying the kinship relation. However, it could not be directly used to judge kinship relation in the practical application because of the privacy, money, time and cooperation. Since Fang et al. [1] firstly proposed to solve the task of kinship verification from facial images by computer vision technology, more and more research communities have paid attention on it [2-6]. Kinship verification could be used in mining the human social relation, finding missing children and improving face recognition. Apart from the factors encountered in collecting the facial images, such as illumination, pose and expression, the age gap and gender difference make kinship verification more challenging.
_________________________________________
Yong Yang, [email protected], Qingshan Wu, [email protected]. Chongqing Key Laboratory of Computational and Intelligence, Chongqing University of Posts and Telecommunications, Chongqing 400065, China.
Kinship verification from facial image aims at comparing facial attributes by computer vision technology and finds out the optima pair-wise according to the minimum distance or the maximum similarity. Over the past a few years, the discriminative features used in the existing methods for kinship verification are either level feature [1-3] or mid-level feature [4] or high-level feature [5-6]. The low-level features extracted by hand-crafted descriptors could not avoid the following three problems: firstly, mainly focusing on the local region information instead of the whole structure information in the facial images; secondly, containing a lot of noisy in non-face regions and redundant information in overlapping regions; thirdly, manual parameters setting and high dimension which will makes the training and testing phase computationally inefficient. The mid-level features extracted from the low-level features by discriminative learning still cannot solve the above first and third problems. The high-level features are mainly extracted by deep transfer learning which fails to fully consider the sample distribution difference between domain source and target source. To address these issues, a novel kinship verification method based on deep transfer learning and feature nonlinear mapping is proposed. The method consists of the main three steps:(1) extracting the high-level feature from facial image by deep transfer learning method;(2) reducing the dimensionality of feature vector by feature nonlinear mapping;(3) computing the cosine similarity and classifying them by classifier.
The main contributions of this paper can be stated as follows:(1) a new and compact deep learning model which is learned on the face recognition dataset is transferred to the kinship dataset to extract high-level feature;(2) siamese multi-layer perceptrons and triangular similarity metric learning are combined to reduce the dimensionality of feature vector by nonlinear mapping way, and reduce the distance between kin pairs and increase the distance between non-kin pairs.
THE PROPOSED APPROACH
This section mainly introduces the details of the proposed method which includes the following three steps: feature extraction, feature nonlinear mapping, and similarity metric and classifying.
Feature Extraction
To get the discriminative feature without redundant information from kinship datasets in which each identity has only one facial image, the deep learning method and transfer learning method are combined. The face recognition dataset is chosen as the source domain, and face recognition is the source task; the kinship verification datasets are chosen as the target domain, feature extraction is the target task. The source model, learned on the source domain according to the source task, is transferred to target domain to get target model with the target task.
SOURCE MODEL
2 2 2 2 - -2 - -1 2 1 1 log T yi i T j i s W f m
S n s
W f i j e L m e
∑
∑
(1)Where fi and W represent the L2-normalized features and the L2-normalized
weights matrix respectively, and s is the parameter in the scale layer. The reformed contrastive loss is:
2 2
2 2 - ,
max(0, - - ),
j i i
C
j i i
W f c j L
m W f c j
(2)
Where m is the margin, the Wj can roughly represents the means of features in j-th
class after well-separated by the margin.
The PReLU is chosen as the activation function, and stochastic gradient descent with momentum of 0.99 to update the parameters of network in training phase. The source model is continue trained for 5,000 iterations after it converges.
TARGET MODEL
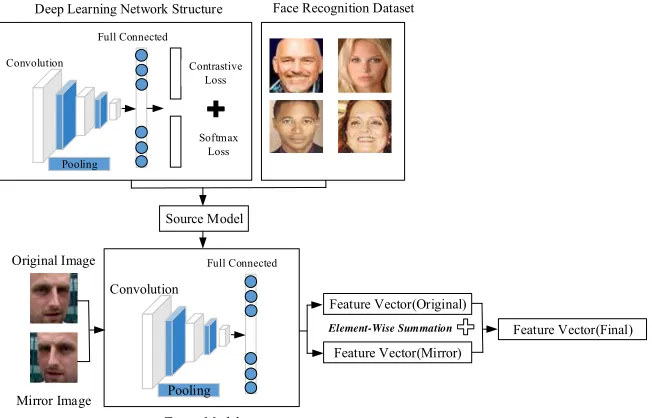
In the source task, the final goal is to classify each sample. However, the goal of the target task is to extract the discriminative feature from target domain. To get the target model, all layers after full connected layer in the source model are deleted, and the parameters and structures between input layer and full connected layer are saved. The detail is shown in Fig.1.
Convolution
Deep Learning Network Structure
Source Model Target Model Feature Vector(Original) Feature Vector(Mirror) Feature Vector(Final) Original Image Mirror Image Element-Wise Summation Full Connected Pooling Softmax Loss Contrastive Loss
Face Recognition Dataset
Full Connected
Convolution
[image:3.612.137.463.447.656.2]Pooling
W1, b1 W2, b2
x1
y1
∙∙∙
∙∙∙
x2
y2
∙∙∙
∙∙∙
Triangular Similarity
Metric
[image:4.612.179.419.51.241.2]Input Layer Hidden Layer Output Layer
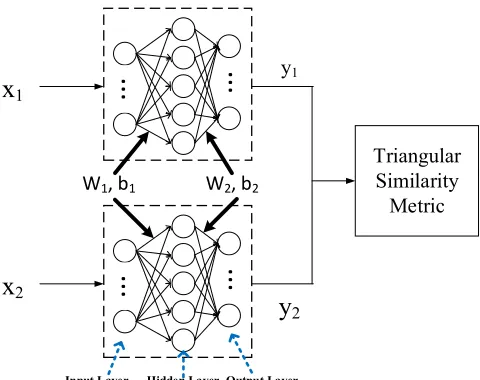
Figure 2. The structure of the SMLP Method.
High-level Feature Extraction
To get the high-level feature, the processing procedure includes the following two steps: firstly, choosing each facial image and its mirror in the target domain as the input of target model, 512-dimension feature vector pair (the original and its mirror) will be got. Secondly, merging each feature vector pair by element-wise summation. The detail is shown in Fig.1.
Feature Nonlinear Mapping
Principal Component Analysis (PCA), which retains the original information as much as possible by a linear projection, is usually adopted to reduce the dimensionality of feature vector in the existing kinship verification task. However, it may cause a problem that the projected data may mix together and are not distinguishing for kinship verification. To solve the above problem, siamese multi-layer perceptrons [9] is adopted to map the feature vector by nonlinear way.
SIAMESE MULTI-LAYER PERCEPTRONS
Where the represents the learning rate (default 0.0001), the P represents W1, b1, W2 and b2 respectively, the P represents the differentials of W1, b1, W2 and b2
respectively which are computed according to the differentials of the loss function.
TRIANGULAR SIMILARITY METRIC LEARNING
Triangular similarity metric learning [10] aims at finding out an optimal mapping space, which make the similarity feature pairs are mapped in the same direction and the dissimilarity feature pairs are mapped in the opposite direction as far as possible, to minimize the distance between similarity pairs and maximize the distance between dissimilarity pairs. The modified triangular similarity metric learning objective function [9] is:
2 2 2
1 2 3
1 1
1 1 1 1
2 2
n n
i i i i
i i
J J y y K y K
n n
(4)Where y3i y1i s yi 2i, the constant K is the average value of all the features, the y1i
and y2i respectively represent the feature after nonlinear mapping, and the si represents the label (1: similarity, -1: dissimilarity). The gradient function of loss function J is:
3 1 3 2
1 2
1 3 3
1 n T T
i i i i i
i i
i i i
y y s y y
J
y K y K
A n y A y A
(5)The loss function J will get the optimal value at the zero gradient: 1 3
3 0 i i i y y K y
and
3 2 3 0 i i i i s y y K y
. With this focus, the similarity feature pairs will be mapped to the same
direction and the dissimilarity feature pairs will be mapped to the opposite direction.
FEATURE NONLINEAR REDUCTION
SIMILARITY METRIC AND CLASSIFYING
The cosine distance is used to measure the similarity of feature vector pair. After computing the similarity of all feature vector pairs, support vector machine (SVM) is used to classify each test sample pair. The cosine distance is computed as:
1 2 1
2 2
1 2
1 1
n
i i
i
n n
i i
i i
y y similarity
y y
(6)Where the y1i and y2i represent the i-th element in the feature vector pair
respectively.
EXPERIMENTS
Datasets and Preprocessing
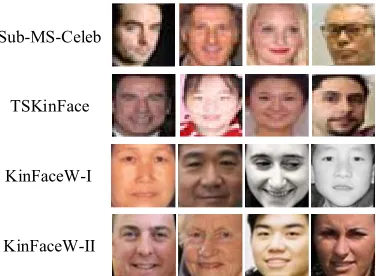
The KinFaceW-I [3], KinFaceW-II [3] and TSKinFace [11] datasets are chosen as the target domain. What their indifferences are: they consist of public figures or celebrities and their parents or their child from the internet, and have four kinds of kin-relation such as Father-Son (FS), Father-Daughter (FD), Mother-Son (MS), and Mother-Daughter (MD), and all images have aligned with 64*64 pixels (see Fig.3). What the difference between them is that each pair of kinship facial images in the first dataset were collected from different photos, while in the latter two datasets were collected from the same photo. For four kinds of kin-relations facial images, there are 156, 134, 116, and 127 pairs in the KinFaceW-I dataset, each kin-relation contains 250 pairs in the KinFaceW-II dataset, and there are 502, 513, 502, and 513 pairs in the TSKinFace dataset.
The Sub-MS-Celeb dataset is rebuilt from MS-Celeb [12] dataset contains 87139 face images from 2589 classes after removing the dirty face images and non-frontal face images, and it is chosen as the source domain. All images are aligned and cropped to 64*64 pixels according to five landmarks: two eyes, nose and mouth corners (see Fig.3).
Sub-MS-Celeb
TSKinFace
KinFaceW-I
[image:6.612.207.395.558.696.2]Comparison with Methods based on Deep Learning
To verify the effective of deep transfer learning (DTL) method, the high-level features extracting from facial images without dimension reduction operation are directly used in the similarity metric and classifying phase. Compared with existing kinship verification methods based on deep learning, a series of experiments are conducted on the KinFaceW-I and KinFaceW-II datasets respectively. The experimental results are shown in Table 1.
As can be seen from the Table 1, the DTL method gets a better accuracy on the KinFaceW-I, but worsens slightly on the KinFaceW-II dataset. What causes of this phenomenon is the sample distribution difference between the source domain and target domain. Compared to the KinFaceW-I dataset, the size of non-face region in facial images from the KinFaceW-II dataset is closer to the source domain. For a same target model, the high-level feature vectors extracted from the KinFaceW-I dataset contain less noisy in non-face regions, while the high-level feature vectors extracted from the KinFaceW-II dataset contain a lot of noisy in non-face regions which influence the similarity metric between feature vector pairs. Generally, the DTL method could be used to extract feature from facial image in the kinship dataset.
Comparison with Other Feature Reduction Methods
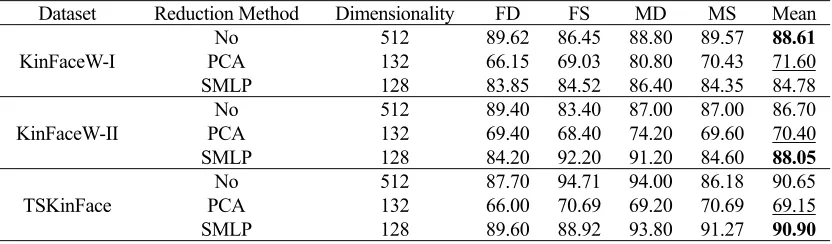
[image:7.612.89.508.476.550.2]To verify the necessity and effective of SMLP method, it is compared against PAC method with 99.5% contribution rate and directly using the high-level feature without feature reduction. A series of experiments are conducted on I, KinFaceW-II, and TSKinFace datasets respectively. The number of the neurons in the hidden layer and output layer in SMLP are empirically set 256,128 respectively. The experimental results are shown in Table 2.
TABLE 1. COMPARISON WITH DEEP LEARNING BASED METHOD (ACCURACY: %).
Method FD FS KinFaceW-I MD MS Mean FD FS KinFaceW-II MD MS Mean
SMCNN [6] 75.00 75.00 72.20 68.70 72.73 79.00 75.00 85.00 78.00 79.25
CNN-Basic [5] 70.80 75.70 79.40 73.40 74.83 79.60 84.90 88.50 88.30 85.33
CNN-Points [5] 71.80 76.10 84.10 78.00 77.50 81.90 89.40 92.40 89.90 88.40
DTL(Ours) 89.62 86.45 88.80 89.57 88.61 89.40 83.40 87.00 87.00 86.70
TABLE 2. COMPARISON WITH DIFFERENT FEATURE REDUCTION METHODS.
Dataset Reduction Method Dimensionality FD FS MD MS Mean
KinFaceW-I
No 512 89.62 86.45 88.80 89.57 88.61
PCA 132 66.15 69.03 80.80 70.43 71.60
SMLP 128 83.85 84.52 86.40 84.35 84.78
KinFaceW-II
No 512 89.40 83.40 87.00 87.00 86.70
PCA 132 69.40 68.40 74.20 69.60 70.40
SMLP 128 84.20 92.20 91.20 84.60 88.05
TSKinFace
No 512 87.70 94.71 94.00 86.18 90.65
PCA 132 66.00 70.69 69.20 70.69 69.15
[image:7.612.90.506.580.702.2]The Table 2 shows that: (1) compared with the method without feature reduction, the PCA method significantly depresses the accuracy on the target domains. What cause is that it may retain a lot of noisy or abandon some important information or mix feature information and destroy the original data structure of feature vector after linear mapping. (2) Compared with the method without feature reduction, the SMLP method improves the performance on the KinFaceW-II and TSKinFace datasets, but worsens slightly on the KinFaceW-I dataset. A probable reason is that the size of non-face region in facial images in the source domain is larger than the KinFaceW-I datasets, which will lead to contain less noisy in the high-level feature. However, the nonlinear dimensionality reduction is excessively emphasized in the process of SMLP training, which will lead to lose some important feature information or destroy original structural information in feature vector. (3) Compared with PCA method, the SMLP method could get a lower dimensional feature vector without reducing the accuracy markedly. So, the SMLP method could be used to reduce the dimensionality of feature vector.
Comparison with State-of-the Art Methods
[image:8.612.92.506.464.573.2]Compared with other state-of-the art methods, the number of the neurons in the hidden layer and output layer in the SMLP are set empirically for each target domain respectively as the following: for KinFaceW-I dataset, setting 256 and 176, for KinFaceW-II dataset, setting 128 and 192, for TSKinFace dataset, setting 96 and 192. The contrast results are shown in Table 3 and Table 4.
TABLE 3. THE ACCURACY OF DIFFERENT METHODS ON THE KINFACEW-I AND KINFACEW-II DATASETS.
Method FD FS KinFaceW-I dataset MD MS Mean FD FS KinFaceW-II dataset MD MS Mean
Polito[16] 85.80 85.30 86.70 87.50 86.30 82.20 84.00 81.20 84.80 83.10
LIRIS[16] 80.63 83.04 84.98 82.30 82.74 83.60 89.40 85.00 86.20 86.05
ULPGC[16] 70.85 71.25 80.89 58.52 70.01 75.80 85.40 81.60 75.60 80.00
BIU[16] 76.48 86.90 79.75 73.89 79.25 80.82 87.51 75.63 79.78 80.94
NUAA[16] 80.64 86.25 83.93 81.03 82.96 81.60 84.40 81.60 82.80 82.50
M-NUAA[11] 85.47 87.84 87.50 86.16 86.74 86.20 88.40 85.20 86.00 86.45
Ours 85.77 86.45 87.20 80.87 85.07 91.40 87.40 91.60 90.80 90.30
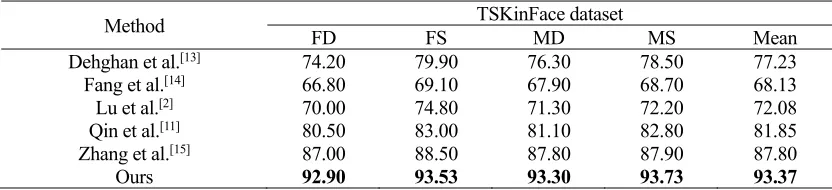
TABLE 4. THE ACCURACY OF DIFFERENT METHODS ON THE TSKINFACE DATASET.
Method FD FS TSKinFace dataset MD MS Mean
Dehghan et al.[13] 74.20 79.90 76.30 78.50 77.23
Fang et al.[14] 66.80 69.10 67.90 68.70 68.13
Lu et al.[2] 70.00 74.80 71.30 72.20 72.08
[image:8.612.89.505.623.718.2]From Table 3 and Table 4, compared with other methods, the proposed method markedly improves the accuracy of kinship verification on the TSKinFace and KinFaceW-II datasets, but worsens on the KinFaceW-I dataset. A probable reason is the sample distribution difference between the source domain and KinFaceW-I dataset which will lead to learn an indiscriminative target model, and the nonlinear dimensionality reduction is excessively emphasized in the process of SMLP training, which will lead to lose some important feature information or destroy original structural information in feature vector. If all original facial images about KinFaceW-I dataset are cropped with standards used on the source domain, and the number of neurons in the hidden layer and output layer are set relatively independently for the subsets from the target domain, the result will be improved remarkably.
CONCLUSION
A novel kinship verification method based on deep transfer learning and feature nonlinear mapping is proposed in this paper. Firstly, it extracts high-level feature by the deep transfer learning method. Then, the siamese multi-layer perceptrons with triangular similarity metric learning are combined to reduce the dimensionality of feature vector by nonlinear mapping way, meanwhile ensure the distance between kin pairs are smaller while larger between non-kin pairs. In the future work, we will consider to create a new kinship recognition dataset which contains different races and colors individuals, and ensure all facial images are collected from natural scenes, and each individual has multiple facial images. Kinship verification will be introduced to improve the reliability of face recognition.
ACKNOWLEDGMENTS
Corresponding author: Yong Yang. [email protected], Chongqing Key Laboratory of Computational and Intelligence, Chongqing University of Posts and Telecommunications, Chongqing 400065, China.
REFERENCES
1. Fang R., Tang K.D., Snavely N., et al. Towards computational models of kinship verification [C]//Image Processing (ICIP), 2010 17th IEEE International Conference on. IEEE, 2010: 1577-1580.
2. Lu J., Zhou X., Tan Y.P., et al. Neighborhood Repulsed Metric Learning for Kinship Verification [J]. IEEE Transactions on Pattern Analysis & Machine Intelligence, 2014, 36(2): 331-345.
3. Yan H., Lu J., Deng W., et al. Discriminative multimetric learning for kinship verification [J]. IEEE Transactions on Information Forensics and Security, 2014, 9(7): 1169-1178.
4. Yan H., Lu J., Zhou X., et al. Prototype-Based Discriminative Feature Learning for Kinship Verification [J]. IEEE Transactions on Systems, Man, and Cybernetics, 2015, 45(11): 2535-2545. 5. Zhang K., Huang Y., Song C., et al. Kinship Verification with Deep Convolutional Neural
Networks [C]// British Machine Vision Conference. 2015: 148.1-148.12.
6. Li L., Feng X., Wu X., et al. Kinship Verification from Faces via Similarity Metric Based Convolutional Neural Network [C]//International Conference Image Analysis and Recognition. Springer International Publishing, 2016: 539-548.
8. Wang F., Xiang X., Cheng J., et al. NormFace: L2 Hypersphere Embedding for Face Verification [J]. 2017.
9. Zheng L., Duffner S., Idrissi K., et al. Siamese multi-layer perceptrons for dimensionality reduction and face identification [J]. Multimedia Tools & Applications, 2016, 75(9): 5055-5073.
10. Zheng L., Idrissi K., Garcia C., et al. Triangular similarity metric learning for face verification [C]//Automatic Face and Gesture Recognition (FG), 2015 11th IEEE International Conference and Workshops on. IEEE, 2015, 1: 1-7.
11. Qin X., Tan X., Chen S. Tri-Subject Kinship Verification: Understanding the Core of A Family [J]. IEEE Transactions on Multimedia, 2015, 17(10): 1855-1867.
12. Guo Y., Zhang L., Hu Y., et al. MS-Celeb-1M: A Dataset and Benchmark for Large-Scale Face
Recognition [C]// European Conference on Computer Vision. Springer, Cham, 2016: 87-102. 13. Dehghan A., Ortiz E.G., Villegas R., et al. Who Do I Look Like? Determining Parent-Offspring
Resemblance via Gated Auto encoders [C]. Computer Vision and Pattern Recognition, 2014: 1757-1764.
14. Fang R., Gallagher A., Chen T., et al. Kinship Classification by Modeling Facial Feature Heredity [M]. 2013.
15. Zhang Z., Chen Y., Saligrama V. Group Membership Prediction [C]// IEEE International Conference on Computer Vision. IEEE, 2016: 3916-3924.