2017 2nd International Conference on Computational Modeling, Simulation and Applied Mathematics (CMSAM 2017) ISBN: 978-1-60595-499-8
Experiment and Simulation Study on A New Structure
of Full Optical Fiber Current Sensor
Dai WAN
*, Heng-yi ZHOU, Fei QI, Miao ZHAO, Xu-jin DUAN and Tao PENG
State Grid Hunan Electric Power Corporation Research Institute, Changsha, 410000, China
*Corresponding author
Keywords: Optical fiber, Current sensor, Faraday rotation effect, Simulation.
Abstract. Optical fiber sensor offers an advantage of non-contact method to measure electric current. The optical fiber current sensor is based on the Faraday rotation effect and is immune from electromagnetic disturbance. In this paper a new structure of full-optical current sensor is designed. Firstly, experimental system has been set up in the laboratory to study the feasibility of the new design. Secondly, the system transmission field could be achieved by simulating the transmittance of light propagating through optical fiber by using the software. Finally, the experimental results are compared with simulation results, and there are discussions around those results. The results obtained from the present work will be useful for further research on the optical fiber current sensor.
Introduction
With the increase of the voltage and current in power system, the traditional electromagnetic current transformer faces adverse condition during the measurements. So the advances in condition monitoring of high voltage electric power systems requires an accurate measurement of electric current. Various methods have been investigated. As a new type of current sensor, optical fiber current sensor has been paid much attention for its unique advantages, such as excellent insulation properties, resistance to electromagnetic interference, no magnetic saturation and ferromagnetic resonance, etc.
The study of optical fiber current sensor stared at 1960s. W. J. Tabor and F. S. Chen formulated the linear birefringence and Faraday rotation effect that exist in magneto-optical materials [1]. From 1980s on, it experienced a critical period of spectacular progress for full optical fiber current sensor study, and particularly in America and Japan. After decade’s study, there are plenty of breakthrough progresses on basic theory of optical fiber current sensor [2-7].
In recent years, the study of full optical fiber current sensor has been focused on the measurement of large current in power system. To extend its application to partial discharge measurements with an optical fiber current sensor, the sensor that can measure very small current should be developed, which is the purpose of this paper.
Experimental
Measurement Principle
According to Faraday rotation effect, Faraday rotation can be expressed by following equation:
VHdl
(1) In the equation (1), V is Verdet constant of the optical fiber; l is the path length of light transmitting along the direction of magnetic field H.
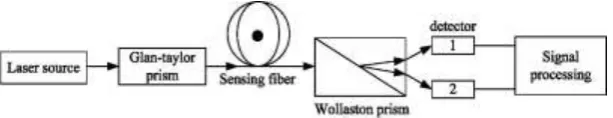
polarized light may be coupled into the input of sensing optical fiber. In the sensing head, polarization plane of the linearly polarized light rotates with test current change. When it transmits through polarization analyzer, emergent light is resolved into two beams of linearly polarized light with their polarization plane orthogonal. And then the two beams of linearly polarized light are received by corresponding photoelectrical detector, where photoelectric conversion occurs. Photocurrent is measured and shown by oscilloscope. And then two signals are fed into computer for further analysis. A schematic arrangement is shown in Fig.1.
Figure 1. Schematic of experiment system.
Experimental System
[image:2.595.194.401.336.496.2]Experimental system is shown in Fig. 2. In order to reduce possible external interferences, the optical system is shielded by metallic camera bellows.
Figure 2. Experimental system.
In the experimental system, laser source is a semiconductor laser unit. Wavelength of the laser output light is 632nm and the output power is 50mW. As indicated in Fig. 2, Glan-Taylor prism is used for polarizer.
In the present research, HP 400/430-37/730E type silica optical fiber has been selected and used for sensing fiber. Its core material is pure quartz, cladding material is fluoro-containing acrylic acid resin, and tight packet layer material is ETFE. Operating temperature of the sensing fiber is between -65oC to 85oC. Its short-term bending radius is 22mm, and long-term bending radius is 47mm, and numerical aperture is 0.37. Attenuation is less than 8.0 dB /km at 850nm wavelength. The light refractive index structure is step index. The core layer diameter is 400 µm, and plastic cladding layer diameter is 430 µm, and tight cladding layer diameter 730 µm. Compared to ordinary single-mode or multimode fiber quartz fiber, it has several advantages such as big core diameter, easy coupling, and easy installation.
Wollaston prism is used for polarization analyzer. The photoelectrical detector is InGaAs-PIN photodiode, which is manufactured by Hamamatsu Company. Product type is G10899-01K. Its inverse peak voltage is 5V, spectral response range is 500~1700nm. Tektronix oscilloscope (DPO3052) is used for observing signals.
resistance is 32. The sensing optical fiber is circled 10 turns through the solenoids central axle, and set up at fixed position.
Figure 3. Solenoids nested sensing head.
Results and Discussions
Measurement Method
Optical axis direction of polarizer is P direction. The two cross-polarization direction of Wollaston prism are E1 and E2 direction. Angular separation between P direction and E1/E2 direction are 45o and
-45o respectively. In Fig. 4, θ is Faraday rotation.
Figure 4. Vector diagram of Wollaston prism.
Suppose I0 is the transmission light intensity of polarizer; I1 and I2 is the light intensity of those two
beams of circularly polarized light that are outputs from Wollaston prism respectively. Assuming there is ignoring the loss of the light path then the followings are valid.
2
1 0 0
1
cos (45 ) (1 sin 2 ) 2
I I I
(2)
2
2 0 0
1
cos (45 ) (1 sin 2 ) 2
I I I
(3) In equation (2) and equation (3), I1 and I2 can be obtained by processing the outputs from the
photodetector. So sin2θ can be calculated by following equation.
1 2
1 2
sin 2 I I I I
(4)
Usually Faraday rotation is very small, i.e. θ<<1, so:
sin 2 2 (5) Therefore Faraday rotation θ can be calculated by measuring I1 and I2. And then testing current I
[image:3.595.242.352.349.457.2]Measuring Results
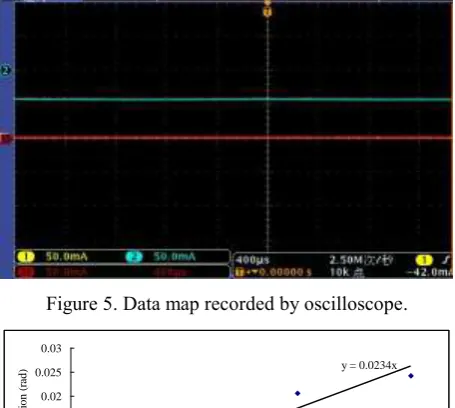
[image:4.595.184.412.168.372.2]Select five test current points. They are 0A, 0.1875A, 0.375A, 0.75A, and 1.125A. As shown in Fig. 5, it is data map recorded by the oscilloscope when test current is zero. Recorded time span is 4ms. And it samples 10k points. Every group is measured for five times and the average value is obtained. When Faraday rotation is plotted versus the applied current a linear relationship is obtained, i.e. θ= 0.0234I, as shown in Fig. 6.
Figure 5. Data map recorded by oscilloscope.
y = 0.0234x
0 0.005 0.01 0.015 0.02 0.025 0.03
0 0.2 0.4 0.6 0.8 1 1.2
current (A)
F
ar
ada
y
rot
at
ion
(
ra
d)
Figure 6. Relationship between Faraday rotation and tested current.
According to Fig. 6, it can be found that linearity of test curve is good and errors of each test point are in allowable range. Deviate are 0, -0.00169, 0.000785, 0.003147, -0.00212 respectively. According to Biot-Savart law, Expression of relationship between Faraday rotation and tested current tally with theoretical formula:
θ=Vn1n2I (6)
Where n1 and n2 is the turns of solenoids and the turns of optical fiber respectively. According to
the actual experimental situation, n1=2000, and n2=10. Verdet constant can be calculated: V=1.17×10⁻⁶ rad/A.
Electromagnetic Field Simulation of Designed Structure
A COMSOL Multiphysics software is used to simulate the sensing system’s electromagnetic field. Electrifying solenoids produce a radial magnetic field inside. Sensing optical fiber passes through those two electrifying solenoids. In our design, those two electrifying solenoids are in parallel and their circular direction must be opposite to achieve a high sensitivity [8].
Figure 7. Solenoids nested sensing head structure.
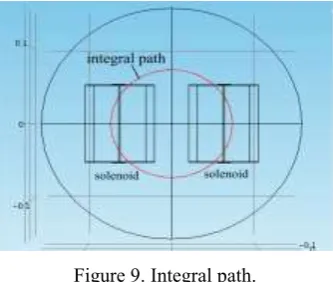
For the solenoids sensing head, the model is simplified as cylindrical structure, and equivalent current density is defined instead. The integral of magnetic field along any closed path through the two solenoids is approximately equal. According to actual situation, the turns of solenoids are
n1=2000. The inner and outer diameter for the solenoid is 30mm and 40mm respectively. When 1 A of
[image:5.595.214.382.335.452.2]current passes through the cable as shown in Fig. 8, the simulation result along the integral path is 2000.02A. So it is close to the result obtained from the theoretical calculation. Fig.9 illustrates the integral path for the calculation.
Figure 8. Magnetic field integral of solenoids nested sensing head structure.
Figure 9. Integral path.
In the references verdet constant of SiO2 is V=4.68×10⁻⁶rad/A [9]. Turns of sensing fiber are n2=10,
so Faraday rotation θ is:
2 0.0936
Vn Hdl
[image:5.595.215.382.477.618.2]y = 0.0936x
0 0.02 0.04 0.06 0.08 0.1 0.12
0 0.2 0.4 0.6 0.8 1 1.2
current (A)
F
ar
ada
y
rot
at
ion
(
ra
[image:6.595.192.419.71.183.2]d)
Figure 10. Simulation result of relationship between Faraday rotation and tested current.
In reference [9] Verdet constant of SiO2 is V=4.68×10⁻⁶rad/A when wavelength is 633nm. The value derived from our experimental result is smaller than theoretical result but they are in the same order of magnitude. The quoted Verdet constant of 4.68×10⁻⁶rad/A is for SiO2 crystal. When drawn glass fiber the crystal structure is destroyed that may reduce its Verdet constant. Furthermore, bending fiber to form winding turns can also lead to the reduction of Verdet constant.
Conclusions
In this paper a new structure of sensing head is designed and its feasibility for measuring small current is studied. Theoretical proof of this structure can extend current measurement range and can be used in smaller current measurement. The simulation based on theory has been verified by experimental result. It is predictable that testing sensitivity can be improved witha better system arrangement.
Verdet constant obtained from experiment is smaller than the one from literature. However, they are in the same order of magnitude. The difference can be attributed to non-crystalline structure of fiber and fiber bending.
Based on the results, the designed structure has advantages of simple structure and easy to realize. Further research will be carried out using this experimental system.
References
[1] W. J. Tabor, R. S. Chen, “Electromagnetic propagation through materials possessing both Faraday rotation and birefringence: experiments with ytterbium orthoferrite”, Appl Phys, Vol. 40, NO. 7, pp. 2760-2765, 1969.
[2] E. A. Ulmer, “High accuracy Faraday measurements”, International Conference on Optical Fiber Sensor, Vol. 21, pp. 1-4, 1988.
[3] P. A. Nicatti, T. P. Rober, “Stabilized current sensor using Sagnac interferometer”, J. Phys. E. Sri. Instrum, vol. 21, pp. 791-796, 1988.
[4] G. Frosio, R. Dandliker. “Reciprocal reflection interferometer of a fiber-optic Faraday current sensor”, APPI. Opt, Vol. 33, NO. 25, pp. 6111-6122, 1994.
[5] J. Blake, P. Tantaswadi, R. T de Carvalho, “In-line Sagnac interferometer current sensor”, IEEE Trans. Power Delivery, vol. 11, pp. 116-121, 1996.
[6] K. Bohnert, P. Gabus, J. Nehring et al., “Temperature and vibration insensitive fiber-optic current sensor”, J. Lightwave Technology. Vol. 20, NO. 2, pp. 267-276, 2002.
[7] K. Bohnert, P. Gabus, J. Kostovic et al., “Optic fiber sensors for the electric power industry”, Optics and Lasers in Engineering, Vol. 43, pp. 511-52, 2005.