Detection of Fuel Adulteration in Real Time Using
Optical Fiber Sensor and Peripheral Interface
Controller
Vivek Padmakarrao Kudea and Anita Patilb
a,bDepartment of E & Tc, MGM’s College of Engineering, Nanded, Maharashtra, India b
Department of Electronics, Dr. J.J. Magdum College of Engineering, Jaysingpur, Maharashtra, India
#
Corresponding Author: [email protected]
Received: Aug. 13, 2016, Revised: Nov. 12, 2016, Accepted: Dec. 1, 2016, Available Online: Aug. 8, 2017 DOI: 10.18869/acadpub.ijop.11.2.95
ABSTRACT- Detection of fuel adulteration in real time is the most important need of the world as it generates the hazardous effects on the environment, living and nonliving things. Various automotive users and fuel providers may mix kerosene in petrol and diesel. Adulterated fuel increases air pollution, as well as reduces the performance of vehicle engines. Such a malpractice in fuel is prevailing because vehicles do not have real time adulteration monitoring system. In this study, we propose evanescent wave optical fiber sensor, which is interfaced with peripheral interface controller (PIC) to detect fuel adulteration percentage by means of change in refractive index. A fuel sensor prototype is formulated and tested to detect adulteration percentage in petrol and diesel by kerosene. The sensor is useful as it has simple construction, real time operation, and safety handling with inflammable fuel for in-situ measurements. The sensors have detectable capacity of 5% contaminant in petrol and diesel using evanescent wave absorption technique. Other traditional techniques are able to detect presence of about more than 10 % of fuel adulteration only in the laboratory. PIC is used with a fuel sensor for incorporating an automation and sophistication in automotive display, so that it is more useful to layman.
KEYWORDS: Adulteration sensing, automotive application, evanescent wave, fuel adulteration, optical sensor, peripheral interface controller (PIC).
I.
I
NTRODUCTIONAdulteration of fuel is very rampant; this is because the products of comparable quantities has different price. Fuel adulteration has many effects, especially on any vehicle that uses such fuel; there will be increase in the tailpipe emission of harmful pollutants that affects the environment and the human health [1, 2]. The most significant factor responsible for adulteration is non availability of real time in-situ technique that followed universally for forthwith detection of adulteration level. As reported by A Kumar et al., the American Society for Testing and Materials International (ASTM International) has developed various test methods for gasoline and diesel. These tests are used to detect physical and chemical properties of the fuel, while other tests are provided to find suitability of the fuel from the point of engine performance. Therefore, these tests are not used to detect fuel adulteration by kerosene. There are few time-consuming tests, namely Density test, Evaporation test, Distillation test, Chemical Marker test, Gas Chromatography, which are used to detect the adulteration of fuel only in laboratories. The evaporation test (ASTM D3810) may detect
fuel adulteration using measurement of evaporation time of gasoline, diesel, and kerosene. Distillation test (ASTM D86) may calculate adulteration of kerosene in diesel and gasoline, through the difference in boiling point. To evaluate precise consequences, accurate distillation data for pure fuel is essential. The modus operandi is not appropriate for field use as the measurement system is generally bulky and measurement procedure is time consuming [4].
There have been numerous techniques for the measurement of petrol adulteration percentage, which are based on optical fibers proposed by various researchers [5-8]. V Mishra et al. proposed determination of fuel adulteration using long period fiber grating (LPFG) sensor technology. In this case, they had noticed 10% of fuel contaminant using the wavelength shift technique. The traditional technologies are able to detect the presence of fuel adulteration for more than 20 % [9]. R.C.P. Gustavo et al. describe the application of an optical fiber sensor using LPFG as an auxiliary tool to perform the gasoline conformity analysis. The proposed sensor is not affected by seasonal rules as the samples collected at different times of the year with different amount of anhydrous alcohols in the gasoline composition [10]. M. Boreccki et al. have proposed fiber optic capillary sensor for testing the quality of biodiesel fuel [11].
In the present work, we reported a real time sensor system that can detect petrol, diesel adulteration level by kerosene in the vehicle itself, using optical fiber evanescent wave technique. The sensor output is interfaced with PIC18F4455 due to which, adulteration level is continuously monitored on display with very easy deployment procedure. The results may give immediate identification of the adulteration level to automotive user that increase the lifetime of automobile engine as well as reduce the environmental pollution level.
II.
O
PTICALF
IBERE
VANESCENTW
AVET
HEORYIn recent years, diverse efforts have been directed towards the development of optical fiber chemical sensors and fuel sensors [12-13]. It offers many advantages over other types of sensors such as small size, immunity to electromagnetic and radio frequency interference, remote sensing, multiplexing the information from a large number of sensors in a single fiber, and in some cases the low cost [14]. Optical fiber can be made to act as sensors by etching the cladding region. Most etched sensors are based on, multimode fibers and are modeled using the wave theory [15]. In multimode tapered fiber generally hybrid of geometric ray and wave theory is used for representation. The fundamental LP01 mode is supported in the core of multimode fiber. With increase in refractive index difference (ΔRI), additional guided modes along the propagation axis can be trapped. If the refractive index changes abruptly, one might expect that mode coupling will induce the reflection of transmissive LP01 mode and distribute the light
power among cladding modes [16]. One important application of etched tapered fiber is in evanescent wave absorption. The principle is based on the fact that light wave guided in a fiber has a power fraction in the cladding in the form of evanescent wave [17]. When a light is incident on the core, cladding interface in a fiber, it is either refracted in the cladding or reflected in the same core region according to Snell’s law [18]. The reflected light in the core region due to total internal reflection is known as bound rays. The refracted light in the cladding region, which is partially confined to the core, is known as tunneling rays. Bound and tunneling rays enhance the evanescent wave in the tapered region. Thus the tapered etching in the fiber can increase the power portion of evanescent wave in the cladding or outside the core so that it is sensitive to external refractive index changes [19]. The multimode fiber tapering is simple to fabricate and use, but they have larger diameters and numerical aperture which leads to higher signal to noise ratio.
III.
E
XPERIMENTALD
ETAILSA. Preparation of Sensing Element
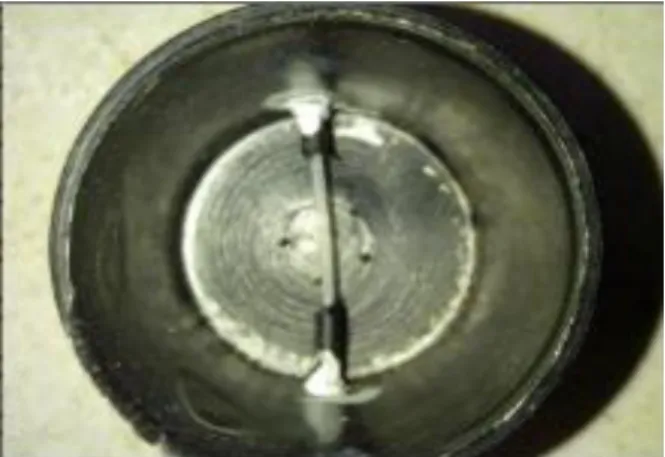
A multimode optical fiber is inserted inside the cell to etch 3 mm long. The fiber has a core diameter of 980 µm and 20 µm thick cladding. The outer portion i.e. cladding is removed with the help of acetone and water having a ratio of 1:1. After removal of cladding the fiber is washed with the help of de-ionized water. When the etching region has been washed, it removes the drops of acetone from the fiber, and then it stops the chemical etching process. After removing of cladding, the remaining fiber consists of only core. The fiber core outer diameter is 980 µm. It has been previously reported that the PMMA optical fiber can be bi-conically tapered at the fiber tip using 60% acetone, 20% MIBK and 20% distilled water (AMD solution) [20]. In our work this method has been modified to carry out etching of core at the centre of fiber. The experimental setup of etching process is similar to the arrangement as shown in Fig. 1, wherein the fiber is immersed in AMD solution. The two ends of the fiber are connected to transmitter circuit and optical detector circuit respectively.
Fig.1. Experimental setup used for etching of multimode optical fiber.
For etching purpose, the AMD solution is poured inside the cell. The etching rate of fiber in AMD solution is estimated and it is found to be 14 µm/min. The time required for the typical etching process is approximately 70 min. In this case, it is observed that for initial 10 min, there is no notable effect on guiding modulated wave. But as uniform diameter is reduced below 600 µm, there is rapid loss of transmitted signals. Subsequently, the signal at the detector become zero when the fiber is totally dissolved after 70 min. Figure 2 shows the photograph of tapered portion and the uniform core portion surface of the fiber
achieved by this method. Its schematic is shown in Fig. 3. The tapered core portion acts as a sensor. Here the etched uniform core diameter is 300 µ m and tapered diameter is 350 µm.
Fig. 2. Photograph of tapered portion and uniform core portion surface of the fiber.
Fig. 3. Schematic of tapered sensing region and uniform region of the fiber.
B. Proposed System of Sensor
Fuel adulteration sensor consists of an optical fiber evanescent wave sensor probe, electronic components, PIC18F4455 and LCD display. Figure 1 is extended in Fig. 4 as experimental setup for measurement and display of petrol/diesel adulteration percentage. The output of optical detector is connected to port 1 of the PIC microcontroller. Liquid Crystal Display (LCD) is connected to port 2 and port 4 of microcontroller.
Fig. 4. Experimental setup for the measurements and display of fuel adulteration.
The optical fiber sensor link is LED based intensity modulation. The optical output from the source is modulated by varying the current around the bias point proportion to the input signal level. Thus, the input signal is transmitted directly in the base band. The carrier power of the transmitter is the drive current through optical source. It is the sum of the fixed bias current and a time varying sinusoid. The source acts as a square law device, so that the envelope of the output optical power is:
t 1
P t P ms t (1) Here, Pt is the optical output power at the bias current level and s(t) is the modulating signal. The modulation index, m, is given by:
peak
t
P m
P
(2)
For sinusoidal received signal, the carrier power C at the output of the phototransistor is:
2 1
( )
2
C mRMp (3)
where, R is the unity gain response of the photodetector, M is the photodetector gain and
p is the average received optical power. Differential amplifier is used to amplify the difference with adjustable variable gain that is span of reference voltage for 0% fuel adulteration. The output of the amplifier is applied to PIC at pin RA0 where an inbuilt ADC is available, which provides the binary correspondent of the input analog voltage. To display on LCD, the determined fuel adulteration level is converted to ASCII code and then displayed on the LCD.
C. Sensor Response
In the performed experiment the sensor cell is a cylindrical shape with an etched tapered core diameter is 300 µm in diameter and 3 mm in length. With the interval of 5% adulteration level, the experiment has performed for the fuel adulteration level from 0% to 100%.
When the fuel is poured into sensor, then the etched part of the fiber is surrounded by fuel passive cladding. The amount of transmission loss that is the average received power by detector depends on, interaction of adulterated fuel with evanescent wave, i.e. bound, tunneling rays in the core and cladding after absorption. The transmission loss of input beam recorded at the output is due to tapered region and variation in refractive index of the test solution. The refractive index of fuel enclosed in the fiber sensing region acts as passive cladding. Any small change in the refractive index surrounding the tapered portion of the multimode fiber gives a change in optical transmission property. Identical proportion of kerosene such as 0 % (10 ml pure petrol/diesel + 0 ml kerosene ), 5% (10 ml petrol/diesel + 0.5 ml kerosene), 10% (10 ml petrol/diesel + 1 ml kerosene) up to 100 % (pure kerosene) are mixed in petrol/diesel to form identical fuel adulteration level. The offset potentiometer of signal conditioning circuit is calibrated for pure fuel. Then the sensor output voltage of the circuit is zero, showing 0% adulteration level. The span calibration is tender for kerosene i.e. 100 % adulteration level. The sensor results calculation were processed with distinction in adulteration level of petrol/diesel by kerosene. D. Signal Conditioning Circuit
The proposed system consists of a sensor module of petrol/diesel adulteration level detector, LCD module and respective power amplifier and filter circuit. The sensor output voltage at the fiber end using photo detector is not enough for the PIC analog to digital convertor (ADC). The output signal voltage of the photo-detector is amplified by the gain amplifier. The peak signal voltage of an amplifier is preferred to acquire the reference voltage of ADC. To minimize the noise level of amplified voltage signal a filter circuit is integrated with signal gain amplifier. The output of the filter circuit is given as input to the PORT A, where the inbuilt ADC of PIC performs the operation for to display a real time fuel adulteration level. The block diagram
of signal conditioning circuit is shown in Fig. 5.
Fig. 5. Block diagram of fuel sensor signal conditioning circuit.
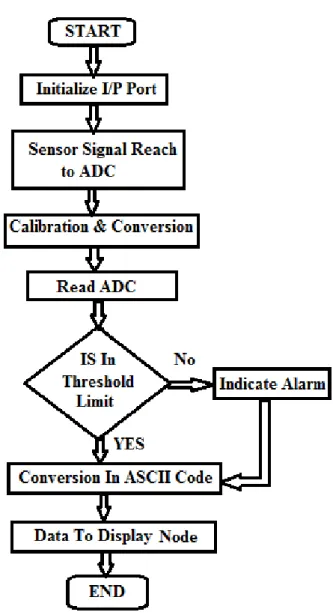
Fig. 6. Flow chart for real time process model to display adulteration level using PIC.
The PIC 18F4455 interfaced with petrol/diesel adulteration sensor, LCD display and required functioning components. PIC 18F4455 is a low power microcontroller. To operate this PIC 18F a 3.3 volts’ power supply is required. At run mode it requires only 11 µA current. It is used with optical fiber fuel sensor for adulteration computations, engineering
conversion and data transmission in real time to display system. The 10-bit ADC of the PIC converts the sensor output voltage signals i.e. analog signals into its appropriate digital form in the range of 0 to 1024. Fuel adulteration computations are performed for transformation of digital significance to its respective engineering entity.
E. Software Process Model for Sensor Node
MPLAB IDE with PIC C 18 compiler is employed for to design the programming of the fuel sensor in PIC 18F4455. The determined and amplified output values of fuel sensors are transferred into PIC 18F4455 through ADC by program code written in embedded C using PIC compiler. The obtained digital data is loaded to D0 and D1 data frame. The processed sensor data is loaded to data field D2 for cyclic redundancy check (CRC). The processor computes using CRC collected data. The processed computed data converted in ASCII code and transferred to LCD display node. Following the flow chart shows the process model for sensor node and gives the adulteration level in LCD display with the help of PIC.
IV.
R
ESULTS ANDD
ISCUSSIONThe optical fiber acts as a light wave guide on the principle of total internal reflection. To obtain total internal reflection inside the fiber, cladding material must have lower refractive index than core material. As per the basic ray theory total internal reflection takes place at the interface of core cladding boundaries. As well as with mode field wave theory, the evanescent wave is associated at core cladding interface. In other words, the transmitted light wave field is extending beyond the interface of core cladding into the surrounding medium. The mode field amplitude reduces exponentially with distance from the core cladding interface. The surrounding fuel works as passive cladding absorbs some part of the evanescent wave. Therefore, the power received at the detector end would be less by the amount absorbed at the surrounding medium with respect to its refractive index.
The etched fiber in the sensor cell is without cladding. Therefore, fuel under test works as passive cladding for the etched fiber length. Hence the power received at the detector is less with respect to that of fuel refractive index. The output light power recorded at the photo detector is given by the expression,
*exp
rec trans etch
P P L (4)
where, Ptrans is the transmitted modulated power from the source. Letch is the etched length of the fiber. The parameter γ is the absorption coefficient of the fuel under test. The factor exp
Letch
shows the evanescent light wave energy absorbed by the fuel passive cladding. The received power Prec is a responsive function of γ which itself depends upon the refractive index of the surrounding test fuel. The proposed technique is principally appropriate for to detect kerosene adulteration percentage in petrol and diesel. The refractive index for kerosene, petrol, diesel, and fiber core are 1.39, 1.42, 1.44, and 1.457 respectively. The adulterated fuel may produce refractive index with reference to fiber core. The Fig. 7 shows measured refractive index using Abee’s refractometer with respect to its adulteration level in petrol and diesel.Fig. 7. Measured refractive index of adultrated fuel using Abee’s Refractometer.
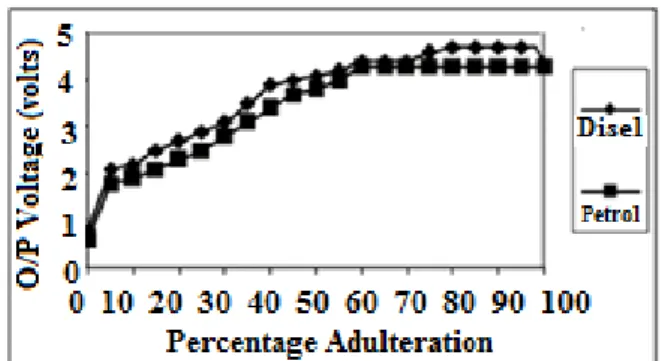
Therefore, the effect of evanescent wave shows an absorption loss that is variation in received power with respect to percentage adulteration level as shown in Fig. 8. While performing the experiment, a fixed quantity of test solution with various molar concentrations is placed in the sensor cell and the
corresponding output voltage is observed on digital multimeter and using PIC on LCD display in the form of adulteration percentage. Figure 8 shows the experimental result for fuel sensing using optical fiber sensor, which are calibrated using signal conditioning circuit. It is observed that as the molar concentration of adulterated fuel goes on increasing, there is an increase in output voltage.
Fig. 8. Experimental results for petrol and diesel adulteration percentage using optical fiber sensor The effect of change in the transmission signal of input beam recorded at the output is due to tapered region, absorption and variation in refractive index of the adulterated fuel. The refractive index of test solution adjacent the unclad region works as passive cladding. Any small change in the external refractive index surrounding the tapered portion of multimode fiber gives change in optical transmission property. The consequence of the passive cladding refractive index on tapered fiber is given by bound and tunneling rays. As there is change in the passive cladding refractive index surrounding tapered fiber, bound rays are confined to the core region with low loss of power fraction, but tunneling rays are confined into cladding with a very high loss of signal. As the refractive index surrounding fiber goes on increasing the bound rays are reflected back to core region according to Snell’s law. Although at the same time the tunneling rays, which are travelling through clad region, which lost as radiation due to external refractive index of medium it gives the increase in the angle of reflection in external refractive index medium.
V.
C
ONCLUSIONA real time in-situ fuel sensor is designed and formulated using multimode optical fiber. The formulated sensor can detect adulteration percentage of kerosene with petrol and diesel. The sensor phenomenon is depending on the deviation in reflected light intensity after the absorption by passive cladding refractive index made-up of surrounding fuels. The adulterated fuel provides variations in the passive cladding refractive index and confirms considerable change in output voltage at detector. The change in output voltage in the formulated sensor shows the actual added quantity of kerosene in petrol and diesel in the form of adulterations percentage on LCD display. The formulated sensor shows linear behavior for adulteration level. The designed and formulated sensor has absolute mercantile potential as it displays the adulteration results in real time on automotive display using peripheral interface controller.
R
EFERENCES[1] D. Mohan, A.K. Agrawal, and R.S. Singh, “Standardization for automotive exhaust pollution: Some issue in Indian perspective,” J. Inst. Eng. Vol. 86, pp. 39-43, 2006.
[2] D. Biswas and R. Ray, “Evaluation of adulterated petrol fuels,” Indian Chem. Eng. J. Vol. 43, pp. 314-317, 2001.
[3] A.K. Gupta and R.K. Sharma, A new method for estimation of automobile fuel adulteration, INTECH, 2010, [Online]. Available: http://www.intechopen.com/books/air
pollution, a new method for estimation of automobile fuel adulteration.
[4] N. Garg, S. Mohan, A. Pal, and R.S. Mishra, “Fuel Adulteration, problem and mitigation strategies: A Review,” Int. J. Adv. Research Innovation (IJARI), Vol. 48, pp. 340-344, 2015.
[5] M. Kumar, D. Engles, S. Prashar, and A. Singh, “Etched FBG as chemical sensor for fuel adulteration,” Int. J. Eng. Research Technol. (IJERT), Vol. 1, pp. 1-5, 2012.
[6] S.E. Jero and A.B. Ganesh, “PIC18L4620 Based customizable wireless sensor node to detect hazardous gas pipeline leakage,” IEEE
Proc. ICETECT, India, pp 563-566, March 2011.
[7] S.S. Patil1 and A.D. Shaligram, “Refractometric fiber optic adulteration level detector for diesel,” Int. J. Adv. Eng. Technol. (IJAET), Vol. 1, pp. 195-203, 2011.
[8] L.G. Dias Mendonca, B. Barazani, B.B. Chaves, D. Torikai, R.C. Ibrahim, M.H.D.O. Piazzeta, A.L. Gobbi, and T. Sanjak, “Study of a capacitive MEMS as a sensor for automotive fuel evaluation,” ABCM symposium series in Mechatronics, Vol.5, pp. 140-144, 2012.
[9] V. Mishra, S.C. Jain, N. Singh, G.C. Poddar, and P. Kumar, “Fuel adulteration detection using long period fiber grating sensor technology,” Int. J. Pure Appl. Phys. (IJPAP), Vol. 46, pp. 106-110, 2008.
[10]G.R.C. Possetti, R. Falate, L. Cocco, G.I. Yamamoto, M. Muller, and J.L. Fabis, “Application of an optical fiber sensor in the analysis of Brazilian gasoline conformity,” Nation. Meet. Conden. Mat. Phys. (XXX ENFMC), Annals of Optics pp. 234-237, 2007.
[11]M. Boreccki, P. Doroz, J. Szmidt, M.L. Korwin-Pawlowski, A. Kociubinski, and M. Duk, “Sensing method and fiber optic capillary sensor for testing the quality of biodiesel fuel,” 4th International conference on Sensor Device Technologies and Application, Spain (ICMAST), pp 19 - 24, 2013.
[12]E.P. Schartner, T.M. Monro, and C. Davis, “Fuel degradation sensing using micro-structured optical fibers,” Mater. Forum, Vol. 33, pp. 267-274, 2009.
[13]V.P. Kude and R.S. Khairnar, “Fabrication and numerical evaluation of the tapered single mode optical fiber: Detection of change in refractive index,” Int. J. Pure Appl. Phys. (IJPAP), Vol. 46, pp. 23-29, 2008.
[14]K. Cherif, J. Mrazek, S. Hleil, V. Matejec, A. Abdelghani, M. Chomat, N. Jaffrezic-Renault, and I Kasik, “Detection of aromatic hydrocarbons in air & water by using Xerogel layers coated on PCS fibers excited by an inclined collimated beam,” Sensors Actuators B, Vol. 95, pp. 97-106, 2003.
[15]M. Vlastimil, C. Miroslav, M. Hayer, and I. Kasik, “Development of special optical fibers
for evanescent wave chemical sensing,” Czechoslovak J. Phys., Vol. 49, pp. 883-888, 1999.
[16]R. Zhang, X. Zhang, D. Meiser, and H. Gissen, “Mode and group velocity dispersion evolution in the tapered region of single mode tapered fiber,” Opt. Express, Vol. 12, pp. 5840-5849, 2004.
[17]P.S. Kumar, S.T. Lee, C.P.G. Vallabhan, V.P. Nampoori, and P. Radhakrishnan “Design and development of an LED based fiber optics evanescent wave sensor for simultaneous detection of chromium and nitrate traces in water,” Opt. Commun. Vol. 214, pp. 25-30, 2002.
[18]S. Guo and S. Albin, “Numerical technique for excitation and analysis of defects modes in photonic crystals,” Opt. Express, Vol. 11, pp. 1080-1089, 2003.
[19]A.J. Fielding and C.C Davis, “Tapered single mode optical fiber evanescent wave coupling”, IEEE Photon. Technol. Lett. Vol 14, pp. 53-55, 2002.
[20]D.F. Merchant and P.J. Scully, and N.F Schmitt, “Chemical tapering of polymer optical fibre”, Sensors and Actuators A-PHYSICAL Vol.76, No.1-3, pp. 365 - 371, 1999.
Mr. Vivek Padmakarrao Kude born in 1976 is pursing Master of Engineering in Electronics at Dr. J.J. Magdum College of Engineering, India. He has received PhD in Physics (2008) from SRTM University, Nanded, India. Currently he is working as Associate Professor at MGM’s College of Engineering, Nanded, Maharashtra, India. His research interest includes the areas of Optical Fiber Sensor, Embedded system, Microwave, and Satellite Communication.
Mrs. Anita Patil pursuing Ph.D. in signal processing and currently working as Asst. Prof. at Dr. J.J. Magdum College of Engineering, Jaysingpur, India. Her interests include the areas of signal processing, image processing and communication.