Copyright © 2004, American Society for Microbiology. All Rights Reserved.
spa
Typing Method for Discriminating among
Staphylococcus aureus
Isolates: Implications for Use of a Single Marker To Detect
Genetic Micro- and Macrovariation
Larry Koreen,
1,2Srinivas V. Ramaswamy,
3Edward A. Graviss,
3Steven Naidich,
4James M. Musser,
3,5and Barry N. Kreiswirth
1*
Public Health Research Institute, International Center for Public Health,1and Graduate School of Biomedical Sciences and
New Jersey Medical School, University of Medicine and Dentistry of New Jersey,2Newark, New Jersey 07103; Department
of Pathology, Baylor College of Medicine, Houston, Texas 770303; eGenomics, New York, New York 100134;
and Laboratory of Human Bacterial Pathogenesis, Rocky Mountain Laboratories, National Institute
of Allergy and Infectious Diseases, National Institutes of Health, Hamilton, Montana 598405
Received 16 July 2003/Returned for modification 29 September 2003/Accepted 15 October 2003
Strain typing of microbial pathogens has two major aims: (i) to index genetic microvariation for use in outbreak investigations and (ii) to index genetic macrovariation for use in phylogenetic and population-based analyses. Until now, there has been no clear indication that one genetic marker can efficiently be used for both purposes. Previously, we had shown that DNA sequence analysis of the protein A gene variable repeat region (spatyping) provides a rapid and accurate method to discriminateStaphylococcus aureusoutbreak isolates from those deemed epidemiologically unrelated. Here, using the hypothesis that the genetic macrovariation within a low-level recombinogenic species would accurately be characterized by a single-locus marker, we tested whetherspatyping could congruently index the extensive genetic variation detected by a whole-genome DNA microarray in a collection of 36 isolates, which was recovered from 10 countries on four continents over a period of four decades, that is representative of the breadth of diversity withinS. aureus.Usingspaandcoa
typing, pulsed-field gel electrophoresis (PFGE), and microarray and multilocus enzyme electrophoresis (MLEE) data in molecular epidemiologic and evolutionary analyses, we determined thatS. aureuslikely has a primarily clonal population structure and thatspatyping can singly index genetic variation with 88% direct concordance with the microarray and can correctly assign isolates to phylogenetic lineages. spatyping per-formed better than MLEE, PFGE, andcoatyping in discriminatory power and in the degree of agreement with the microarray at various phylogenetic depths. This study showed that genetic analysis of the repeat region of protein A comprehensively characterizes both micro- and macrovariation in the primarily clonal population structure ofS. aureus.
Staphylococcus aureus is the leading cause of nosocomial
infections (21) and is responsible for a wide range of human diseases, including endocarditis, food poisoning, toxic shock syndrome, septicemia, skin infections, soft tissue infections, and bone infections, as well as bovine and ovine mastitis. The recent emergence of community-associated
methicillin-resis-tantS. aureus(MRSA) strains (23) and the movement of the
vanAoperon fromEnterococcus faecalisinto MRSA, establish-ing strains with high-level vancomycin resistance (3), further heighten the public health concerns. Thus, understanding and controlling the spread ofS. aureus, in both the hospital and community settings, is now of paramount importance.
S.aureusis a heterogenous (polymorphic) species (13) that
was recently found to have a clonal population structure (11). Therefore, it is believed that S. aureusdoes not undergo ex-tensive recombination, diversifies largely by nucleotide mu-tations, and shows a high degree of linkage disequilibrium (nonrandom associations between genetic loci). In order to distinguish strains within a heterogenous species for local epi-demiologic or outbreak investigation purposes, a highly dis-criminating genetic marker that accumulates variation rapidly,
such as pulsed-field gel electrophoresis (PFGE), is required (10). For studying longer-term or global pathogen epidemiol-ogy and population genetics, such as the worldwide distribu-tion and frequency of bacterial lineages, virulence properties associated with certain lineages, etc., a highly discriminating genetic marker that accumulates genetic variation relatively slowly is desired (10). For many years multilocus enzyme elec-trophoresis (MLEE) and, recently, multilocus sequence typing (MLST) have been effectively used for this purpose (17). How-ever, no single technique had been clearly shown to be efficient in both outbreak and global investigations due to the different requirements for rates of accumulating genetic variation.
We previously reported on DNA sequencing of a polymor-phic 24-bp variable-number tandem repeat (VNTR) within the 3⬘ coding region of theS. aureus-specific staphylococcal pro-tein A (spa) gene for discrimination ofS. aureusin outbreak settings (30). This comparative study of multiple genotyping methods revealed that spatyping is as capable for outbreak purposes as other molecular methods, including PFGE. There are indications thatspatyping may also be in agreement with MLST (4, 24), which is likely a reflection of the clonal nature
of S. aureus. If a single-locus DNA sequence-based marker
such as spa typing was capable of simultaneously indexing genetic variations that accumulate both rapidly and slowly (mi-cro- and macrovariation) by two independent mechanisms, * Corresponding author. Mailing address: PHRI TB Center,
Inter-national Center for Public Health, 225 Warren St., Newark, NJ 07103. Phone: (973) 854-3240. Fax: (973) 854-3241. E-mail: [email protected].
792
on May 15, 2020 by guest
http://jcm.asm.org/
then this one marker would be useful in both local and global, long-term epidemiologic and population-based studies. Use of a single-locus marker is also inherently less expensive, time-consuming, and error prone than multilocus techniques, such as MLST (25).
Here we formally investigate whetherspatyping, in addition to its usefulness in outbreak investigations, also accurately reflects variation occurring throughout the entire chromo-some, enabling its use in global population studies and as a simple and rapid way of assigning strains to phylogenetic lin-eages. In order to test this, we used a collection of 36 strains previously characterized by a DNA microarray based upon over 90% of the genome of the COL strain (13) and compared the results obtained byspatyping these strains to the results of the DNA microarray. The 36 strains, which were selected for being representative of the most abundant lineages from over 2,000 spatio-temporally diverse isolates typed by MLEE, pro-vided a highly diverse collection that also enabled detection of the likely population structure ofS. aureus. Additionally, the strains were analyzed by PFGE andcoatyping (31) to better assess the discriminatory ability, accuracy, and relative rate of genetic change (clock speed) ofspatyping.
MATERIALS AND METHODS
Bacterial strains.Thirty-sixS. aureusstrains, as described in the report by Fitzgerald et al. (13), including the fully sequenced COL strain, were analyzed. These strains were selected from 2,077 MLEE-typed isolates recovered from 10 countries on four different continents over a period of four decades as part of a population genetics study, to represent the most abundant lineages and the breadth of genetic diversity ofS. aureus. The majority of strains were isolated from various human disease conditions and some were from bovine and ovine mastitis cases (13), where the chosen strains (n⫽4) represented the most abundant lineages ofS. aureusresponsible for these economically important animal conditions. Also included in the sample were 11 strains of phylogeneti-cally diverse MRSA (20) and 14 isolates of electrophoretic type (ET) 234, associated with toxic shock syndrome (TSS) and of diverse gene content (13).
Molecular analysis.spaandcoatyping were performed on each of the isolates as previously described (30, 31). Aspatype refers to the composition of the VNTRs in the 3⬘end of the staphylococcal protein A gene (spa). The repeats that define aspatype are composed of 24 bp (the only exception being two new repeats found in this study [see Results], which were composed of 21 bp), and a total of 38 repeats have now been identified. Each repeat, designated randomly with letters (A to Z, A2, B2, etc.), varies from the others by at least one point mutation. The different types of organization of a repeat region, ranging from 2 to 16 repeats in length and termed a repeat profile, have defined a total of 386 numericspatypes among more than 4,000S. aureusisolates in the Public Health Research Institute Tuberculosis Center repository. Thecoatyping methodology is similar to that forspatyping; however, the VNTR region in the coagulase gene consists of 81-bp repeats, and a total of 67 different coarepeats have been identified to date.
spatyping andcoatyping each had one isolate for which additional processing was required. MSA 2389 did not produce a strongspaPCR product, but South-ern hybridization revealed that the polymorphic region was present. A new forward primer slightly upstream of that normally used was designed (F2, 5⬘-G AACAACGTAACGGCTTCATCC-3⬘) and gave good results, suggesting that mutations in the region of the forward primer were responsible for the problem. Thecoaregion of MSA 2335 had a plasmid-encoded arsenic transporter DNA sequence inserted just downstream of the coagulase gene stop codon and just upstream of the reverse primer used incoatyping, making it difficult to obtain the complete reverse sequence for this region. A primer was designed close to the insertion, and the reverse DNA sequence was obtained.
As done previously (4, 30),spatypes with similar repeat profiles were grouped together as part of the same numeric lineage because of sequential point muta-tions (indicated by specificsparepeats) in common. The same was done for similarcoatypes (31), and because of the higher number of extantcoarepeats compared tosparepeats,coalineages were able to be constructed, when deeper phylogenetic classification was sought, from coatypes with fewer repeats in
common compared tospatyping.coatyping results also served as a comparative secondary marker ofspatyping lineage assignments. However,spatyping lin-eages were assigned independently ofcoa typing results and vice versa and independently of the previously published DNA microarray results (13) dis-cussed below.
Macrorestriction analysis using PFGE was performed (6). Isolates with pat-terns up to six bands different are considered possibly related (35) and were grouped together in the same alphabetic lineage, with each unique pattern within a lineage also given a secondary numeric code. Patterns that did not fall into any lineages were identified solely with the numeral 1.
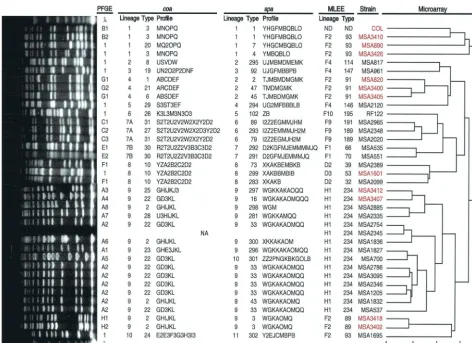
The DNA microarray experiments performed by Fitzgerald et al. (13) assayed for the presence of 2,817 open reading frames (ORFs) within each of the 36 strains used in this study. Only 78% of ORFs were shared by all strains. Hier-archical cluster analysis based on the presence or absence of ORFs was used to construct a dendrogram showing chromosomal relationships among the 36 strains (13). The dendrogram (Fig. 1) indicates relatedness with a scale that specifies the Pearson correlation coefficient for each node (1⫽identical and 0⫽ total independence for a pairwise analysis). In this study, lineages of the den-drogram were assessed at deep phylogenetic levels (i.e., the scale was truncated at lower correlation coefficients, 0.5 and 0.31, forming fewer and fewer genetic groups) and at a more discriminating level (i.e., the scale was truncated at a higher correlation coefficient, 0.81, forming more genetic groups).
Comparison of genetic markers.The degree of congruence between different typing schemes was determined via cross-classification analysis of all possible pairs of isolates (28, 37). Briefly, for each isolate pair it was determined whether their lineages matched (i.e., were identical) or mismatched (i.e., were different) according to each typing technique. A two-by-two table was constructed for each two-technique comparison, and the percent cell concordance was calculated.
Discriminatory power was measured with Simpson’s index of diversity, which calculates the probability that any two isolates will have different genotypes (14). Molecular evolutionary analyses of thespaandcoarepeats were conducted with MEGA version 2.1 (16). The average numbers of synonymous substitutions per synonymous site (dS) and nonsynonymous substitutions per nonsynonymous site (dN) were calculated by using the overall mean Nei-Gojobori (Jukes-Cantor corrected) method (22) with pairwise deletion handling of gaps and standard error determined with 1,000 bootstrap replications. Z-tests to detect selection pressure on the repeats were performed with the null hypothesis dN⫽dS and three different alternative hypotheses: dN⫽dS (test of neutrality), dN⬎dS (positive selection), and dN⬍dS (purifying selection). The PROTPARAM program (http://us.expasy.org/tools/protparam.html) from the Swiss Institute of Bioinformatics ExPASy (Expert Protein Analysis System) proteomics server (1) was used to determine the grand average of hydropathicity index, a measurement of hydrophobicity calculated for the amino acid sequence of eachsparepeat.
RESULTS
Organization of spa, coa, and PFGE genotypes and DNA microarray dendrogram.All 36 strains analyzed were typeable byspa,coa, and PFGE techniques. Figure 1 shows the previ-ously produced dendrogram for the DNA microarray data and the MLEE lineage and ET designations, next to which are the
spa and coa lineage, type, and profile data and the PFGE genotype data for each of the isolates used in this study.
(i)spatyping.As described in Materials and Methods and elsewhere (30), aspatype is composed of various repeats, each of which represents 24 nucleotides (eight codons). In this study two new spa repeats (Y2 and Z2) were found among the isolates, both of which contained never-before-seen single-codon deletions (Fig. 2 lists allsparepeats inS. aureusthat we have identified to date), and 14 newspatypes were identified (spatypes 281, 283, and 291 to 302). In total, spatyping re-solved 29 distinct spa types for the 36 strains. The repeat profiles of thesespatypes were organized for the 36 strains into 11 different lineage groups (Fig. 1), 5 of which contained a single strain. Lineages were formed by grouping together strains with similarspa repeat profiles, which represents the accumulation of identical point mutations, suggesting a genetic relatedness and descent from a common ancestor (30, 31). The
on May 15, 2020 by guest
http://jcm.asm.org/
same spaprofile groupings were obtained by using a global multiple-sequence alignment program (data not shown). As an example, although spatype 46 (YMBQBLO) differed in the number of repeats from spatype 7 (YHGCMBQBLO), the two were grouped together inspalineage 1 because they con-tained in common many identical repeats representing exact nucleotide polymorphisms shared by both.
(ii)coatyping.Thirty-one newcoarepeats were found, and 13 newcoatypes were identified (coatypes 19 to 31). In total,
coatyping resolved 19 differentcoatypes (Fig. 1), which, by using the same methodology as forspatyping, could be orga-nized into either 11 or 10 (for deeper phylogenetic classifica-tion) lineages, which were designated coa lineages I and II, respectively (i.e., by counting coa lineages 7A and 7B sepa-rately or as one).
(iii) PFGE. A total of 28 different PFGE genotypes were resolved. There were 15 PFGE strain families formed from strains considered identical or possibly related, with up to six band differences present between any two members of a family. Eight of these families had only one isolate and were assigned
a unique PFGE type (designated 1). PFGE patterns and types are shown in the left portion of Fig. 1.
[image:3.603.56.528.66.409.2](iv) DNA microarray dendrogram.Allspaandcoalineages were compared to the “gold standard” microarray to deter-mine whether agreement exists and the extent of discrimina-tory and grouping abilities ofspaandcoatyping relative to the microarray. Because the microarray distinguished all 36 iso-lates from one another (13), microarray lineages had to be defined according to correlation coefficient truncation values, which was done in the following way. Moving as deeply into the phylogeny as possible on the DNA microarray dendrogram (shown on the right side of Fig. 1), at a correlation coefficient of⬍0.25, two major clusters are distinguished, one containing 4 closely related strains that were always grouped together as one lineage and the other containing the remaining 32 genet-ically diverse strains that were grouped at three different levels. Assessment of these 32 strains at a very deep phylogenetic correlation coefficient of 0.31 classified them into only four lineages, creating for the 36 strains a total of five DNA mi-croarray lineages, which hereafter will be referred to as the FIG. 1. Molecular characterization of strains. From right to left: (i) a dendrogram showing the estimated relationships of the 36 strains based on a whole-genome DNA microarray with a scale indicating the Pearson correlation coefficient for each node (0, totally unrelated; 1, identical); (ii) a listing of strains (MSA, MusserS. aureus; red, MRSA strains); (iii) MLEE lineage and ET for each strain; (iv)spaandcoalineages, types, and profiles for each strain (note thatcoalineages 7A and 7B can be considered separate lineages [lineages I] or together as one lineage [lineages II]); (v) PFGE patterns and types (, molecular weight standard of lambda DNA concatemers from New England BioLabs). NA, strain was not available. The dendrogram was adapted from reference 13 with permission of the publisher.
on May 15, 2020 by guest
http://jcm.asm.org/
0.31 microarray lineages. Assessment of the 32 strains at a slightly less deep correlation coefficient of 0.5 produced a total of 12 lineages (named 0.5 microarray lineages) for the 36 strains, and when truncation was at a discriminating 0.81 value, 35 groups were created for the 36 strains (named 0.81 microar-ray groups). The 0.5 depth was chosen to create microarmicroar-ray lineages after exploring where on the microarray dendrogram the upper limit of spa typing’s ability was to group strains together into lineages, beyond which it could not group strains further. The 0.81 truncation value on the microarray dendro-gram was the upper limit ofspatyping’s ability to discriminate strains, beyond which it was unable to distinguish related strains further. Lastly, the 0.31 value was the deepest phyloge-netic level on the microarray dendrogram at whichcoatyping (number ofcoalineages at this level⫽10) could group strains together into lineages.
Congruence between genetic markers.The 11 differentspa
typing lineages were 88% concordant with the 12 0.5 microar-ray lineages in cross-classification analysis of all possible pairs of isolates based on matched or mismatched lineages (Table 1). Therefore, any two strains determined to be either of the
same lineage or from different lineages by one technique were given an identical designation by the other technique 88% of the time. Other concordance values are listed in Table 1, which shows thatspatyping is slightly more congruent with the DNA microarray (88%) than is MLEE (87%). Also,spatyping and MLEE were 87% congruent in designating lineages. Only one strain, MSA 700 (spatype 301), had aspaprofile that was in no way allied with those of closely related strains as determined by the DNA microarray (this strain was, however, correctly clas-sified bycoatyping). Overall, these results show thatspa typ-ing, which relies on a single VNTR locus, can serve as a marker of deeper phylogeny and is congruent with the DNA microar-ray, which detects genome-scale variation.
[image:4.603.128.457.68.440.2]coalineages I were highly concordant with the 0.5 microar-ray lineages (89%), and lineages II were even more so with the 0.31 microarray lineages (95%) of the microarray. MLEE lin-eages had lower agreement than coatyping did with the 0.5 and 0.31 microarray lineages (87 and 85%, respectively). Last-ly, coalineages were highly concordant with MLEE lineages (90%), andcoatypes were highly concordant with MLEE types (87%).
FIG. 2. DNA sequences for the 38sparepeats identified to date inS. aureus.Individual repeat codes are shown on the right. Sequences are organized and displayed as eight colored codons, and codons in the same column with the same color represent the same three nucleotides. Asterisks indicate repeats that have been redefined, and crosses indicate new repeats found since those previously reported (30).
on May 15, 2020 by guest
http://jcm.asm.org/
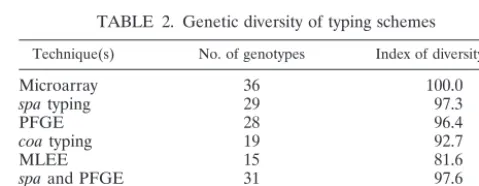
Discriminatory power.The DNA microarray, which assayed for the presence of⬎2,800 ORFs, was able to differentiate all 36 isolates from one another. The results obtained by Fitzger-ald et al. (13) showed high variability, up to 22%, in genetic content among different strains and demonstrated that no two strains were identical. Simpson’s index of diversity calculates the probability that two randomly selected isolates will have different genotypes, and therefore the DNA microarray had a 100.0% resolving power. There were 29 differentspatypes, and the probability that any two isolates could be differentiated based on spa typing was 97.3%, which was higher than the values for MLEE (81.6%), coa typing (92.7%), and PFGE (96.4%) (Table 2). Fourteen of the isolates were members of a TSS clone, classified as identical by MLEE (ET 234) and very closely related by the DNA microarray, and the slightly lower resolution ofspatyping in comparison to the microarray was largely due to difficulty in resolving differences among the members of this group. However, the nine differentspatypes resolved for this group were greater than the number of types distinguished by PFGE (n⫽8),coatyping (n⫽5), or MLEE (n⫽1). The combination ofspatyping and PFGE resulted in only a 0.3% increase in resolving power overspatyping alone. A summary of the genetic diversity detected by various tech-niques is given in Table 2. coatyping had approximately 5% less resolving power than spa typing, and together with its strong congruence with the microarray at deep phylogenetic levels and withspatyping (see next section),coaperformed as a secondary marker of lineage and as a verifier ofspatyping groupings.
The dendrogram produced by the DNA microarray, at a correlation coefficient of 0.81, split the 36 strains into 35 dif-ferent groups (i.e., only two strains shared the same designa-tion). At this highly discriminating level, individualspatypes (n
⫽29) for the 36 isolates were 97% concordant with the DNA microarray in cross-classification of the isolates. However, MLEE types were only 83% concordant with the microarray at this level. Additionally, using this same method of analysis, individualspaand PFGE types were 98% concordant. These data, along withspatyping’s capability of resolving⬎3 trillion potentialspatypes (see below), illustrate the very high discrim-inatory ability of spa typing and its congruence with other high-resolution techniques, such as the microarray and PFGE, for a spatio-temporally diverse collection of isolates.
Linkage disequilibrium and a clonal population structure.
The performance ofcoaandspatyping on all isolates aided in
determining the presence of linkage disequilibrium in this di-verse set of methicillin-susceptibleS. aureus and MRSA iso-lates. Only two isolates had aspatype orcoatype discrepancy (MSA 700 and MSA 817, respectively) in the expected agree-ment of typing results between the two techniques based on groupings of isolates in Fig. 1. In cross-classification analysis of lineages produced by spaandcoatyping, the two techniques were 97% concordant (Table 1). In order to assess the signif-icance of these findings, their probability of occurrence by chance was determined. There were an average of 9 repeats perspatype, and since there are 38 differentsparepeats, 11 of which can be present only as the first repeat, a total of 278⫻
11 or⬎3 trillion differentspatypes can potentially be resolved. Likewise, there were an average of 6coarepeats percoatype and there are 67 differentcoarepeats, with 11 present only in the first position, producing a total of⬎6 billion possiblecoa
types. The product of the number of types thatspa andcoa
typing can each resolve equals 1.9⫻1022and represents the
total possible number of spaandcoaallelic profiles that the two techniques in combination can resolve. Therefore, the probability that isolates with a relatedspatype would happen to have a relatedcoatype by chance is practically zero. (This finding is made even more conclusive because it is unlikely, based on their approximately 100-kb distance from one an-other, that thespaandcoagenes could be inherited together in a single transfer event [30].)
[image:5.603.42.547.81.162.2]Whereasspaand coatyping each index variation at single loci, the DNA microarray, MLEE, and PFGE index variation throughout the chromosome, and detecting agreement with these latter techniques is a particularly effective way of dem-onstrating linkage disequilibrium because they are such highly informative markers. The strong agreement ofspatyping with PFGE and ofspatyping,coatyping, and MLEE each with one TABLE 1. Cross-classification concordance results
Typing technique
% Concordanceabetween:
Microarray MLEE PFGE coa
spa 88 (lineages/0.5), 97 (types/0.81) 87 (lineages/lineages) 98 (types/types) 97 (lineages/lineages I) coa 89 (lineages I/0.5), 95 (lineages II/0.31) 90 (lineages I/lineages),
87 (types/types) MLEE 87 (lineages/0.5), 85 (lineages/0.31),
83 (types/0.81)
aThe percent of direct concordance between any two typing schemes is shown where the two intersect on this matrix. A (row/column) descriptor follows each
concordance value, as follows. For microarray, 0.31 indicates 0.31 microarray lineages, 0.5 indicates 0.5 microarray lineages, and 0.81 indicates 0.81 microarray groups. Forspatyping, lineages and types were separately analyzed. Forcoatyping, lineages and types were separately analyzed; lineage I includes 11coalineages produced by countingcoalineages 7A and 7B separately, and lineage II includes 10coalineages produced by countingcoalineages 7A and 7B as one lineage for deeper phylogenetic analysis. For MLEE, lineages and types were separately analyzed. For PFGE, individual types were analyzed. As an example, the concordance between spatyping and the microarray is 88% forspatyping lineages and the 0.5 microarray lineages.
TABLE 2. Genetic diversity of typing schemes
Technique(s) No. of genotypes Index of diversity (%)
Microarray 36 100.0
spatyping 29 97.3
PFGE 28 96.4
coatyping 19 92.7
MLEE 15 81.6
spaand PFGE 31 97.6
spaandcoa 29 97.3
spaand MLEE 29 97.3
on May 15, 2020 by guest
http://jcm.asm.org/
[image:5.603.301.541.631.724.2]another and with the DNA microarray at various phylogenetic depths (Table 1) highlights the presence of nonrandom asso-ciations among loci throughout the genome and the presence of a phylogenetic signal in the isolates. Furthermore, agree-ment of phylogenetic lineage assignagree-ment results from single-locus and other molecular techniques indicates low levels of recombination (27) within this population of isolates. Such widespread linkage disequilibrium among various independent genetic markers and low levels of recombination are strong evidence (7, 34) thatS. aureushas a primarily clonal popula-tion structure.
Evolutionary pressure on repeats. In addition to analysis based on DNA sequence data from thespalocus, the amino acid profile of the sparepeats for each isolate was analyzed. Amino acid typing results, unlike those produced from DNA sequences, were unable to be organized in any particular way, as they were all similar, demonstrating that the single-nucleo-tide polymorphisms within the polymorphic region throughout even distant related lineages are usually silent. This conserva-tion of amino acids revealed interesting structural patterns; for example, nearly all repeat profiles began with the same eight amino acids and ended with the same eight amino acids, al-though major variation exists at the DNA level. Consistent with these results were findings that all 38 differentsparepeats identified thus far had similar amino acid hydropathicity indi-ces (range,⫺3.0 to⫺2.5) and similar peptide secondary struc-tures (data not shown). For the 38 spa repeats, the dS/dN value, a ratio of the number of synonymous substitutions per potential synonymous site to number of nonsynonymous sub-stitutions per potential nonsynonymous site, was 6.4 (a ratio of ⬍1 indicates positive selection, a ratio of 1 indicates no selec-tion pressure [i.e., neutral evoluselec-tion], and a ratio of⬎1 indi-cates purifying selection). The dS value was 0.72 (standard error, 0.15), and the dN value was 0.11 (standard error, 0.06). The dS/dN ratio for the 30sparepeats found in this collection similarly equaled 6.5. Furthermore, analysis of the eight indi-vidual codons that comprise thesparepeat region from all 38 repeats revealed that no codon had a low dS/dN value, ruling out the possibility that a certain part of a repeat might be under positive selection but was undetected. Lastly, a Z-test for de-tecting purifying selection was significant for thesparepeats (P
⫽0.0004). For the 67coarepeats identified thus far, the dS/dN ratio was 3.8 and was identical to the ratio for the 60 coa
repeats found in this collection. Therefore, the coa repeat region is also highly conserved (P ⫽0.009 for the Z-test of purifying selection). The lack of positive selection and the presence of strong purifying selection precludes the polymor-phic spa and coa loci from accumulating variation linked to outside sources, and instead they reflect variation produced intrinsically by the organism, allowing them to be genetic markers for global epidemiologic studies.
DISCUSSION
The recent advances in bacterial genomics, bioinformatics, and DNA sequencing have enriched the molecular tools of population geneticists, evolutionary biologists, and hospital in-fection control teams tracking suspected outbreaks. Histori-cally MLEE, and now MLST, have been the most commonly used methods for population geneticists and those studying
global epidemiology because these techniques accumulate ge-netic variation slowly; PFGE has been preferred for outbreak investigations because it accumulates variation rapidly; and, depending on whether micro- or macroevolutionary insights are sought, evolutionary biologists may use either approach. Comparative genomics and DNA microarrays are emerging as two useful platforms for molecular population and evolution-ary biologists to discriminate phylogenies based on genome-scale variation (2, 13, 19, 29, 33). In this study we showed that sequencing of a single polymorphic VNTR locus, already proven to be effective for use in outbreak settings, produces results strongly congruent with that of a whole-genome DNA microarray for a collection of geographically and temporally diverse isolates. Unlike more expensive and labor-intensive techniques such as MLST (25), which requires sequencing ap-proximately 3,500 bp from seven different loci per isolate,spa
typing is based on the sequencing of only a single PCR ampli-con that ranges in size from 200 to 600 bp. Furthermore, it should be noted that MLST is not able to distinguish various MRSA strains (9) and, unlikespatyping, has not been tested and shown to be successful in an outbreak setting where en-demic clones require high levels of discrimination.
In global population studies a genetic marker that can dis-tinguish strains at a fine resolution is needed to discern subtle variation and concurrently link strains together into broad phy-logenetic groups to study phenomena such as the nonrandom distribution of virulence among bacterial lineages. The DNA microarray met these criteria because it differentiated all 36 strains and, because it found that all of the strains had 2,198 ORFs in common, was able to generate a dendrogram display-ing deep phylogenetic relationships among strains from very distant lineages. In its most discriminatory capacity, i.e., at the level of individualspatypes,spatyping can differentiate strains comparably to the whole-genome microarray at the 0.81 level of the dendrogram, which splits 36 isolates into 35 different groups. Yetspatyping, when used at the level ofspalineages, is able to assign strains to phylogenetic lineages and group strains comparably to the microarray at the 0.5 level. More-over,spatyping was tolerant of mutations and repeat insertion-deletion events without compromising its ability to assign strains to lineages. This attribute also minimizes compounding the effects of minor sequencing errors when assigning geno-types, as has been problematic elsewhere (5).
Based on the results shown here and elsewhere (30, 31) and on the thousands of S. aureus isolates in our collection that have been spatyped, it is evident that recombination events involving thespalocus, which might reducespatyping accu-racy, take place very rarely. If verification of aspalineage was desired, then MLST or DNA microarray analysis of certain representative strains would be appropriate. Concern overspa
typing lacking the ability to discern differences among closely related strains, such as the ET 234 TSS strains of this study, could be resolved with a highly evolving marker. Our recent study demonstrated that sequence analysis of a locus contain-ing a repeat encodcontain-ing a serine-aspartate dipeptide is capable of distinguishing among strains with identicalspagenotypes (L. Koreen, S. Ramaswamy, S. Naidich, E. A. Graviss, and B. Kreiswirth, Abstr. 103rd Gen. Meet. Am. Soc. Microbiol., ab-str. C-415, 2003). It is also important to note thatspatyping has long-term in vitro and in vivo stability (30), and every one of
on May 15, 2020 by guest
http://jcm.asm.org/
the thousands ofS. aureusisolates that we have attempted to
spatype was typeable. Use of the alternative primer used in this study for MSA 2389 is suggested in the very rare instances of nospaamplification (8, 26), which are likely due to sequence mutations in the primer region.
In order to understand whyspatyping is so highly discrim-inating, it is important to analyze two major contributory com-ponents of discriminatory power in a sequence-based VNTR typing system: the background rate of nucleotide mutation within the repeats and the extent of repeat number variation (i.e., variability in repeat region size). According to the neutral theory of evolution, the number of synonymous substitutions per synonymous site (dS) is proportional to the rate of nucle-otide mutation of a gene (15). The dS value forcoawas 0.48, indicating that thesparegion (dS⫽0.72) has an approximately 24% higher background rate of mutation thancoa. This alone does not explain the superior discriminatory power ofspaover
coa typing, since individual spa repeats are usually 57 bp shorter than coa repeats and thus the number of potential synonymous mutation sites is much less insparepeats. Calcu-lations based only on mutation rate showed that coa typing would theoretically be more discriminating than spa typing (data not shown). However, when considering only variation in the number of repeats present among isolates, for the average
spalineage where more than one isolate was present, 73% of isolates varied in number of repeats, compared with just 37% for coa typing. Therefore, typing with spa generated nearly twice the variation in repeat region sizes among related isolates than did typing withcoa. When taking into consideration all factors contributing to discriminatory power, spa typing was able to distinguish, for the average group of related isolates, 89% of isolates, versus 55% for coatyping (versus 100% for the DNA microarray), and thus produced about 1.6 times as much variability as didcoatyping. It is likely that via slipped-strand mispairing (36), the spa repeats are more prone to duplication and deletion because they are smaller than thecoa
repeats. This along with a large dS value contributes to the high discriminatory ability ofspatyping.
The congruence among spa typing, coa typing, PFGE, MLEE, and the DNA microarray indicates low levels of re-combination, a predominantly clonal population structure, and the presence of a phylogenetic signal withinS. aureus. A clonal population structure, as opposed to one of panmixia caused by high rates of recombination, exists when strain progeny diver-sify from their ancestors mainly through nucleotide mutations. Epidemic spread of a highly recombinogenic species in linkage equilibrium may appear to be clonal (32); however, in this study such a structure was ruled out because of the represen-tative nature of the strain collection. Although the majority of isolates used in this study were disease causing, they were selected from over 2,000 disease and carriage isolates as rep-resenting the most abundant lineages and, as shown by the microarray data, certainly contained great diversity. In addi-tion, recent evidence points towards disease-causing popula-tions ofS. aureusbeing either as diverse or even more diverse than carriage populations (11, 25). Previous findings based on MLST showing thatS. aureuswas highly recombinogenic (5, 12) have since been amended due to sequencing errors (5). The revised data set (11) demonstrated thatS. aureus has a
predominately clonal population structure, and our findings corroborate this result.
It is evident that repeat composition and organization, and not the number of repeats, allowspatyping to correlate with the DNA microarray data. Thus, primary assignment of lin-eages is via nucleotide mutation, followed by intralineage vari-ation via addition and deletion of repeats, suggesting that point mutations occur at a much lower rate (clock speed) than repeat number variation. Therefore, through the use of slow point mutations and fast-occurring changes in the number of repeats,
spatyping solves the longstanding impasse in finding one tech-nique that is capable of accumulating genetic variation both as slowly as the major chromosomal changes that distinguish lin-eages occur and rapidly, at two independent levels, enabling it to be used effectively in answering long- and short-term epi-demiologic questions, respectively.
The strong congruence of spa typing’s genotyping results with multiple techniques implies that the single-nucleotide polymorphisms within the repeat region occurred only once, as recombination and repeated mutation would obliterate any compatibility (27). Occurrence of neutral (as evidenced by the dS/dN analysis) mutations due to purifying selection just once at this locus, probably resulting from functional biological con-straints placed on the protein A gene (as opposed to a gene under positive selection or nonexpressed intergenic regions, pseudogenes, etc., under no constraints), along with a clonal population structure within the species, explains how the spa
locus alone can accurately identify strains throughout the breadth of the species and then correctly assign them to lin-eages. These factors, along with the higher rate of nucleotide substitutions and greater variation in repeat number compared with the larger-sized coa repeats, are criteria that give spa
typing the capability of reflecting extensive genome-wide vari-ation withinS. aureus. Using these characteristics as guidelines, we are currently studying single-locus VNTRs for dual use in local and global epidemiologic analyses of other bacteria, such
asE. faecalisandAcinetobacter baumannii, and we predict that
in species with known heterogenous clonal population struc-tures, such asEscherichia coli(18), suitable single-locus mark-ers should be successful. The relatively new ability to analyze and search genomes for polymorphic repeat regions combined with the unique ability of certain minisatellite VNTRs to dis-play two different levels of genotypic information will provide many attractive candidates for use for a variety of strain typing goals and should be studied for all types of microorganisms.
ACKNOWLEDGMENTS
We are grateful to Bo Shopsin for valuable discussion and comments on the manuscript, to Reza Najem for advice on data analysis, and to Irina Koreen, Barun Mathema, and Battouli Saïd-Salim for critical reading of the manuscript.
REFERENCES
1. Appel, R. D., A. Bairoch, and D. F. Hochstrasser.1994. A new generation of information retrieval tools for biologists: the example of the ExPASy WWW server. Trends Biochem. Sci.19:258–260.
2. Behr, M. A., M. A. Wilson, W. P. Gill, H. Salamon, G. K. Schoolnik, S. Rane, and P. M. Small.1999. Comparative genomics of BCG vaccines by whole-genome DNA microarray. Science284:1520–1523.
3. Chang, S., D. M. Sievert, J. C. Hageman, M. L. Boulton, F. C. Tenover, F. P. Downes, S. Shah, J. T. Rudrik, G. R. Pupp, W. J. Brown, D. Cardo, and S. K. Fridkin.2003. Infection with vancomycin-resistantStaphylococcus aureus containing thevanAresistance gene. N. Engl. J. Med.348:1342–1347.
on May 15, 2020 by guest
http://jcm.asm.org/
4. Crisostomo, M. I., H. Westh, A. Tomasz, M. Chung, D. C. Oliveira, and H. de Lencastre.2001. The evolution of methicillin resistance inStaphylococcus aureus: similarity of genetic backgrounds in historically early methicillin-susceptible and -resistant isolates and contemporary epidemic clones. Proc. Natl. Acad. Sci. USA98:9865–9870.
5. Day, N. P., C. E. Moore, M. C. Enright, A. P. Berendt, J. M. Smith, M. F. Murphy, S. J. Peacock, B. G. Spratt, and E. J. Feil.2001. A link between virulence and ecological abundance in natural populations ofStaphylococcus aureus.Science292:114–116. (Retraction,295:971, 2002.)
6. de Lencastre, H., M. Chung, and H. Westh.2000. Archaic strains of methi-cillin-resistantStaphylococcus aureus: molecular and microbiological prop-erties of isolates from the 1960s in Denmark. Microb. Drug Resist.6:1–10. 7. Desjardins, P., B. Picard, B. Kaltenbock, J. Elion, and E. Denamur.1995. Sex inEscherichia colidoes not disrupt the clonal structure of the popula-tion: evidence from random amplified polymorphic DNA and restriction-fragment-length polymorphism. J. Mol. Evol.41:440–448.
8. de Sousa, M. A., M. I. Crisostomo, I. S. Sanches, J. S. Wu, J. Fuzhong, A. Tomasz, and H. de Lencastre.2003. Frequent recovery of a single clonal type of multidrug-resistantStaphylococcus aureusfrom patients in two hospitals in Taiwan and China. J. Clin. Microbiol.41:159–163.
9. Enright, M. C., D. A. Robinson, G. Randle, E. J. Feil, H. Grundmann, and B. G. Spratt.2002. The evolutionary history of methicillin-resistant Staphy-lococcus aureus(MRSA). Proc. Natl. Acad. Sci. USA99:7687–7692. 10. Enright, M. C., and B. G. Spratt.1999. Multilocus sequence typing. Trends
Microbiol.7:482–487.
11. Feil, E. J., J. E. Cooper, H. Grundmann, D. A. Robinson, M. C. Enright, T. Berendt, S. J. Peacock, J. M. Smith, M. Murphy, B. G. Spratt, C. E. Moore, and N. P. Day.2003. How clonal isStaphylococcus aureus? J. Bacteriol.
185:3307–3316.
12. Feil, E. J., E. C. Holmes, D. E. Bessen, M. S. Chan, N. P. Day, M. C. Enright, R. Goldstein, D. W. Hood, A. Kalia, C. E. Moore, J. Zhou, and B. G. Spratt.
2001. Recombination within natural populations of pathogenic bacteria: short-term empirical estimates and long-term phylogenetic consequences. Proc. Natl. Acad. Sci. USA98:182–187.
13. Fitzgerald, J. R., D. E. Sturdevant, S. M. Mackie, S. R. Gill, and J. M. Musser.2001. Evolutionary genomics ofStaphylococcus aureus: insights into the origin of methicillin-resistant strains and the toxic shock syndrome epi-demic. Proc. Natl. Acad. Sci. USA98:8821–8826.
14. Hunter, P. R., and M. A. Gaston.1988. Numerical index of the discrimina-tory ability of typing systems: an application of Simpson’s index of diversity. J. Clin. Microbiol.26:2465–2466.
15. Hurst, L. D.2002. The Ka/Ks ratio: diagnosing the form of sequence evo-lution. Trends Genet.18:486.
16. Kumar, S., K. Tamura, I. B. Jakobsen, and M. Nei.2001. MEGA2: molec-ular evolutionary genetics analysis software. Bioinformatics17:1244–1245. 17. Maiden, M. C., J. A. Bygraves, E. Feil, G. Morelli, J. E. Russell, R. Urwin,
Q. Zhang, J. Zhou, K. Zurth, D. A. Caugant, I. M. Feavers, M. Achtman, and B. G. Spratt.1998. Multilocus sequence typing: a portable approach to the identification of clones within populations of pathogenic microorganisms. Proc. Natl. Acad. Sci. USA95:3140–3145.
18. Milkman, R., and M. M. Bridges.1990. Molecular evolution of the Esche-richia colichromosome. III. Clonal frames. Genetics126:505–517. 19. Mostowy, S., D. Cousins, J. Brinkman, A. Aranaz, and M. A. Behr.2002.
Genomic deletions suggest a phylogeny for theMycobacterium tuberculosis complex. J. Infect. Dis.186:74–80.
20. Musser, J. M., and V. Kapur.1992. Clonal analysis of methicillin-resistant Staphylococcus aureusstrains from intercontinental sources: association of themecgene with divergent phylogenetic lineages implies dissemination by horizontal transfer and recombination. J. Clin. Microbiol.30:2058–2063. 21. National Nosocomial Infections Surveillance System.1999. National
Noso-comial Infections Surveillance (NNIS) System report, data summary from January 1990-May 1999, issued June 1999. Am. J. Infect. Control27:520– 532.
22. Nei, M., and T. Gojobori.1986. Simple methods for estimating the numbers of synonymous and nonsynonymous nucleotide substitutions. Mol. Biol. Evol.3:418–426.
23. Okuma, K., K. Iwakawa, J. D. Turnidge, W. B. Grubb, J. M. Bell, F. G. O’Brien, G. W. Coombs, J. W. Pearman, F. C. Tenover, M. Kapi, C. Tien-sasitorn, T. Ito, and K. Hiramatsu.2002. Dissemination of new methicillin-resistantStaphylococcus aureusclones in the community. J. Clin. Microbiol.
40:4289–4294.
24. Oliveira, D. C., A. Tomasz, and H. de Lencastre.2001. The evolution of pandemic clones of methicillin-resistantStaphylococcus aureus: identification of two ancestral genetic backgrounds and the associated mec elements. Microb. Drug Resist.7:349–361.
25. Peacock, S. J., G. D. de Silva, A. Justice, A. Cowland, C. E. Moore, C. G. Winearls, and N. P. Day.2002. Comparison of multilocus sequence typing and pulsed-field gel electrophoresis as tools for typingStaphylococcus aureus isolates in a microepidemiological setting. J. Clin. Microbiol.40:3764–3770. 26. Peacock, S. J., C. E. Moore, A. Justice, M. Kantzanou, L. Story, K. Mackie, G. O’Neill, and N. P. Day.2002. Virulent combinations of adhesin and toxin genes in natural populations ofStaphylococcus aureus.Infect. Immun.70:
4987–4996.
27. Reid, S. D., C. J. Herbelin, A. C. Bumbaugh, R. K. Selander, and T. S. Whittam.2000. Parallel evolution of virulence in pathogenicEscherichia coli. Nature406:64–67.
28. Robinson, D. A., S. K. Hollingshead, J. M. Musser, A. J. Parkinson, D. E. Briles, and M. J. Crain.1998. The IS1167insertion sequence is a phyloge-netically informative marker among isolates of serotype 6BStreptococcus pneumoniae.J. Mol. Evol.47:222–229.
29. Salama, N., K. Guillemin, T. K. McDaniel, G. Sherlock, L. Tompkins, and S. Falkow.2000. A whole-genome microarray reveals genetic diversity among Helicobacter pyloristrains. Proc. Natl. Acad. Sci. USA97:14668–14673. 30. Shopsin, B., M. Gomez, S. O. Montgomery, D. H. Smith, M. Waddington,
D. E. Dodge, D. A. Bost, M. Riehman, S. Naidich, and B. N. Kreiswirth.1999. Evaluation of protein A gene polymorphic region DNA sequencing for typing ofStaphylococcus aureusstrains. J. Clin. Microbiol.37:3556–3563. 31. Shopsin, B., M. Gomez, M. Waddington, M. Riehman, and B. N. Kreiswirth.
2000. Use of coagulase gene (coa) repeat region nucleotide sequences for typing of methicillin-resistantStaphylococcus aureusstrains. J. Clin. Micro-biol.38:3453–3456.
32. Smith, J., N. Smith, M. O’Rourke, and B. Spratt.1993. How clonal are bacteria? Proc. Natl. Acad. Sci. USA90:4384–4388.
33. Snel, B., P. Bork, and M. A. Huynen.1999. Genome phylogeny based on gene content. Nat. Genet.21:108–110.
34. Spratt, B. G., W. P. Hanage, and E. J. Feil.2001. The relative contributions of recombination and point mutation to the diversification of bacterial clones. Curr. Opin. Microbiol.4:602–606.
35. Tenover, F. C., R. D. Arbeit, R. V. Goering, P. A. Mickelsen, B. E. Murray, D. H. Persing, and B. Swaminathan.1995. Interpreting chromosomal DNA restriction patterns produced by pulsed-field gel electrophoresis: criteria for bacterial strain typing. J. Clin. Microbiol.33:2233–2239.
36. van Belkum, A., S. Scherer, L. van Alphen, and H. Verbrugh.1998. Short-sequence DNA repeats in prokaryotic genomes. Microbiol. Mol. Biol. Rev.
62:275–293.
37. Versalovic, J., V. Kapur, E. O. Mason, Jr., U. Shah, T. Koeuth, J. R. Lupski, and J. M. Musser.1993. Penicillin-resistantStreptococcus pneumoniaestrains recovered in Houston: identification and molecular characterization of mul-tiple clones. J. Infect. Dis.167:850–856.