International Journal of Emerging Technology and Advanced Engineering
Website: www.ijetae.com (ISSN 2250-2459, ISO 9001:2008 Certified Journal, Volume 4, Issue 6, June 2014)
55
An Optimal Var Compensation Strategy Based on Data Mining
and Ant Colony Algorithm
Da XIE, IEEE Member
Dept. of Electrical Engineering, Shanghai Jiao Tong University, Shanghai, China
Abstract—This paper proposes a new algorithm to find the optimization method of reactive regulation in power system to solve the problem of the var compensation and voltage control in center-substations. Using the daily data collected in power substations, the algorithm is combined with improved ant colony algorithm and Apriori data mining techniques. The mathematic model of var optimization of power system are described and applied to resolve the reactive optimal compensation problem of an example substation in Shanghai. Test results show that the application of the new algorithm proposed in this paper for determining the plan of reactive optimization operation can raise the system’s operation efficiency and reduce the power loss. And it is of great economical significance for the system voltage control.
Keywords— Reactive optimization; Ant colony algorithm; Data mining; power system
I. INTRODUCTION
Data mining is to extract or mine useful knowledge from large amounts of data. It is also called knowledge mining from data, knowledge extraction, pattern analysis, data dredging and knowledge discovery in database[1]. The general processes of data mining includes data cleaning and integration, data collection, data transformation, data mining, knowledge evaluation and presentation. The function of data mining includes association analysis, classification and prediction, clustering analysis, outlier analysis, and so on [2-3]. Data mining technology has been applied in many fields such as credit card management, churning analysis and so on. Most researchers focus on the study of data mining model or algorithm [4-6].
Ant colony algorithm is a new method for solving the optimal combination problem[7]. In recent years, researches on the ant colony focus on improving the traditional ant colony algorithm, such as TSP optimal problems and its extended application of the ant colony algorithm to other areas, such as data mining and Knowledge Discovery[8-10].
Electric power system is a large-scale nonlinear inter-connected system. In the continuously running, lots of data are generated and accumulated in the substations.
It is difficult to extract the useful information from these collected data for operators in power system. The application of traditional data mining techniques is continually facing new challenges in power system because an ever increasing amount of data is still being produced at high rates in power system and the analyses of the data often needs to be conducted in real-time and under time constraints[11-12].
In the power system, the data mining technique can take full advantage of these operating data accumulated to reveal the principles and rules that the power system contains and find a rational solution to the problem in power system. This paper focuses on the problem of extracting useful data for effective decision-making of reactive power optimization. It describes the concepts and improvements of association rules algorithm - Apriori algorithm and ant colony algorithm. It takes full advantage of the large number of running data in the substation operation process. The improved Apriori algorithm is applied to determine the reactive power optimal strategy. The overall model based on Apriori algorithm and ant colony algorithm is established for reactive power optimization. An example power substation is used to illustrate the application of the proposed models in the voltage and reactive power automatic control system. Based on historical data, the proposed method is used to get the optimal operating conditions of the optimal solution to guide the practical operation.
II. MODELS
A. Overall Model
International Journal of Emerging Technology and Advanced Engineering
Website: www.ijetae.com (ISSN 2250-2459, ISO 9001:2008 Certified Journal, Volume 4, Issue 6, June 2014)
56 New data Historical data Preparation of the data Rules and knowledge ant colony algorithm The optimal strategy offline online
data mining with Apriori The actual power grid output Confidence level optimization goals
[image:2.612.58.283.102.291.2]Real-time collected data
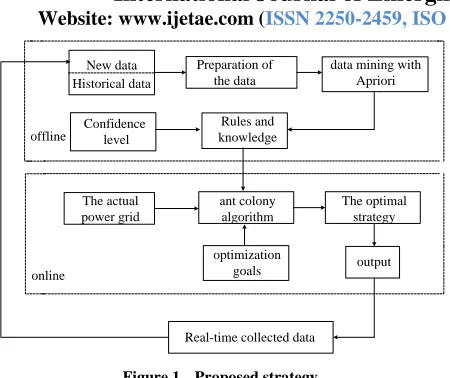
Figure 1. Proposed strategy
It can be divided into two parts: offline and online. The input of the offline part is the historical databases and the output is the associate rule and the confidence level of the historical data calculated by the Apriori algorithm. The frequent items are mined according to the principle that their frequencies are not less than the pre-set minimum support frequency. Based on the frequent items, the corresponding strong association rules are gained. Ant colony algorithm is used to find the optimal strategy of Var power regulation, based on the output association rules of the offline part. And the renew output of the offline part interact with the online strategy.
B. Target Function
The power loss between two points i, j can be represented as i ij i i
l
U
P
f
2
(1)Where,
P
ij is the transported power between i and j; li isthe length of the transmission line;
i is the related comprehensive coefficient.The total power loss can be represented as
n i if
F
11 (2)
The node voltage deviation is
sp j sp j j j
U
U
U
f
2 (3)
The total voltage deviation of all nodes is
n j sp j sp j jU
U
U
F
12 (4)
Where, n is the number of the nodes except the slack bus nodes;
U
spj is the set value of the node voltage;
U
spj is the set value max deviation of the node voltage.The mathematical model of the reactive power optimization can be represented as
k N kF
C
(
F
)
min
1 1
2 2 (5)Where,
1 and
2 are the weight coefficients; Nk is agroup of the numbers of the available capacitors; T
n
e
e
e
E
[
1,
2,...,
]
is the group of the states of theavailable capacitors ; f1 and f2 are the functions of E.
d
disconecte
is
i
capacitor
0
switched
is
i
capacitor
1
ie
The constraints can be represented as following: (i) The constraint of power balance
0
)
cos
sin
(
0
)
sin
cos
(
1 1 ij ij ij ij n i j j i i ij ij ij ij n i j j i iB
G
U
U
Q
B
G
U
U
P
(6)Where, Pi is the injected active power; Qi is the injected
reactive power; Ui and U j are the node voltage; Gij is the
conductance between i and j; Bij is the susceptance
between i and j ;
ij is the electrical angle difference between i and j.(ii) The constraint of node voltage
max
min Ci Ci
Ci
Q
Q
Q
,
U
imin
U
i
U
imax,
max min ij ij
ij
International Journal of Emerging Technology and Advanced Engineering
Website: www.ijetae.com (ISSN 2250-2459, ISO 9001:2008 Certified Journal, Volume 4, Issue 6, June 2014)
57 Where, QCimin is the min available reactive power;
QCimax is the max available reactive power; Uimin is the min
voltage amplitude of node i ; Uimax is the max voltage
amplitude of node i; [Timin , Timax] is adjustment range of
the adjustable transformer i;
i
1
,
2
,...,
n
; Ci is theswitching frequency; Cmin and Cmax are the limits of Ci. If
Ci reaches to Cmax , the capacitor is disabled in the left time.
III. DATA MINING
A. Principle of Association Rules Method
Association rules method is represented simply as
B
A
. Where,AI;B
I
; AB
. The support level ofA
B
isSupport (
A
B
) = P(A∪B) The confidence level ofA
B
is) ( _ sup ) ( _ sup ) ( ) A cofidence( A count port B A count port A B P
B
(8)
Where,
sup
port
_
count
(
A
B
)
is the record number of the items which includeA
B
;)
(
_
sup
port
count
A
is the record number of the itemswhich include A.
The support level indicates the statistical importance of association rules in the whole data set. The confidence level indicates the credibility of the association rules. Generally, the useful association rules are the ones with high support level and confidence level. The data mining process can be divided into two parts: (i) mining the large items set whose general support level is higher than the pre-set value; (ii) get the association rules whose support level is higher than the pre-set minimum support frequency.
B. Improved Apriori Algorithm
The Apriori algorithm proposed by Agrawal in year 1994 is recursive and includes two steps mainly:
(i) get the frequent K- item on the frequent (K-1)- item (ii) calculate the support level of the candidate set on the database scanning and pattern matching.
It can be included that the candidate set is too large and the database is scanned repeatedly in the Apriori algorithm. A improved method without these two drawbacks is applied to the data mining in the historical database of the substations. It is described as follow:
(i) Data preprocessing based on partition. It divides the database of the substation into 9-zones according to the requirement of reactive power and bus voltages.
Then it focuses on the data in the area except the normal running area. So it is time-saving and fast-accessing because it only scans the corresponding area in the database without scanning the whole database.
(ii) Classify with similarity search, according to central substation operation conditions. The association level of the selected data is improved to meet the requirements of practical operation.
IV. ONLINE OPTIMAL ALGORITHM
A. Model of Ant Colony Algorithm
Supposed m is the number of the ants;
b
i(
t
)
is the number of the ants at moment t and element i;
ij(
t
)
is the information in path (i, j) at moment t;d
ij( i,j =1,2,…, n) is the distance between cities i and j. At the beginning,C
)
0
(
ij
(C is constant).When a ant k (k=1,2…,m) is moving, it collects the information in the path to choose the next path. The state transition probability of ant’s shift from city i to city j at moment t is represented as
0
)]
(
[
)]
(
[
)]
(
[
)]
(
[
)
(
k allowed s is is ik k ij k ijallowed
j
t
t
t
t
t
p
k,
(9) Where, allowed k={0,1,…,n-1}-tabu k represents the possible cities allowed to choose in the next step. The artificial ants have the function of memory. Tabu k (k=1,2 …,m) records the city the ant is in now and updates dynamically as the evolutionary process. After a circle withn times, the ant passes all the cities. The path traversed by each ant is a solution. The information in each path is updated as
)
(
)
(
)
1
(
)
(
t
n
ijt
ijt
ij
(10)Where,
m k k ijij
t
t
1
)
(
)
(
(11))
1
,
0
[
International Journal of Emerging Technology and Advanced Engineering
Website: www.ijetae.com (ISSN 2250-2459, ISO 9001:2008 Certified Journal, Volume 4, Issue 6, June 2014)
58
else
,
0
)
j
(i,
path
pass
k
ant
if
,
)
(
kk
ij
L
Q
t
(12)Where, Q indicates the pheromone intensity; Lk is the
total length of the path the ant k passed in this cycle. After several cycles, the calculation ends based on the stop condition.
B. Improvement of Ant Colony Algorithm
The improvement of the ant colony includes:
(i) Selection of parameters: The parameters are dynamically adjusted. At the beginning, the parameters are set at a small value, to avoid "false positive feedback" and "solution loss". When the calculation is running after a certain number of cycles, the parameters are increased to improve the solution quality.
(ii) Modification of the parameters: The state transition probability in (9) is modified according to the results of data mining. The higher the confidence level and the pheromone concentration are, the greater the probability that ants choose.
In the ant k passes path (i, j),
ijk(
t
)
is represented as
ijk(
t
)
= kL
p
Q
(
1
)
(13)
Where, p is confidence level. The tabu table is established according to the results of data mining. And it is updated after each ant’s choice until the new optimal strategy is found.
(iii) Selection of path: First, calculate the reactive power supplied by the capacitor sets in all the substations to establish all the working states. The probable strategies are found out when the reactive power shortfall is compared with the calculated reactive power. The strategies with great difference are aborted. Number the left states and find out the confidence level through data mining.
Second, the path selection strategy in the basic ant colony algorithm is adjusted. The probability of paths that ants choose is set as the confidence levels of the mined association rules. The tabu table of probable choice is listed.
The next path is calculated by the tabu table without randomnes. And the original establishment of tabu table is related to the results of the offline data mining.
C. Calculation of Target Function
(i) Target function for TSP method: The problem of reactive power optimization in substations can be regarded as a TSP problem. A capacitor set can be regarded as a city in TSP method. The switching state is the path between two cities. The function in (5) can be described as
)))
(
(
))
(
(
min(
1
1
ns
n
i
ts
s
e
e
s
ts
(14)Where,
ts
(
s
(
e
n1))
represents the change of target function if there is injected reactive power in the new-added node n .(ii) Constraint conditions: Considering the representation of the constraint conditions of (7) in tabu table, the constraints on voltage and the change of the transformer taps can be ignored.
The switching frequency of capacitor sets is max
min i i
i
C
C
C
. IfC
i
C
imax in a period time, the capacitorC
i will be not allowed to switch again and the value is set to 0 in the left time.V. EXAMPLE ANALYSIS
The improved algorithm is applied to an example system. The diary operating data are available.
A. The Example System
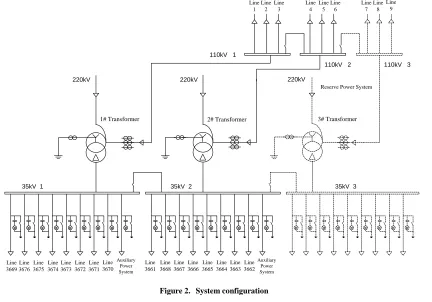
The example center substation is shown in Fig.(1). It has 19 controlled substations, with four 110kV substations and fifteen 35kV substations. All these substations are equipped with reactive compensators and on-load tap-changing transformers. There are 31 sets of capacitors in the system as shown in Table I.
International Journal of Emerging Technology and Advanced Engineering
Website: www.ijetae.com (ISSN 2250-2459, ISO 9001:2008 Certified Journal, Volume 4, Issue 6, June 2014)
59
220kV 220kV 220kV
110kV 1
35kV 1
Line 3669
35kV 2 35kV 3
1# Transformer 2# Transformer
Line 1
110kV 2 110kV 3
3# Transformer
Auxiliary Power System
Line 6 Line
5 Line
4 Line
3 Line
2
Line 9 Line
7 Line
8
Line 3676
Line 3675
Line 3674
Line 3673
Line 3672
Line 3671
Line 3670
Line 3661
Line 3668
Line 3667
Line 3666
Line 3665
Line 3664
Line 3663
Line 3662
Auxiliary Power System
[image:5.612.92.524.125.427.2]Reserve Power System
[image:5.612.335.553.432.645.2]Figure 2. System configuration
Table 1
The Configuration Of The Compensated Reactive Power In Example Substation
Line No. No. Line Available Var
1 1 1252 2400Var
2 1252 3600Var
2 3 1255 2400Var
4 1255 3600Var
3 5 1251 2400Var
6 1251 3600Var
4 7 1254 2400Var
8 1254 3600Var
5 9 3670 3000Var
6 10 3671 3000Var
7 11 3672 1200Var
12 3672 1800Var
8 13 3674 1200Var
14 3674 1800Var
9 15 3676 1200Var
16 3676 1800Var
Line No. No. Line Available Var
10 17 3675 1200Var
18 3675 1800Var
11 19 3669 1200Var
20 3669 1800Var
12 21 3673 1200Var
22 3673 1800Var
13 23 3663 3000Var
14 24 3666 1200Var
25 3666 1800Var
15 26 3667 1200Var
27 3667 1800Var
16 28 3662 3000Var
17 29 3661 3000Var
18 30 3665 1200Var
International Journal of Emerging Technology and Advanced Engineering
Website: www.ijetae.com (ISSN 2250-2459, ISO 9001:2008 Certified Journal, Volume 4, Issue 6, June 2014)
[image:6.612.338.550.98.697.2]60
Table 2
Confidence Of The Mined Association Rules
Association rules Confid-ence
I(y5,01,11)
I(x1,2)^I(x2,0)^I(x3,0)^I(x8,0)^I(x10,0) 1I(y5,10,12)
I(x3,5)^I(x4,7)^I(x15,0)^I(x16,0) 1I(y5,01,11)
I(x1,1)^I(x2,3)^I(x3,0)^I(x4,0) 0.98I(y6B,10,21)
I(x5,9)^I(x7,12)^I(x15,0)^I(x16,0) 0.96I(y6A,00,21)
I(x1,0)^I(x7,11)^I(x10,0)^I(x11,0) 0.96I(y6B,00,12)
I(x3,5)^I(x4,7)^I(x15,0) 0.95I(y6A,00,21)
I(x1,0)^I(x7,11) ^I(x11,0) 0.93I(y5,10,11)
I(x1,1)^I(x2,0)^I(x3,5)^I(x4,0) 0.93I(y5,00,11)
I(x1,1)^I(x2,3)^I(x3,0)^I(x4,0) 0.92I(y6A,00,11)
I(x1,1)^I(x2,0)^I(x5,9)^I(x7,11) 0.90I(y6A,10,11)
I(x1,0)^I(x2,3)^I(x5,9)^I(x7,11)^I(x16,0) 0.90I(y6A,10,11)
I(x1,0)^I(x2,3)^I(x5,9)^I(x7,11)^I(x16,0) 0.90The parameters are
=
0
.
5
,
=
1
,
=0.4 before the 1/4 calculation period and
=
1
,
=
3
,
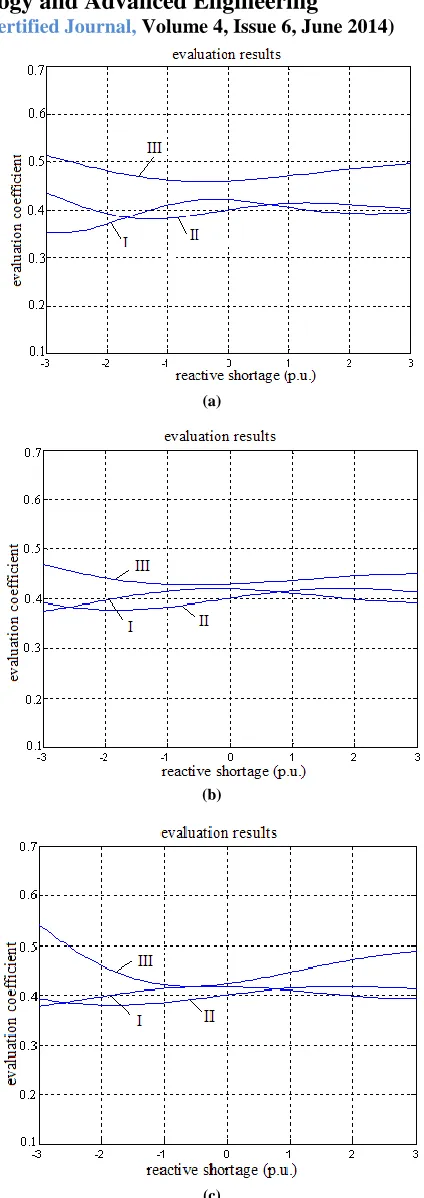
=0.8 later. Q is calculated by (13). So the information in the path is enlarged and the computational complexity is reduced to find the optimal solution quickly.The Fig.3 are the evaluation results when the reactive difference of 110kV buses changes continuously. Where, (I) aims at the min of the net loss; in other words,
1
1
,0
2
in (5); (II) aims at the min node voltage deviation; in other words,
1
0
,
2
1
in (5). The evaluationfunction is as (15).
NL i
i i N
k
f
C
F
F
k
2 2
2 1
1
F
)
(
(15)Where,
F
1 is shown in (2);f
2j is shown in (3);
1
N
L
f
2j
. If the node voltage exceeds a givenmaximum deviation voltage of the node, the corresponding coefficient Ci increase as a punitive options.
When the 35 kV bus coupler switch is disconnected and 110 kV bus coupler switch is closed, the compensating results are shown in Fig. 3 (a). When the 35 kV bus coupler switch is closed and 110 kV bus coupler switch is disconnected, the compensating results are shown in Fig.3 (b). When the 35 kV bus coupler switch and 110 kV bus coupler switch are disconnected, the compensating results are shown in Fig.3 (c).
(a)
(b)
[image:6.612.38.299.143.377.2](c)
International Journal of Emerging Technology and Advanced Engineering
Website: www.ijetae.com (ISSN 2250-2459, ISO 9001:2008 Certified Journal, Volume 4, Issue 6, June 2014)
61 From Fig.3, it can be concluded that the overall compensation result with optimized strategy is better than that of the old switching method (III). The evaluation coefficient can not achieve to 0 which means fully compensated. The over-compensation results from the step reactive power regulation with capacitors in Table.I.
VI. CONCLUSION
In this paper, Apriori algorithm has been improved and applied to substation data mining process. The strong association rules are generated based on the actual operating data. Ant colony algorithm is applied to get the optimal solution of reactive power allocation in substations. The state transition probability formula is amended and parameters are dynamically adjusted in this ant colony algorithm. The choice of the ant’s path to the next node is determined by the tabu table formulated according to the confidence level of the data mining. The switching strategy of the capacitor sets are given by online algorithm. An example substation system is described to test the algorithm proposed in this paper. Experimental results show that, reactive power optimization method based on data mining system can improve the system efficiency, reduce power loss, and have a great significance of stable operation. REFERENCES
[1] Qi Luo, ―Advancing Knowledge Discovery and Data
MiningKnowledge Discovery and Data Mining,‖ 2008. WKDD 2008. International Workshop on23-24 Jan. 2008 pp.3-5.
[2] Xindong Wu, ―Data mining: artificial intelligence in data analysis,‖
Proceedings. IEEE/WIC/ACM International Conference
onIntelligent Agent Technology, 2004. (IAT 2004). pp.7
[3] Aihua Li, Lingling Zhang, ―A Study of the Gap from Data Mining to Its Application with Cases, Business Intelligence and Financial Engineering,‖ 2009. BIFE '09. International Conference on 24-26 July 2009 pp.464 - 467
[4] Dingli Song, Bingru Yang, Zhen Peng, and Weiwei Fang, ―Study of cost-sensitive ant colony data mining algorithm,‖ Industrial Mechatronics and Automation, 2009. ICIMA 2009. International Conference on15-16 May 2009 pp.488 – 491.
[5] P. Brierley, B. Batty, ―Neural Data Mining and Modeling for Electric Load Prediction,‖Knowledge Discovery and Data Mining (1998/434), IEE Colloquium on 8 May 1998 , pp.6/1.
[6] S J.A.teele, J.R.McDonald, and C.D'Arcy, ―Knowledge discovery in databases: applications in the electrical power engineering domain,‖ IT Strategies for Information Overload (Digest No: 1997/340), IEE Colloquium on 3 Dec. 1997, pp.8/1 - 8/4.
[7] L.Admane , K.Benatchba, M.Koudil, M.Drias, S.Gharout,
N.Hamani, ―Using ant colonies to solve data-mining problems,‖ Systems, Man and Cybernetics, 2004 IEEE International Conference on Volume 4, 10-13 Oct. 2004 pp.3151 - 3157 vol.4 .
[8] S. Madan, K. E. Bol Linger, ―Artificial Intelligence Assisted Voltage Stability Enhancement,‖ Canadian Conference On Electrical and Computer Engineering. 1996(1), pp.392-395.
[9] P. S. Shelokar, V. K. Jayaraman, B. D. Kulkarni, ―An ant colony classifier system: application to some process engineering problems,‖ Computers and Chemical Engineering 28 (2004) 1577-1584.
[10] WANG Zhigang, YANG Lixi, CHEN Genyong. ―Ant Colony
Algorithm for Distribution Network Planning,‖ Proceedings of the EPSA. 2002, 14(6):73-76.
[11] BAO Wen,YU Daren,WANG wei,XU Zhiqiang. SENSOR FAULT
DETECTION IN THERMAL POWER PLANTS BASED ON ASSOCIATION RULE.Proceeding of the CSEE. Vol.23,No.12, Dec.2003, pp.170-175.
[12] LI Jianqiang, NIU Chenglin,LIU Jizhen. Application of Data Mining Technique in Optimizing the Operation of Power Plants. Joumal of Power Engineering. 2006,12. Vol.26,No.6,:830-835.
BIOGRAPHIES