2018 International Conference on Applied Mechanics, Mathematics, Modeling and Simulation (AMMMS 2018) ISBN: 978-1-60595-589-6
Innovative Performance Evaluation in Innovation-oriented Enterprises
Based on Fuzzy Benchmark
Hong-tao ZHANG and Hui WANG*
School of Science, Zhejiang Agriculture and Forestry University, Hangzhou, 311300, China *Corresponding author
Keywords: Innovative performance evaluation, Fuzzy benchmark, Evidential reasoning,
Innovation-oriented enterprise.
Abstract. Since it was difficult to identify a benchmark for innovative performance evaluation in innovation-oriented enterprises, the paper proposes a performance evaluation method based on fuzzy benchmark. Firstly, a construction way of fuzzy benchmark for innovative performance evaluation indicator is given by multi-experts. Then the quantitative indicators performance are converted to beliefs based on the fuzzy benchmark, and the qualitative indicators performance are given by belief structure directly. In addition, the performance of qualitative and quantitative indicators are aggregated by the evidential reasoning algorithm. Finally, the innovative performance of an innovation-oriented enterprise in Anhui Province is evaluated based on fuzzy benchmark, to show the feasibility and validity of this method.
Introduction
Since 2006, the Ministry of Science and Technology, State-owned Assets Supervision and Administration Commission of the State Council, and All-China Federation of Trade Unions had jointly launched innovation-oriented enterprise pilot work and a number of domestic scholars had performed plenty of significant researches on measurement, innovation ability evaluation system as well as evaluation methodology for innovation-oriented enterprises from different point of views. For instance, Zhang et al.[1] put forward some recommendations on innovation-oriented enterprise measurement and identification criteria via entrepreneur questionnaire. Li[2], Zhao et al.[3] assessed relative effectiveness of proprietary innovation capability in enterprises by means of DEA methodology, and analyzed causes for invalid DMU. Mei et al.[4] carried out practical demonstration analysis on independent capability of high-tech enterprises by applying BP neural network model. Luo [5] performed demonstration study on proprietary innovation ability of large and medium-sized industrial enterprises in 30 provinces and cities with factor analysis; Guo et al.[6] established an integrated evaluation model which is based on AHP-conversion of membership degree algorithm for proprietary innovation capabilities in enterprises.
significance to know how to assess innovation capabilities of innovation-oriented enterprises based on region and industry by means of proper evaluation benchmark identified by group experts.
The rest of this paper is organized as follows. In the next section, a fuzzy innovative performance benchmark in innovation-oriented enterprises was constructed based on the understanding of various experts on all innovation indicators. On account of concurrence of qualitative information and quantitative information, uncertain information and incomplete information, the evaluation information was aggregated by the evidential reasoning algorithm. In section 3, we take an innovation-oriented enterprise in Anhui Province as an example to show the detailed implementation process of the proposed method. Finally, we conclude this paper in Section 4.
Innovation Capability Evaluation Methodology Based on Fuzzy Benchmark
Supposing that Ai (i1, 2,...,M)refers to No. i innovation-oriented enterprise with attribute set
j 1, 2,...,
C C,j R in innovation capability indicator system, where attribute set Ccomprises
two mixed attributes: quantitative attribute set
11
1
, 1, 2,...,
j
C C j d and qualitative attribute set
2
2
2
, 1, 2,...,
j
C C j d d R . Let expert group set beD
D kk, 1, 2,...,K
k2
, where Dkrefers to No.
k
expert.Supposing that the experts divide indicator value into Nevaluation levels: H H1, 2, , Hn, ,HN as per certain standard. Firstly, group experts give evaluation benchmarks at different levels to assess each indicator in terms of quantitative attribute; and give their own evaluation with beliefs based on specific situation in enterprises in terms of qualitative attribute. Then the evaluation information from the experts on each indicator was aggregated and the evaluation information on the multi-indicators was integrated to form the comprehensive evaluation of the innovation capabilities in enterprises.
Determination of Fuzzy Benchmark
If N evaluation levels are regarded as N fuzzy languages, semantics of which can be represented by triangular fuzzy number. Semantics of comment Hn is Fn (a g bn, n, n), n1, 2, ,N. In terms of quantitative indicator
1
j
C in innovation capability of innovation-oriented enterprise, supposing that
( 1, 2, , ;
k n
g k K n1, 2, ,N) refers to that the indicator is commented as benchmark value of
n
H given by No. k expert. The benchmark values can be deemed as possibility distribution of a benchmark value which may generate a triangular fuzzy number (fuzzy benchmark). The benchmark value are defined as follows: See the following for details:
(1) Methodology for determination of triangular fuzzy number center[7]
① Find out distance between two gk n benchmark value of Hn, and build matrix of distance between two scores: D[dkl P P] , which dkl |gkngln|, ,k l1, 2, ,K.
② Average relative distance of gkn is
1 / ( 1)
K
k k l
k
d
d K . The average distance is used to measure proximity between benchmark value of Hn and fuzzy center given by No. K expert. Thesmaller dk is, the closer the benchmark value gk ngiven by the No. k expert is to the triangular fuzzy
number center. This indicates that the expert weights more in the calculation of triangular fuzzy number center.
[ kl K K]
P p , where pkl dk /dl, pkl shows relative importance of gk n to gln. Obviously, pkk 1 and
1/
kl lk
p p , i.e. matrix P[pkl K K] is a multiplicative judgment matrix.
④ Find out relative importance of benchmark value gk n
1
1/ K , 1, 2, ,
l k kl
w
p l K . (1)⑤ The central value gnof triangular fuzzy number for Hn can be defined as
1 , 1, 2, ,
K
n k k kn
g
w g n N . (2)(2) Methodology for determination of two end-points in triangular fuzzy number
Set an gngn1 and bngn1gn as left-right divergence(n2, 3, N1), language scale H1 andHN respectively are fuzzy numbers of upper limit measurement and lower limit measurement, right divergence and left divergence respectively areb1g2g1 and aN gN gN1.
Methodology for Multiple-Attribute Group Expert Information Aggregation Based on Evidential Reasoning
Evidential reasoning (ER) methodology [8] is an improved composite method for evidence based on D-S evidence theory [9], which has attracted wide attention from scholars from home and abroad.
Supposing that there are R information sources (indicators) under alternative
i
A (i1, 2, ...,M) evaluated E A1( ),i E A2( ),i ,ER( )Ai , weight of R information sources
is w{ ,w w1 2, ,wR} , which satisfies:
1 1, 0,
R
j j
j w w
j1, 2, ,R . Set1 2
{ , , , n, , N}
H H H H H as the frame of discernment. j n, ( j1, 2, ,R;n1, 2, ,N) refers to
reliability level of information from information source Ej(Ai) which is commented asHn, which
satisfies: , ,
1 1, 0,
N
j n j n
n
(j1, 2, ,R).Supposing that mj n, means level of supporting programAi of information source Ej(Ai) to be
evaluated as Hn, which is known as basic reliability level;mj H, refers to reliability level of those not
distributed, i.e. remaining probability of supporting programAi of information sourceEj(Ai)to be
evaluated as level H H1, 2, ,HN, which satisfies:
, , ,
j n j j n
m w n1, 2, ,N (3)
, 1 1 , 1 1 ,
N N
j H n j n j n j n
m
m w
, (4)Decompose mj H, into two parts mj H, and mj H,
[8]
, ,
,H j j H
j H
m m m (5) where
, 1
j H wj
m
, , (1 1 , )
N
H j j n
n
j w
m
(6), , ,
1 1
[ ( ) ]
R R
n j n j H j H
j j
k m m m
, ,
1 1
[ ]
R R
j H
H j H
j j
k m m
(8)where , , , , 1
1 1 1 1
[ ( ) ( 1) ]
R R R
N
j n j H j H j H
n j j j
k m m N m m
,n
refers to reliability level of the program
to be evaluated asHn,Hrefers to reliability level of the program to be evaluated to an unknown level.
In terms of quantitative indicator
1 1 1, 2,...,j
C j d , membership
1, j n
under evaluation level Hn
of the indicator of an enterprise evaluated can be found out as per fuzzy benchmark given by group expert. And according to the membership, beliefs of each evaluation level that an enterprise belongs to can be gotten under all quantitative indicators. As the nature of membership function,
1, j n
satisfies
1,
0j n 1. However, since definition of each evaluation level is not exclusive, so probably
1,
1 1
N j n
n
. Normalization processing of this shall be:1 1
1 , ,
, 1
j n
j n N
j n n
, n1, 2, ,N (9)
where,
1, j n
indicates the beliefs of enterprise evaluated Ai as level Hn under quantitative indicator
1 j
C based on fuzzy benchmark established by a number of experts. Therefore, evaluation
information of d quantitative indicator given by the experts can be represented as follows:
1 {( , 1, ), 1, 2, , }, 1 1, 2,...,
j n j n
PC H n N j d (10)
In terms of qualitative indicator
2 2 1,...,j
C j d R , evaluation information can be given by No.k
expert:
2
{( , k ), 1, 2, , }, 1, 2, ,
k n j n
E H n N k K (11)
Supposing that weights of K experts are v v1, 2, ,vK respectively, then evaluations of qualitative indicator
2 j
C from K experts can be integrated by evidential reasoning algorithm as formula (3)-(8),
and the evaluation from group expert under qualitative indicator 2 j
c
can be noted as follows:2 {( , 2, ), 1, 2, , }, 2 1, 2,...,
j n j n
PC H n N j d d R (12)
The comprehensive evaluation information by group experts of R indicators can be expressed by formula (10) and (12). Supposing that weight vectors of R indicators arew w1, 2, ,wR, the evaluation information of R attributes given by group experts can be integrated by the evidential reasoning algorithm as formula (3)-(8) and the comprehensive performance evaluation on innovation-oriented enterprise Ai from group experts can be obtained, noted as PAi.
{( , ), 1, 2, , }
i n n
PA H n N (13)
Case Analysis
Due to limited space, the paper only presents evaluation on innovation resource input capability of innovation-oriented enterprise A in automobile manufacturing industry in Anhui Province, which were consist of six incators, such as intensity of R&D funds (C11), R&D personnel intensity (C12),
intensity of R&D organizations (C13), ability of raising external R&D expenditure (C14), input level of
linguistic evaluation terms were defined as H={excellent (H1), good (H2), medium (H3), poor ( H4 )} and five experts were invited for assessing the innovative performance in the innovation-oriented enterprise.
Firstly, the five experts were asked to give weight to each level-one and level-two indicator. Then the average weights of each attribute from the five experts were found out.
[image:5.595.58.540.225.519.2]Secondly, five experts were invited to give evaluation benchmark for quantitative indicators. In terms of qualitative indicator, the experts were asked to give the evaluation on the second level indicators with belief structure. The evaluation information from five experts can be seen as Table 1.
Table 1. Indicators weights, indicator value of enterprise A and evaluation information from five experts.
Indicators for level-one Indicators for level-two Weights for level-two indicators Values of indicators Expert’s (E1)
evaluation
Expert’s (E2)
evaluation
Expert’s (E3)
evaluation
Expert’s (E4)
evaluation
Expert’s (E5)
evaluation
Innovation resource input
(C1)
C11 0.256 0.0515 H1-0.05,
H2-0.035,
H3-0.02,
H4-0.01
H1-0.08,
H2-0.05,
H3-0.03,
H4-0.01
H1-0.07,
H2-0.045,
H3-0.03,
H4-0.015
H1-0.06,
H2-0.04,
H3-0.025,
H4-0.01
H1-0.05,
H2-0.04,
H3-0.03,
H4-0.02
C12 0.201 0.1199 H1-0.25,
H2-0.2,
H3-0.15,
H4-0.1
H1-0.3
H2-0.22
H3-0.12
H4-0.05
H1-0.28
H2-0.2
H3-0.12
H4-0.04
H1-0.25
H2-0.18
H3-0.1
H4-0.05
H1-0.3
H2-0.2
H3-0.1
H4-0.04
C13 0.175 2.4 H1-3.2
H2-2
H3-1.2
H4-0.4
H1-3.6
H2-2.4
H3-1.2
H4-0.4
H1-4
H2-2.8
H3-1.6
H4-0.4
H1-2.8
H2-2
H3-1.2
H4-0.4
H1-2.8
H2-2
H3-1.2
H4-0.4
C14 0.156 0.1399 H1-0.15
H2-0.1
H3-0.05
H4-0.02
H1-0.2
H2-0.12
H3-0.05
H4-0.01
H1-0.15
H2-0.1
H3-0.05
H4-0.02
H1-0.18
H2-0.12
H3-0.06
H4-0.02
H1-0.2
H2-0.13
H3-0.06
H4-0.01
C15 0.112 0.0816 H1-0.08
H2-0.05
H3-0.02
H4-0.005
H1-0.05
H2-0.04
H3-0.02
H4-0.01
H1-0.06
H2-0.04
H3-0.02
H4-0.005
H1-0.05
H2-0.03
H3-0.01
H4-0.001
H1-0.06
H2-0.04
H3-0.02
H4-0.005
C16 0.100 Qualitative
indicator
((H1,0.1),
(H2,0.7),
(H3,0.1))
((H2,0.6),
(H3,0.4))
(H2,0.8) ((H1,0.2),
(H2,0.7),
(H3,0.1))
( (H2,0.2),
(H3,0.7))
As per evaluation information from five experts listed in Table 1, fuzzy benchmark value of quantitative indicator evaluation level could be concluded by using methodology mentioned in 2.1, which could be referred to in Table 2.
Table 2. Fuzzy Benchmark for Quantitative Indicator Evaluation Level of Innovative Resource Input C1
Indicator Fuzzy Benchmarks for Quantitative Indicators
Excellent(H1) Good(H2) Average(H3) Poor(H4)
C11 (0.042, 0.061, —) (0.028, 0.042, 0.061) (0.012, 0.028, 0.042) (—, 0.012, 0.028)
C12 (0.2, 0.277, —) (0.116, 0.2, 0.277) (0.05, 0.116, 0.2) (—, 0.05, 0.116)
C13 (2.154, 3.227, —) (1.22, 2.154, 3.227) (0.4, 1.22, 2.154) (—, 0.4, 1.22)
C14 (0.115, 0.177, —) (0.053, 0.115, 0.177) (0.017, 0.053, 0.115) (—, 0.017, 0.053)
C15 (0.04, 0.058, —) (0.019, 0.04, 0.058) (0.005, 0.019, 0.04) (—, 0.005, 0.019)
For the quantitative indicator
1 j
C , the belief
1, j n
to level Hn (n1, 2, 3, 4) under indicatorj1 could be gotten by fuzzy benchmark, while the evaluation information from group experts for qualitative indicator
2 j
C was aggregated by the evidential reasoning algorithm. The comprehensive evaluation
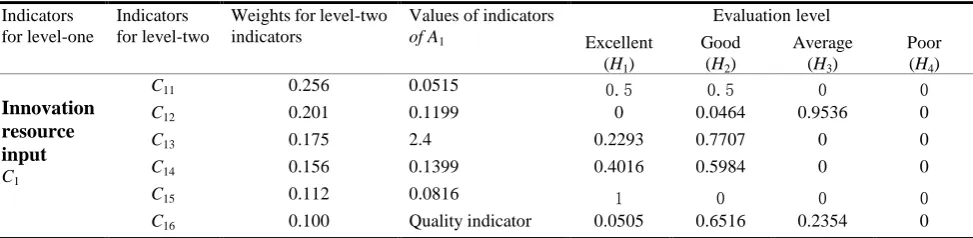
[image:5.595.72.525.591.688.2]Table 3. The belief structure evaluation information under indicator C1 in enterprise A.
Indicators for level-one
Indicators for level-two
Weights for level-two indicators
Values of indicators of A1
Evaluation level Excellent
(H1)
Good (H2)
Average (H3)
Poor (H4)
Innovation resource input
C1
C11 0.256 0.0515 0.5 0.5 0 0
C12 0.201 0.1199 0 0.0464 0.9536 0
C13 0.175 2.4 0.2293 0.7707 0 0
C14 0.156 0.1399 0.4016 0.5984 0 0
C15 0.112 0.0816 1 0 0 0
C16 0.100 Quality indicator 0.0505 0.6516 0.2354 0
According to weights of level-two indicators under C1: w1{0.256, 0.201, 0.175, 0.156, 0.112, 0.100}, aggregation of all level-two indicators under C1 was performed by applying evidential reasoning
estimator and conclude evaluation result of enterprise A under indicator C1:
2 4
1( ) {( 1,0.3495),( ,0.4535), (H3, 0.1921), ( , 0)}
PC A H H H
That is to say, reliability of innovative resource input in enterprise A evaluated as “excellent” was 34.95%, “good” was 45.35%, “medium” was 19.21% and 0.49% with unknown level under indicator C1.
Conclusions
It was usually difficult to obtain evaluation benchmark information during evaluation of innovative performance in innovation-oriented enterprises. Moreover, a significant difference existed in innovative performance in different industries and regions, which resulted in a huge difference in evaluation benchmark. The paper introduces methodology for establishment of fuzzy numbers based on benchmark information from experts and presents methodology for determination of fuzzy benchmark based on group expert comments. In consideration of characteristics in co-existence of quantitative, qualitative information, uncertain and incomplete information in innovative performance evaluation in innovation-oriented enterprise, the paper introduces evidential reasoning estimator to aggregate information on multiple experts and properties which finally helps to conclude evaluation result of the innovative performance. The paper also gives evaluation of innovation capability in an innovation-oriented enterprise with the above-mentioned evaluation model. Evaluation result indicates that evaluation indicator system established herein works reasonably and the evaluation methodology works feasibly.
Acknowledgements
The authors thank the anonymous referees for their insightful and constructive comments and suggestions that have led to an improved version of this paper. This work was supported by Zhejiang Provincial Natural Science Foundation of China (Project No. LQ15G010006) and The talent project of Zhejiang Agricultural and Forestry University (2015FR001, 2015FR011).
References
[1] Zhang Jinshui, Zhang Zhitong, Research on Measurement Standard for Innovation-oriented Enterprises [J]. Scientific Management Research, 2006, 26(10): 27-29.
[2] Lin Xiangyi, Zhang Qingpu, Luo Hongyun, Research on Evaluation and Improvement of DEA-based Independent Innovation Capability in Enterprises [J]. Planning and Management, 2009, 18(4): 152-158.
[4] Mei Qiang, Fan Qian, Research on the Capability Evaluation of Independent Innovation for High-tech Enterprises Based on BP Neural Network [J]. Scientific Management Research, 2011(11):1-4.
[5] Luo Dengyue, Research on Independent Innovation Capability in Enterprises Based on Factor Analysis [J]. Scientific Management Research, 2010, 30(8):11-13.
[6] Guo Caiyun, Liu Zhiqiang, Evaluation of Independent Innovation Capability in Enterprises Based on AHP-membership Conversion [J]. Science and Management, 2010, 30(8):11-13.
[7] Cheng C B. Group opinion aggregation based on a grading process: A method for constructing triangular fuzzy numbers[J]. Computers & Mathematics with Applications, 2004, 48(10): 1619-1632.
[8] Yang J B, Xu D L. On the evidential reasoning algorithm for multiple attribute decision analysis under uncertainty[J]. Systems, Man and Cybernetics, Part A: Systems and Humans, IEEE Transactions on, 2002, 32(3): 289-304.