Georgia State University
ScholarWorks @ Georgia State University
Public Health Theses School of Public Health
7-26-2007
Implications in Using Monte Carlo Simulation in
Predicting Cardiovascular Risk Factors among
Overweight Children and Adolescents
Stephen Matthew Heimbigner
Follow this and additional works at:https://scholarworks.gsu.edu/iph_theses Part of thePublic Health Commons
This Thesis is brought to you for free and open access by the School of Public Health at ScholarWorks @ Georgia State University. It has been accepted for inclusion in Public Health Theses by an authorized administrator of ScholarWorks @ Georgia State University. For more information, please contact
Recommended Citation
Heimbigner, Stephen Matthew, "Implications in Using Monte Carlo Simulation in Predicting Cardiovascular Risk Factors among Overweight Children and Adolescents." Thesis, Georgia State University, 2007.
Abstract
The prevalence of overweight and obesity among children and adolescents has increased considerably over the last few decades. As a result, increasing numbers of American children are developing multiple risk factors for cardiovascular disease, type II diabetes, hyperinsulinemia, hypertension, dyslipidemia and hepatic steatosis.
This thesis examines the use of Monte Carlo computer simulation for understanding risk factors associated with childhood overweight. A computer model is presented for predicting cardiovascular risk factors among overweight children and adolescents based on BMI levels.
The computer model utilizes probabilities from the 1999 Bogalusa Heart Study authored by David S. Freedman, William H. Dietz, Sathanur R. Srinivasan and Gerald S.
Berenson. The thesis examines strengths, weaknesses and opportunities associated with the developed model. Utilizing this approach, organizations can insert their own
Implications in using
Monte Carlo Simulation
in Predicting Cardiovascular Risk Factors
among Overweight Children and Adolescents
A Stochastic Computer Model
based on probabilities from the Bogalusa Heart Study
July 17, 2007
By Stephen Heimbigner
Georgia State University Institute of Public Health
A thesis submitted to the Faculty of the Graduate School of Georgia State University in partial fulfillment of the requirements for the Degree of Master of Public Health
Approval
Implications in using Monte Carlo Simulation in Predicting Cardiovascular Risk Factors among Overweight Children and Adolescents
A Stochastic Computer Model based on probabilities from the Bogalusa Heart Study
By
Stephen Heimbigner
Approved:
__ Russ Toal _______________________ Professor Russ Toal
Committee Chair
__Dr. Michael Eriksen _______________ Dr. Michael Eriksen
Committee Member
__ Dr. Valerie Hepburn ______________ Dr. Valerie Hepburn
Acknowledgements
First, I wish to express my gratitude to the faculty of Georgia State’s University of Public Health for their commitment and dedication to excellence in teaching. I sincerely thank my committee members - Professor Russ Toal, Dr. Michael Eriksen and Dr. Valerie Hepburn for their dedication to this project. Thank you for all the opportunities you provided me throughout the program and for going above and beyond to assist me personally in my career.
I thank Dr. David Freedman and Dr. William Dietz for their contributions to this project.
I thank my friends and fellow students for their support and for the long hours spent working on team projects.
Author’s Statement
In presenting this thesis as a partial fulfillment of the requirements for an advanced degree from Georgia State University, I agree that the Library of the university shall make it available for inspection and circulation in accordance with its regulations governing materials of this type. I agree that permission to quote from, to copy from, or to publish this thesis may be granted by the author or, in his absence, by the Associate Dean, College of Health and Human Sciences. Such quoting, copying, or publishing must be solely for scholarly purposes and will not involve potential financial gain. It is understood that any copying from or publication of this dissertation which involves potential financial gain will not be allowed without the permission of the author.
___Stephen M. Heimbigner____________
Notice to Borrowers
All theses deposited in the Georgia State University library must be used in accordance with the stipulations prescribed by the author in the preceding statement.
The author of this thesis is:
Stephen Heimbigner 2746 Rocky Trail Ct. Dacula, GA 30019
The Chair of the Committee for this thesis is: Professor’s Name: Professor Russ Toal Department: Institute of Public Health College: Health and Human Sciences
Georgia State University P.O. Box 4018
Atlanta, Georgia 30302-4018
Users of this thesis who are not regularly enrolled as students at Georgia State University are required to attest acceptance of the preceding stipulation by signing below. Libraries borrowing this thesis for the use of their patrons are required to see that each user records here the information requested.
NAME OF USER ADDRESS DATE TYPE OF USE:
(EXAMINATION ONLY OR
Vita
Stephen M. Heimbigner 2746 Rocky Trail Ct.
Dacula, GA 30019
678.485.2709 (Home) 404.927.4746 (Work) [email protected]
EDUCATION
January 2005 - Georgia State University
August 2007 College of Health and Human Sciences Atlanta, Georgia
Master of Public Health
August 1993 - Georgia Institute of Technology December 1997 College of Engineering
Atlanta, Georgia
B. S. Industrial and Systems Engineering
PROFESSIONAL EXPERIENCE
January 2005 - Georgia State University August 2007 Institute of Public Health Atlanta, Georgia
Graduate Research Assistant
Member of the Policy Leadership for Active Youth (PLAY) research team. Identified research-based strategies for increasing physical activity, decrease sedentary
behaviors and prevent childhood overweight.
Participated on the University System of Georgia (USG) Task Force on Health Professions Education. Final report available at http://www.usg.edu/pubs/ Developed statistical tools for evaluating the Governor’s Pilot Mental Health Diversion Program.
May 2006 – Centers for Disease Control and Prevention [CDC]
December 2006 Coordinating Center for Environmental Health and Injury Prevention Atlanta, Georgia
Public Health Student Practicum Assignment
Provided technical guidance for development of a National Environmental Public Health Tracking Network. Created policies for role-base access control. Defined network security, data and workflow requirements.
January 2002 Electronic Data Systems Corporation [EDS] - Present AT&T Account (December 2006 – Present) Atlanta, Georgia
Systems Engineer – Contractor
PROFESSIONAL EXPERIENCE CONT.
BellSouth Account (January 2002 – December 2006) Atlanta, Georgia
Project Engineer – Contractor
Served as project manager and technical implementation lead for the midrange strategic reengineering initiative. Implemented centralized system administration resulting in a 26% savings of required midrange resources. Increased productivity and customer satisfaction through implemented of a “team-based” organizational model. Reduced BellSouth midrange system outages by 25% through implementation of “root-cause” and “permanent-fix” methodologies. Redesigned “change and problem management” processes and workflows resulting in a 31% reduction in average outage duration on midrange systems.
Implemented statistical control methodologies and tools resulting in proactive resolution of service delivery issues. Developed automated standards for midrange system and security upgrades resulting in a 21% reduction of cycle times.
Provided on-call Solaris system administrator support for production, pre-production and development environments.
October 2000 - BellSouth Telecommunication Systems Inc. January 2002 Atlanta, Georgia
Business Process Engineer
Managed deployment of BMC monitoring software resulting in centralized capacity management. Provided leadership and facility planning for the opening of a new data center.
January 1998 - Central Intelligence Agency / National Security Agency September 2000 Langley, Virginia
Business Process Engineer
Improved delivery of intelligence through implementation of real-time collaborative tools. Managed and directed the activities of two time staff employees, three full-time contractors and a cooperative education student.
April 1997 – Southern Regional Medical Center January 1998 Riverdale, Georgia
Management Engineer Student
Reduced operational costs and patient wait times in ambulatory care through development of a centralized pre-operational testing and admissions department.
SKILLS
Solaris 10, WebLogic, Java, C++, HTML, SPSS, Minitab
SQL, PL/SQL, SQL*Plus, Oracle 10g RAC, Microsoft Access, Crystal Reporting Workflow / Data Modeling, Simulation Analysis, Visio, Forecasting, MS Project Lean Manufacturing, Six-Sigma, Statistical Process Control, TQM
PROFESSIONAL MEMBERSHIPS
Table of Contents
Acknowledgments...iii
I. Introduction ... 1
II. Background ... 1
Chronic disease... 3
Overweight – A major contributor to chronic disease... 3
Health related consequences of child and adolescent overweight... 4
Tracking overweight: National Health and Nutrition Examination Surveys (NHANES)6 Tracking overweight: Centers for Disease Control growth charts ... 7
Defining overweight in children and adolescents... 9
Quetelet index... 9
Trends in tracking overweight among U.S. children and adolescents... 11
III. Literature review ... 11
Monte Carlo modeling... 12
Overview of the Bogalusa Heart Study ... 13
Simulation and Probability Theory... 18
IV. Model Development... 19
@RISK Version 4.5.3... 20
Model assumptions ... 20
Model inputs ... 21
Cardiovascular risk factors of childhood and adolescent overweight ... 22
Model outputs ... 26
V. Discussion ... 29
Simulation results for adolescents 5 to 10 years of age... 29
Simulation results for adolescents 11 to 17 years of age... 35
Multiple risk factor analysis ... 40
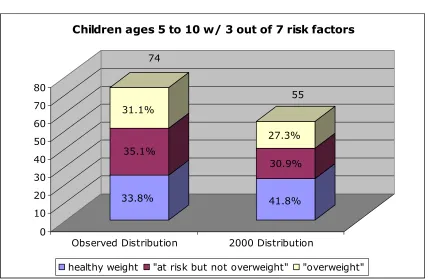
Total number of co-existing risk factors for children 5 to 10 years of age ... 40
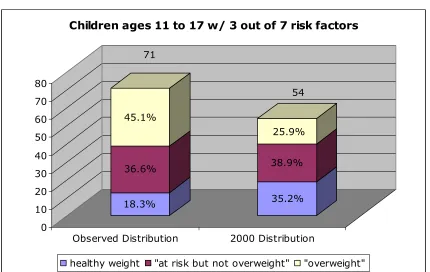
Total number of co-existing risk factors for children 11 to 17 years of age. ... 42
Changes in risk factors due to controlled BMI... 45
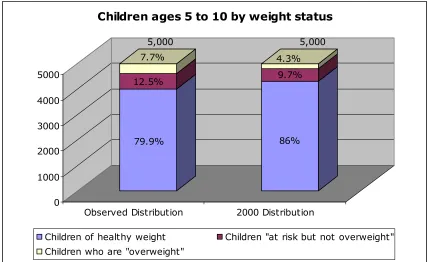
Results for children 5 to 10 years of age under the 2000 distribution model... 45
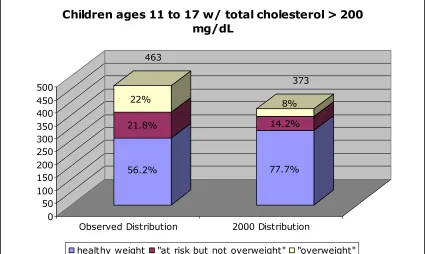
Results for adolescents 11 to 17 years of age under the 2000 distribution model ... 49
Study limitations and future opportunities ... 53
VI. Conclusion ... 54
VII. References... 57
VIII. Appendix A – CDC growth charts: BMI-for-age percentiles... 60
IX. Appendix B – Prevalence of overweight in children and adolescents 1999-2004 62 X. Appendix C – Overweight children & adolescents 1963–65 through 1999–2002 63 XI. Appendix D – Computer Simulation Theoretical Example... 64
List of Figures
Figure II-1 Total national health expenditures and as a percentage of GDP ... 2 Figure II-2 Probability of overweight at age 35 predicted from childhood BMI at the 95th percentile... 4 Figure III-1 Example probability distribution... 16 Figure III-2 Example of a chain of probability distributions... 17 Figure IV-1 Relationship of quetelet index in children ages 5-10 to probability of total cholesterol > 200 mg/dL ... 23 Figure IV-2 Relationship of quetelet index in children ages 11-17 to probability of total cholesterol > 200 mg/dL ... 24 Figure IV-3 Cardiovascular Risk Factor Model (age 5-10)... 27 Figure IV-4 Cardiovascular Risk Factor Model (age 11-17)... 28 Figure V-1 Sensitivity analysis of risk factors by simulated percentage at risk (ages 5-10) ... 33 Figure V-2 Sensitivity analysis of risk factors by simulated percentage at risk (ages 5-10) ... 34 Figure V-3 Sensitivity analysis of risk factors by simulated percentage at risk (ages 11-17) ... 38 Figure V-4 Sensitivity analysis of risk factors by simulated percentage at risk (ages 11-17) ... 39 Figure V-5 Total number of co-existing risk factors for children ages 5 to 10 (combined weight status n=5,000) ... 40 Figure V-6 Total number of co-existing risk factors for children ages 5 to 10 who are not “at risk for overweight” or “overweight” (n=3993)... 41 Figure V-7 Total number of co-existing risk factors for children "at risk for overweight” but who are not “overweight” ages 5 to 10 (n=624)... 41 Figure V-8 Total number of co-existing risk factors for children who are "overweight" ages 5 to 10 (n=383) ... 42 Figure V-9 Total number of co-existing risk factors for adolescents ages 11 to 17
(combined weight status n=5,000)... 43 Figure V-10 Total number of coexisting risk factors for adolescents ages 11 to 17 who are not “at risk for overweight” or “overweight” (n=3659)... 43 Figure V-11 Total number of coexisting risk factors for adolescents "at risk for
overweight” but who are not “overweight” ages 11 to 17 (n=772) ... 44 Figure V-12 Total number of coexisting risk factors for adolescents who are
Figure XII-2 Relationship of quetelet index in children ages 11-17 to probability of total cholesterol > 200 mg/dL ... 69 Figure XII-3 Relationship of quetelet index in children ages 5-10 to probability of
triglycerides > 130 mg/dL... 70 Figure XII-4 Relationship of quetelet index in children ages 11-17 to probability of triglycerides > 130 mg/dL... 70 Figure XII-5 Relationship of quetelet index in children ages 5-10 to probability of low-density lipoprotein cholesterol > 130 mg/dL ... 71 Figure XII-6 Relationship of quetelet index in children ages 11-17 to probability of low-density lipoprotein cholesterol > 130 mg/dL ... 71 Figure XII-7 Relationship of quetelet index in children ages 5-10 to probability of high-density lipoprotein cholesterol < 35 mg/dL ... 72 Figure XII-8 Relationship of quetelet index in children ages 11-17 to probability of high-density lipoprotein cholesterol < 35 mg/dL ... 72 Figure XII-9 Relationship of quetelet index in children ages 5-10 to probability of fasting insulin > 95th percentile ... 73 Figure XII-10 Relationship of quetelet index in children ages 11-17 to probability of fasting insulin > 95th percentile... 73 Figure XII-11 Relationship of quetelet index in children Ages 5-10 to probability of systolic blood pressure > 95th percentile... 74 Figure XII-12 Relationship of quetelet index in children ages 11-17 to probability of systolic blood pressure > 95th percentile... 74 Figure XII-13 Relationship of quetelet index in children ages 5-10 to probability of diastolic blood pressure > 95th percentile ... 75 Figure XII-14 Relationship of quetelet index in children ages 11-17 to probability of diastolic blood pressure > 95th percentile ... 75 Figure XIII-1 Simulation comparison- Children ages 5 to 10 w/ total cholesterol > 200 mg/dL... 76 Figure XIII-2 Simulation comparison- Children ages 5 to 10 w/ triglycerides > 130
Figure XIII-14 Simulation comparison- Children ages 11 to 17 w/ total cholesterol > 200 mg/dL... 82 Figure XIII-15 Simulation comparison- Children ages 11 to 17 w/ triglycerides > 130 mg/dL... 83 Figure XIII-16 Simulation comparison- Children ages 11 to 17 w/ low-density lipoprotein cholesterol > 130 mg/dL ... 83 Figure XIII-17 Simulation comparison- Children ages 11 to 17 w/ high-density
lipoprotein cholesterol < 35 mg/dL ... 84 Figure XIII-18 Simulation comparison- Children ages 11 to 17 w/ fasting insulin > 95th percentile... 84 Figure XIII-19 Simulation comparison- Children ages 11 to 17 w/ systolic blood pressure > 95th percentile ... 85 Figure XIII-20 Simulation comparison- Children ages 11 to 17 w/ diastolic blood
List of Tables
Table 1 Adult BMI weight status... 10
Table 2 Child and adolescent weight status... 11
Table 3 Relation of quetelet index to adverse risk factors, by age group ... 14
Table 4 BMI Probability Distribution (ages 5-10)... 22
Table 5 BMI Probability Distribution (ages 11-17)... 22
Table 6 Simulation results for all children ages 5 to 10 years ... 30
Table 7 Simulation results for healthy weight (quetelet index < 85th) children ages 5 to 10 years ... 30
Table 8 Simulation results for "At risk for overweight" but not "Overweight" (85th < quetelet index < 95th) children ages 5 to 10 years ... 30
Table 9 Simulation results for "Overweight" (quetelet index > 95th) children ages 5 to 10 years ... 31
Table 10 Simulation results for children ages 5 to 10 years ... 31
Table 11 Bogalusa Heart Study results for children ages 5 to 10 years ... 32
Table 12 Simulation results for all adolescents ages 11 to 17 years... 35
Table 13 Simulation results for healthy weight (quetelet index < 85th) adolescents ages 11 to 17 years ... 35
Table 14 Simulation results for "At risk for overweight" but not "Overweight" (85th < quetelet index < 95th) adolescents ages 11 to 17 years ... 36
Table 15 Simulation results for "Overweight" (quetelet index > 95th) adolescents ages 11 to 17 years ... 36
Table 16 Simulation results for adolescents ages 11 to 17 years... 37
Table 17 Bogalusa Heart Study results for adolescents ages 11 to 17 years ... 37
Table 18 Simulation results for all children ages 5 to 10 years (2000 distribution model) ... 46
Table 19 Simulation results for healthy weight (quetelet index < 85th) children ages 5 to 10 years (2000 distribution model) ... 46
Table 20 Simulation results for "At risk for overweight" but not "Overweight" (85th < quetelet index < 95th) children ages 5 to 10 years (2000 distribution model) ... 46
Table 21 Simulation results for "Overweight" (quetelet index > 95th) children ages 5 to 10 years (2000 distribution model) ... 47
Table 22 Simulation results for all children ages 11 to 17 years (2000 distribution model) ... 50
Table 23 Simulation results for healthy weight (quetelet index < 85th) children ages 11 to 17 years (2000 distribution model) ... 50
Table 24 Simulation results for "At risk for overweight" but not "Overweight" (85th < quetelet index < 95th) children ages 11 to 17 years (2000 distribution model) ... 50
List of Equations
Equation 1 BMI in kilograms and meters ... 9 Equation 2 BMI in pounds and inches... 10 Equation 3 - Probability of at risk for total cholesterol as a function of quetelet index (ages 5-10) ... 24 Equation 4 - Probability of at risk for total cholesterol as a function of quetelet index (ages 11-17) ... 24 Equation 5 - Probability of at risk for triglycerides as a function of quetelet index (ages 5-10) ... 24 Equation 6 - Probability of at risk for triglycerides as a function of quetelet index (ages 11-17)... 24 Equation 7 - Probability of at risk for Low-Density Lipoprotein Cholesterol as a function of quetelet index (ages 5-10)... 25 Equation 8 - Probability of at risk for Low-Density Lipoprotein Cholesterol as a function of quetelet index (ages 11-17)... 25 Equation 9 - Probability of at risk for High-Density Lipoprotein Cholesterol as a function of quetelet index (ages 5-10)... 25 Equation 10 - Probability of at risk for High-Density Lipoprotein Cholesterol as a
I. Introduction
The prevalence of overweight and obesity among children and adolescents has
increased considerably over the last few decades. According the American Medical
Association, the prevalence of overweight tripled in children and adolescents aged 6 – 19
years between 1980 and 2002 (Ogden, Carroll, Curtin, et al. 2006, p1549). As this trend
continues, increasing numbers of American children are developing multiple risk factors
for cardiovascular disease, type II diabetes, hyperinsulinemia, hypertension, dyslipidemia
and hepatic steatosis. For the majority, health-related consequences begin in childhood
and continue well into adulthood.
In response to this problem, organizations across America are banding together in
the fight against childhood overweight. These partnerships focus on a variety of issues
ranging from behavior to nutrition to physical activity. However, limited resources
require organizations to carefully select only the most effective and efficient
interventions. These decisions require thorough evaluation of national trends, scientific
evidence and long-term strategies.
Organizations seeking to identify successful strategies require access to a wide
variety of effective decision-making tools. The purpose of this thesis is to examine the
use of Monte Carlo computer simulation as a tool for assisting organizations in
identifying effective strategies for fighting childhood overweight. Utilizing this
approach, organizations can insert their own probabilities and customized algorithms for
predicting future events.
II. Background
The problem of overweight and obesity in the U.S. is not just a personal issue but
physical/mental status of whole populations. For example, consider the implications of
overweight on the U.S. economy. Significant attention is given to the rising cost of
health care. Health expenditures as a percentage of GDP in the United States have
increased from less then three percent in the 1970’s to approximately 16 percent in 2004
(see Figure II-1). The United States spends more on health care, in terms of per capita
health spending, than any other nation members of the Organization for Economic
Cooperation and Development (OECD). Considerations for many factors including
quality, capacity and innovation are required before making judgments regarding the
positive and/or negative implications of these spending trends. However, it is not
[image:17.612.93.524.345.640.2]disputed that health care expenditures are significant and growing.
Figure II-1 Total national health expenditures and as a percentage of GDP
Researchers project that health spending will increase to $3.4 trillion, or almost
20% of the GDP by 2013 (Hefler, Smith, Keehan, et al. 2004, p82). To undertake any
serious attempt at controlling cost, policymakers must seek to more fully integrate public
health into the U.S. health care system. It is usually cheaper to prevent illness, than to
treat illness.
Chronic disease
In an effort to effectively control health care cost, the U.S. must focus on the
problem of chronic disease. Chronic conditions are defined as illnesses or impairments
that last a year or longer. According to the CDC’s National Center for Chronic Disease
Prevention and Health Promotion, more than 90 million Americans live with chronic
illnesses and chronic diseases account for more than 75% of the nation’s $1.4 trillion of
medical care costs (National Center for Chronic Disease Prevention and Health
Promotion, 2005, p3).
Chronic diseases, such as cardiovascular disease (primarily heart disease and
stroke), cancer, and diabetes, are among the most prevalent, costly, and preventable of all
health problems (National Center for Chronic Disease Prevention and Health Promotion,
2005, p2).
Overweight – A major contributor to chronic disease
Research shows that “the risk of developing diabetes, gallstones, hypertension,
heart disease and stroke increases with severity of overweight among both women and
men” (Field, Coakley, Must, et al. 2001, p1581).
According to Calle and Walker-Thurmond, “In both men and women, body-mass
index was significantly associated with higher rates of death due to cancer of the
for death due to non-Hodgkin’s lymphoma and multiple myeloma. Significant trends of
increasing risk with higher body-mass-index values were observed for death from cancers
of the stomach and prostate in men and for death from cancers of the breast, uterus,
cervix, and ovary in women” (Calle, Rodriguez, Walker-Thurmond, et al. 2003, p1625).
As the number of overweight children and adolescents in the U.S. increases so
will the number of overweight adults. Figure II-2 shows the probability of overweight at
age 35 predicted from childhood BMI at the 95th percentile. According to Guo and
Chumlea “Body mass index values at or above the 75 percentile are associated with
increased morbidity and mortality in adulthood, and there are significant correlations
[image:19.612.191.422.366.590.2]between BMI values in childhood and in adulthood (Guo and Chumlea 1999, p145)
Figure II-2 Probability of overweight at age 35 predicted from childhood BMI at the 95th percentile
Source: Guo, S.S., Chumlea, W.C. (1999) Tracking of body mass index in children in relation to overweight in adulthood. The American Journal of Clinical Nutrition, 145, 145-147.
Health related consequences of child and adolescent overweight
The problem of overweight in children and adolescent is associated with several
experienced in childhood and/or be experienced later on in adulthood. Overweight
children and adolescents are at an increased risk for:
Cardiovascular Disease – Risk factors include abnormal cholesterol levels, hypertention, elevated triglycerides and glucose intolerance. Studies have shown “an evolving
epidemic of cardiovascular risk in youth, as evidence by an increase in the prevalence of overweight’ (Sorof, Lai, Turner, et al. 2004, p475).
Psychosocial Risks and Discrimination – Overweight children are often targets of early social discrimination. Social stigmatization and negative stereotyping can cause
psychological stress and low self-esteem which, in turn, can hinder academic and social functioning that persists well into adulthood (CDC, 2007). Other social and emotional health consequences include social marginalization, teasing/bullying, depression and negative body image (Institute of Medicine, 2004, p2).
Glucose Intolerance – a pre-diabetic state, that is associated with insulin resistance and increased risk of cardiovascular pathology (Institute of Medicine, 2004, p2).
Diabetes Mellitus Type II / Insulin Resistance – What was once considered primarily an adult disease, type 2 diabetes has increased dramatically in children and adolescents. Overweight and obesity are closely associated with type 2 diabetes (Pi-Sunyer, 2002, p23S).
Hyperinsulinemia – A condition where excess levels of circulating insulin are in the blood. It is not diabetes, but it is often associated with metabolic syndrome and type 2 Diabetes (Pi-Sunyer, 2002, p22S).
Dyslipidemia – Overweight is associated with disruptions in the amount of lipids in the blood (Institute of Medicine, 2004, p2).
Hepatic Steatosis (a.k.a. fatty liver) –A reversible condition where large vacuoles of lipid accumulate in hepatocytes (the cells of the liver). Hepatic Steatosis is a health condition associated with increased weight (CDC, 2007, p1).
Other associated health conditions include orthopedic problems (Institute of
Medicine, 2004), sleep apnea (CDC, 2007), gallstones (Institute of Medicine, 2004),
asthma (Gennuso, Epstein, Paluch, et al. 1998), reproductive complications (Cnattingius,
Bergstrom, Lipworth, et al. 1998) and menstrual abnormalities (Institute of Medicine,
2004).
Given the correlation between overweight children and overweight adults, health
Fourteen percent of cancer deaths among men and 20% of cancer deaths among women
may be due to overweight and obesity (Calle, Rodriguez, Walker-Thurmond, et al. 2003).
Arthritis is the leading cause of disability in the United States. According to the U.S.
Department of Health and Human Services (2007), the risk of developing arthritis
increases by 9-13% for every two-pound increase in weight.
Interventions for overweight (and its corresponding chronic diseases) will require
multifaceted approaches that seek to reverse years of cultural, behavioral and social
norms. Interventions must address root cause, begin early in life to establish lifelong
pattern of behavior and utilize effective methodologies for tracking progress.
Tracking overweight: National Health and Nutrition Examination Surveys (NHANES)
Two primary tools for tracking overweight in children and adolescents include the
National Health and Nutrition Examination Survey (NHANES) and the Centers for
Disease Control and Prevention growth charts.
In 1956, Congress passed the National Health Survey Act providing
legislative authority for a recurring survey to provide statistical data on the amount,
distribution, and effects of illness and disability in the United States. Three sources
of data collection fulfilled this purpose.
• Direct interviews with survey participants
• Clinical tests, measurements and physical examinations
• Information retrieved from hospitals, clinics and doctors offices
In compliance with the National Health Survey Act, three initial surveys were
performed.
1. 1960-62—National Health Examination Survey I (NHES I) – Focused on selected chronic disease of adults aged 18-79;
3. 1966-70—National Health Examination Survey III (NHES III) - Focused on the growth and development of children aged 12-17
In 1970, the Secretary of the Department of Health directed that additional
emphasis be placed on nutrition. As a result, the National Nutrition Surveillance System
was implemented. The purpose of the system was to measure and track the nutritional
status of the U.S. population.
Data from both systems were combined in the 1970’s to form the National Health
and Nutrition Examination Surveys (NHANES). Four surveys were conducted between
1970 and 1994.
• 1971-75—National Health and Nutrition Examination Survey I (NHANES I) • 1976-80—National Health and Nutrition Examination Survey II (NHANES
II)
• 1982-84—Hispanic Health and Nutrition Examination Survey (NHANES) • 1988-94—National Health and Nutrition Examination Survey III (NHANES
III)
Since 1999, the NHANES survey has been performed annually. Each year,
approximately 7,000 randomly selected residents across the United States have the
opportunity to participate (NCHS, 2007). Today, the survey is a valuable tool in
providing objective assessment data of health status and overweight for individuals living
in the United States.
Tracking overweight: Centers for Disease Control growth charts
In 1977, the National Center for Health Statistics (NCHS) developed a series of
growth charts for the purpose of assessing the development of children and youth. The
growth charts were developed utilizing data from the Fels Research Institute. Data
consolidated empirical data of youth between the years 1929 and 1975. In 1978, the
percentiles to serve as an easy reference for pediatricians (Dibley, Goldsby, Staehling, et
al. 1987, p736).
The 1977 NCHS growth charts gained national and international recognition as a
standard for assessing the health status of infants and youth. The charts served as a
cornerstone in research and are referenced in numerous studies evaluating prevalence,
trends, population comparisons and interventions. At the international level, the World
Health Organization (WHO) adopted the 1977 charts as standard reference (World Health
Organization, 1978).
As the charts gained in popularity, they also underwent scrutiny. The primary
issues centered on the validity of the Fels data. Inconsistencies include mismatches
between NCHS percentiles and 1978 versions of normalized data, methodologies used for
adjusting adolescent data versus younger children, over-representation of formula fed
infants and non-representative datasets. At the time, these data were the best available
and limitations were clearly stated in the initial release.
To address these issues the Centers for Disease Control and Prevention released a
series of updated growth charts in May of 2000 (see Appendix A). Today, these same
growth charts are the recommended standard for assessing children in the United States.
The measurement data for creating the revised growth charts were obtained from a series
of sources including:
• National Health Examination Survey (NHES), Cycles II and III
• National Health and Nutrition Examination Survey (NHANES) I, II, and III • U.S. Vital Statistics
• Wisconsin Vital Statistics • Missouri Vital Statistics • Fels Longitudinal Study
Survey-specific sample weights were applied to the national survey sample data
to assure representation of the U.S. population according to age, gender, and racial/ethnic
composition at the time the surveys were conducted (CDC, 2007).
Defining overweight in children and adolescents
Several methodologies exist for measuring overweight in children and
adolescents. Methodologies include body mass index, skin fold thickness measurements
utilizing calipers, underwater weighing, bioelectrical impedance, dual-energy x-ray
absorptiometry (DXA) and computerized tomography. However, tracking overweight at
the national level requires adoption and agreement towards a national standard. In
identifying this standard, issues of quality, ease of use (i.e., required training and
equipment) and cost come into consideration. Based on these factors, the CDC
recommends use of body mass index (BMI) for population studies (CDC, 2006).
Quetelet index
The quetelet index (or body mass index) was invented between 1830 and 1850 by
social scientist Adolphe Quetelet. The index is a statistical measure of the weight of a
person scaled according to height. As the measurement gained popularity during the
1980’s, the term was more commonly referred to as “body mass index”. Both terms are
used interchangeably throughout this thesis to prevent confusion between referenced
studies and data sources.
BMI is one of the best measurements for measuring overweight and obesity in
populations. Only height and weight are required, making BMI screening easy and
inexpensive. BMI is calculated the same way for both adults and children. According to
the CDC (2006), calculations for BMI are as follows:
Kilograms and meters (or centimeters) = weight (kg) / [height (m)] 2
Equation 2 BMI in pounds and inches
Pounds and inches = weight (lb) / [height (in)] 2 x 703
Although BMI is the recommended standard for population studies, it is not
without its limitations. According to the CDC (2006), BMI correlation to body fatness
“varies by sex, race, and age”. Examples of variance related to BMI include:
• At the same BMI, women tend to have more body fat than men do.
• At the same BMI, older people, on average, tend to have more body fat than younger adults do.
• Highly trained athletes may have a high BMI because of increased muscularity rather than increased body fatness.
Interpretations for BMI vary substantially between adult and children.
According to the CDC (2006), weight status for adults is classified as follows:
Table 1 Adult BMI weight status
BMI Weight Status
Below 18.5 Underweight
18.5 – 24.9 Normal
25.0 – 29.9 Overweight
30.0 and Above Obese
Source: Centers for Disease Control and Prevention (August 26, 2006). About BMI for Children and Teens. Retrieved March 10, 2007 from
http://www.cdc.gov/nccdphp/dnpa/bmi/childrens_BMI/about_childrens_BMI.htm
The criteria for establishing weight status in children is slightly more complex.
This is due to significant differences in amount of body fat between boys and girls as well
as for specific age groups. According to the CDC (2006), child and adolescent weight
Table 2 Child and adolescent weight status
Weight Status
Category Percentile Range
Underweight Less than the 5th percentile
Normal 5th percentile to less than the 85th percentile
Overweight 85th to less than the 95th percentile
Obese Equal to or greater than the 95th percentile
Source: Centers for Disease Control and Prevention (August 26, 2006). About BMI for Children and Teens. Retrieved March 10, 2007 from
http://www.cdc.gov/nccdphp/dnpa/bmi/childrens_BMI/about_childrens_BMI.htm
Percentile range is defined using the May 2000 growth charts (see Appendix A)
based on a combination of data sources.
Trends in tracking overweight among U.S. children and adolescents
Utilizing the percentile ranges defined in Table 2, the prevalence of overweight
and obesity among U.S. children and adolescents has increased considerably over the last
few decades.
The Institute of Medicine (2004) found that:
“Over the past three decades, the childhood obesity rate has more than doubled for preschool children aged 2-5 years and adolescents aged 12-19 years, and it has more than tripled for children aged 6-11 years. At present, approximately nine million children over 6 years of age are considered obese.” (IOM, 2004, p1)
For detailed prevalence data for children and adolescents who are “at risk of
overweight” and/or “overweight” by sex, age, and racial/ethnic group (see Appendix B &
C).
III. Literature review
The tools of modeling, analysis and simulation are widely used to assess systems
computerized simulation modeling to be a valuable asset in the following industries and
applications.
Manufacturing – capacity planning, inventory control and evaluation of process quality
Health-care – hospital staffing and medical decision making
Computer applications – designing hardware configurations and operating-system
protocols
Communication - evaluating network reliability
Economic – portfolio management and forecasting
Business – consumer behavior, product distribution and logistics
Biological – population genetics and epidemiology
The purpose of this thesis is to achieve the following:
Research Objective: This thesis examines the use of Monte Carlo computer simulation for understanding cardiovascular risk factors associated with childhood overweight. A computer model is presented for predicting cardiovascular risk factors among overweight children and adolescents based on BMI percentiles.
The primary benefits of computer modeling include:
Explaining relationships / sensitivity - For example, how do increases in childhood overweight affect increases in risk factors for elevated triglycerides?
Predicting future events – As an example, if current trends in childhood BMI continue, what is the expected number of children at risk due to high blood pressure in five years?
Examining “what if” scenarios - In other words, if one variable is modified – what changes are expected in other variables within the system? For example, if the rate in number of children who are “overweight” is reduced by half – What is the expected number of children with elevated total cholesterol?
Monte Carlo modeling
A Monte Carlo simulation is a statistical method involving computer simulation
in which data is generated randomly, enabling assessment of the probabilities of certain
weight status and the occurrence of specific cardiovascular risk factors in children and
adolescents.
Monte Carlo simulation is utilized in several studies for predicting future events
and outcomes in the field of public health. For example, Bray (2002) utilized Markov
Chain Monte Carlo (MCMC) simulation to address a 5-year delay in the publishing of
cancer incidence and mortality rates. Bray noted that current health models are rarely
utilized because of oversimplistic methodologies and/or models that are dependent on
questionable parametric assumptions. Bray proposes a new model based on MCMC
simulation and utilization of Bayesian statistics.
Stuart and colleagues (2003) utilized Monte Carlo experiments to simulate data
loss in testing the robustness of proportion-based quality indicators for asthma. Through
the use of Monte Carlo modeling, asthma quality indicators measures were determined
highly robust to systematic and random data loss.
Chen, Yen and Tung (2001) modeled the disease natural history of Type 2
diabetes mellitus using Monte Carlo Markov processes. The goal of the study was to
determine the cost effectiveness of mass screening in Taiwan. Two separate screening
regimes were compared with a control group. Direct costs and utilities were incorporated
to calculate the incremental costs per life-years gained and per quality-adjusted life-years
for biennial and five-yearly screening regimes. Through the use of Monte Carlo
modeling, the study showed 5-year interval mass-screening for Type 2 diabetes mellitus
to be cost-effective in Taiwan.
Overview of the Bogalusa Heart Study
The computer model utilizes probabilities from the 1999 Bogalusa Heart Study
cardiovascular risk factors among children and adolescents: The Bogalusa Heart Study.
Pediatrics, 103, 1175–1182). The objective of the Bogalusa Heart Study was to utilize
quetelet index cut points to examine the relation of overweight to adverse risk factors
levels. Table 3 shows the relationships between Quetelet index and adverse
cardiovascular risk factors by age group.
Table 3 Relation of quetelet index to adverse risk factors, by age group
Quetelet Index Percentiles
Ages 5-10 years <25 25-49 50-74 75-84 85-94 95-97 >97
Sample Size 904 817 798 340 384 100 256
Total Cholesterol > 200 mg/dL 9 10 10 13 18 17 23
Triglycerides > 130 mg/dL 2 3 3 6 10 10 21
Low-Density Lipoprotein Cholesterol > 130 mg/dL 8 8 9 10 18 12 23
High-Density Lipoprotein Cholesterol < 35 mg/dL 5 5 6 4 8 7 18
Fasting Insulin > 95th Percentile 2% 2% 3% 3% 4% 10% 27%
Systolic Blood Pressure > 95th Percentile 2% 2% 4% 6% 7% 12% 22%
Diastolic Blood Pressure > 95th Percentile 2% 2% 4% 9% 7% 9% 14%
Ages 5-10 years <25 25-49 50-74 75-84 85-94 95-97 >97
Sample Size 1189 1122 1249 611 763 210 424
Total Cholesterol > 200 mg/dL 6 6 7 9 15 12 19
Triglycerides > 130 mg/dL 3 4 5 7 12 18 32
Low-Density Lipoprotein Cholesterol > 130 mg/dL 4 4 6 9 13 12 21
High-Density Lipoprotein Cholesterol < 35 mg/dL 6 9 10 12 14 16 21
Fasting Insulin > 95th Percentile 1% 1% 3% 2% 5% 10% 25%
Systolic Blood Pressure > 95th Percentile 2% 4% 6% 4% 7% 5% 11%
Diastolic Blood Pressure > 95th Percentile 4% 5% 5% 5% 4% 4% 9%
Source: Freedman. D.S., Dietz W.H., Srinivasan. S.R., Berenson. G.S., (1999) The relation of
overweight to cardiovascular risk factors among children and adolescents: The Bogalusa Heart Study. Pediatrics, 103, 1175–1182.
The Bogalusa (Louisiana) Heart Study included seven cross-sectional
examinations, each with a participation rate of >80% between 1973 and 1994. The study
population was 43,000 (1/3 black, 2/3 white) schoolchildren between the ages of 5 and 17
years. Analysis was restricted to individuals who properly fasted and who had recorded
sample included 9,167 schoolchildren between the ages of 5 and 17 years (Freedman,
Dietz, Srinivasan, et al. 1999, p1175).
The Bogalusa study provides valuable insight into cardiovascular risk factors
among children and adolescents. Additionally, the study provides the opportunity for
building a simulation that otherwise would not be possible. However, the study itself
provides only static information - a snapshot in time. It provides great insight into the
prevalence and even incidence of cardiovascular risk factors among children and
adolescents but does not provide any prediction in how risk factors change in relation to
time and/or weight status.
Simulation, on the other hand, is dynamic. Each iteration of a simulation yields
different results. Much like real life, conditions change from day to day. For example,
suppose one’s weight is measured once per week. In the first week, one weighed 175.12
lbs. In the second week, the probability that one would again weigh 175.12 lbs is highly
improbable. One’s weight today is much more likely to fall somewhere above or below
175.12 lbs.
Weight fluctuation may be due to a variety of variables. Some are attributed to
what is called “natural variance”: e.g., at the time of weight measurement an individual
had not eaten breakfast, had lost water from a morning jog, etc. Some changes in weight
are considered “significant”: e.g., eating or exercised habits had changed, the individual
had caught a virus, or became pregnant. Simulation seeks to explain both natural and
significant variance through probability theory.
Additionally, simulation becomes helpful when stringing together multiple
probability distributions. When the number of variables is small, then the calculations
III-1. The y-axis represents the probability that a randomly selected individual’s average
daily duration of moderate exercise equals the corresponding duration in minutes
(x-axis). The ability to compare probabilities for increased vs. decreased exercise is
relatively easy.
Figure III-1 Example probability distribution
Now consider a slightly more complex model in Figure III-2. Assume, again that
distribution A is a probability distribution for average level of exercise. If the
individual’s daily exercise level is significant enough to fall within the dark purple
region, then the probability of getting a particular disease outcome is determined by
distribution B. Otherwise, the probability of getting the particular disease is determined
by distribution C. The final “Predicted Prevalence” is calculated using a combination of
Figure III-2 Example of a chain of probability distributions
Figure 3-2 provides a good example of the complexity that derives from
syndemics. “Syndemics” is a term invented to describe a set of linked health problems
and is defined as two or more afflictions, interacting synergistically, contributing to
excess burden of a disease in a population (CDC, January 2005). For a more in-depth
explanation on modeling, see Computer Simulation Theoretical Example in Appendix D.
Through simulation, researchers can tweak probabilities to better understand the
impact of certain system events. Simulation may help to answer questions such as:
How do reductions in BMI impact cholesterol levels?
What if interventions target the reduction of BMI for a particular sex and/or ethnicity group?
What if current trends in BMI continue for 5 years?
What if the trends in BMI stay the same but the risk of hypertension increases?
Simulation and Probability Theory
Two important laws are critical to the performance of a Monte Carlo simulation.
They are the Law of Large Numbers and Bayes’ Law. The Law of Large Numbers is a
fundamental concept in probability. According to the law:
If an event of probability p is observed repeatedly during independent repetitions, the ratio of the observed frequency of that event to the total number of repetitions converges towards p as the number of repetitions becomes arbitrarily large.
In other words, as an experiment is repeated over and over, the observed probability
approaches the actual probability distribution.
The second law critical to simulation is Bayes Law. Before delving into this law,
it is important to understand the two primary schools of thought for assigning
probabilities to various applications: Frequentist and Bayesian interpretations.
Frequentists assign probabilities to random events based on subsets of a
population as proportions of the whole (Durrett, 1994). For example, in the Bogalusa
Heart Study 432 children ages 5 to 10 years of age are at risk for total cholesterol levels
greater than 200 milligrams/deciliter (md/dL). The total sample size of children ages 5 to
10 screened for total cholesterol is 5,568. Based on these findings the proportion of
children ages 5 to 10 with total cholesterol levels greater than 200 md/dL is 12%. In
other words, using a frequentest view, the probability of a child ages 5 to 10 having a
total cholesterol level greater than 200 md/dL is 0.12.
Bayesian interpretations (or Bayes' Law) is valid for both interpretations of
probability. Bayes' Law relates a condition on the probability distribution (Durrett,
1994). In other words, probabilities are updated in light of new evidence. Using the
total cholesterol level exceeding 200 md/dL. If the 5 to 10 year old child, selected at
random, is known to be overweight (i.e., the child has a quetelet index greater than 95%).
This additional information may be used to update the original probability. In light of the
additional information regarding the child's weight status, the child now has 0.17
probability of having a total cholesterol level exceeding 200 md/dL.
The simulation model in this study utilizes quetelet index as a conditional
attribute for each randomly generated event. Probabilities for predicting adverse
cardiovascular risk factors are calculated utilizing the principles of Bayes Law.
IV. Model Development
Utilizing a similar methodology as was described earlier, the cardiovascular risk
factor model simulates trails based on single individuals. Each individual is first assigned
a weight status using a quetelet index. Second, the individual is assessed against a series
of probabilities (thresholds) to determine their susceptibility to various cardiovascular
risk factors. Each probability is determined given the individuals assigned weight status
(i.e., quetelet index).
The term “event” in probability refers to an unknown future result, while the term
“system event” refers to a change in the status of a system (Nelson, 1995, p25). A system
event is synonymous with implementation of an intervention. For example, a single
event may represent a 5 to 10 year old who is assigned a quetelet index in the 88th
percentile. By definition, this individual is considered “at risk of overweight”. The same
child is then assessed for total cholesterol. If this child’s total cholesterol level is greater
than 200 mg/dL, they are considered at risk for cardiovascular disease based on total
cholesterol. A 5-10 year old child with a quetelet index equal to the 85th percentile has a
number between zero and one using a uniform distribution provides the random number
0.235. Because 0.235 is greater than 0.157, this individual in not considered “at risk” for
total cholesterol even though the child is “at risk of overweight”. The same is repeated
for multiple risk factors and for multiple trials until the Law of Large Numbers is
achieved.
Two separate models are assessed. The first will model cardiovascular risk
factors among children ages 5 to 10 years. The second will model cardiovascular risk
factors among adolescents ages 11 to 17 years. These age groups are consistent with the
age groups established in the Bogalusa Heart Study. Age group categories allow for
more accurate predictions of individual quetelet index, risk factor susceptibility as well as
changes in height and weight metrics due to puberty.
@RISK Version 4.5.3
The simulation utilizes @RISK version 4.5.3 (student version) released February
of 2003. The tool is a proprietary product owned by the Palisade Decision Tools
Corporation. @RISK 4.5 is a Monte Carlo simulation add-in for Microsoft Excel
version 97 (8.0) or higher.
Model assumptions
As stated in the introduction, the purpose of this thesis is to examine the use of
Monte Carlo computer simulation for understanding risk factors associated with
childhood overweight. As such, it is hoped that future research will build and ultimately
improve upon the presented concepts. Even the most robust and extensively developed
models contain uncertainties and error. All simulation models have the potential for
improvement. That said, simulation is built on probability theory and mathematics.
studying how stochastic systems work. “Stochastic” is a term meaning to have a random
variable. A stochastic model is a tool for estimating potential outcomes by allowing for
random variation. The more accurate the model, the better the model is in predicting
outcomes.
In accordance with the scope and purpose of this thesis, the following
assumptions apply:
• The model is subject to limitations in population sample sizes, sampling error and aggregation of data for ages 5-10 years and 11-17 years.
• The model collapses probabilities from Freedman et. al. into specific risk factor categories and does not account for the complexities of relationships that exist between risk factors. The purpose of this model is to illustrate the benefits in simulating cardiovascular risk factors among overweight children and adolescents and does not seek to explain all relationships that may exist between data points. • The model is limited by the generalizations of calculating trend lines and in using
quetelet index ranges for each predicted cardiovascular risk factor.
• The Monte Carlo simulation is performed for five iterations of 1,000 trials. Therefore, each simulation is limited to a total of 5,000 trials. This number of trials is assumed sufficient in achieving the Law of Large Numbers. Additionally, each iteration utilizes a different algorithm for generating numbers and therefore achieves greater randomness.
Model inputs
Thompson, Burmaster and Crouch are pioneers in the work of utilizing Monte
Carlo techniques for quantifying uncertainty in public health risk assessments.
According to their work:
“The first step in the Monte Carlo simulation is to determine (continuous or discrete) probability distribution functions (PDFs) to describe each of the variable in the uncertainty analysis. In the simulation, each of many input variables can become a random variable with known or estimated PDF [or equivalently, a cumulative distribution function (CDF)]. Within this framework, a variable takes on a range of values with a known probability. Some distributions, for instance, are based on normal human variability and they come into play in the uncertainty analysis because we are uncertain who the person is that will actually be
following the scenario”(Thompson, Burmaster, Crouch, 1992, p54).
quetelet index PDF utilizes a histogram of probabilities from the Bogalusa Heart Study
(Table 4).
Table 4 BMI Probability Distribution (ages 5-10)
BMI Range Frequency
of
Occurrence
Range Probability
for Range
Probability per Percentile
0 =< x < 25 904 25 0.2512 0.0100
25 =< x < 50 817 25 0.2270 0.0091
50 =< x < 75 798 25 0.2217 0.0089
75 =< x < 85 340 10 0.0945 0.0094
85 =< x < 95 384 10 0.1067 0.0107
95 =< x < 97 100 2 0.0278 0.0139
97 =< x < 100 256 3 0.0711 0.0237
Similar a histogram is created for adolescents ages 11-17 using probabilities established
from the Bogalusa Heart Study.
Table 5 BMI Probability Distribution (ages 11-17)
BMI Range Frequency
of
Occurrence
Range Probability
for Range
Probability per Percentile
0 =< x < 25 1189 25 0.2135 0.0085
25 =< x < 50 1122 25 0.2015 0.0081
50 =< x < 75 1249 25 0.2243 0.0090
75 =< x < 85 611 10 0.1097 0.0110
85 =< x < 95 763 10 0.1370 0.0137
95 =< x < 97 210 2 0.0377 0.0189
97 =< x < 100 424 3 0.0761 0.0254
Cardiovascular risk factors of childhood and adolescent overweight
The cardiovascular risk factor model, will direct each trial or randomly generated
individual through a second series of equations. The equations determine the individual’s
probability for being “at risk” of cardiovascular disease based on a particular risk factor.
Using regression analysis, polynomial equations are derived to explain the
disease due to a particular risk factor. Cardiovascular risk factors in scope for this
analysis include:
• Total Cholesterol > 200 mg/dL • Triglycerides > 130 mg/dL
• Low-Density Lipoprotein Cholesterol > 130 mg/dL • High-Density Lipoprotein Cholesterol < 35 mg/dL • Fasting Insulin > 95th Percentile
• Systolic Blood Pressure > 95th Percentile • Diastolic Blood Pressure > 95th Percentile
Utilizing probabilities from Freedman et al. polynomial equations are developed
to represent the relationships between BMI and cardiovascular risk factor probabilities.
Figures IV-1 and IV-2 show the relationship of quetelet index (or BMI) in children and
adolescents to the probability of total cholesterol exceeding 200 mg/dL.
Figure IV-2 Relationship of quetelet index in children ages 11-17 to probability of total cholesterol > 200 mg/dL
Likewise, Equations 3 through 16 show the relationships for each cardiovascular risk
factor by age group. . Graphs for each equation are also available in Appendix E.
Equation 3 - Probability of at risk for total cholesterol as a function of quetelet index (ages 5-10)
y = 0.0000300x2 - 0.0020978x + 0.1188745
x = probability of total cholesterol > 200 mg/dL; y = quetelet index
Equation 4 - Probability of at risk for total cholesterol as a function of quetelet index (ages 11-17)
y = 0.0000286x2 - 0.0020420x + 0.0857550
x = probability of total cholesterol > 200 mg/dL; y = quetelet index
Equation 5 - Probability of at risk for triglycerides as a function of quetelet index (ages 5-10)
y = 0.0000401x2 - 0.0030472x + 0.0633072
x = probability of Triglycerides > 130 mg/dL; y = quetelet index
Equation 6 - Probability of at risk for triglycerides as a function of quetelet index (ages 11-17)
y = 0.0000677x2 - 0.0053929x + 0.1072561
Equation 7 - Probability of at risk for Low-Density Lipoprotein Cholesterol as a function of quetelet index (ages 5-10)
y = 0.0000315x2 - 0.0023502x + 0.1106534
x = probability of Low-Density Lipoprotein Cholesterol > 130 mg/dL; y = quetelet index
Equation 8 - Probability of at risk for Low-Density Lipoprotein Cholesterol as a function of quetelet index (ages 11-17)
y = 0.0000335x2 - 0.0022955x + 0.0687305
x = probability of Low-Density Lipoprotein Cholesterol > 130 mg/dL; y = quetelet index
Equation 9 - Probability of at risk for High-Density Lipoprotein Cholesterol as a function of quetelet index (ages 5-10)
y = 0.0000283x2 - 0.0024594x + 0.0859913
x = probability of High-Density Lipoprotein Cholesterol < 35 mg/dL; y = quetelet index
Equation 10 - Probability of at risk for High-Density Lipoprotein Cholesterol as a function of quetelet index (ages 11-17)
y = 0.0000187x2 - 0.0007838x + 0.0752449
x = probability of High-Density Lipoprotein Cholesterol < 35 mg/dL; y = quetelet index
Equation 11 - Probability of at risk for Fasting Insulin as a function of quetelet index (ages 5-10)
y = 0.0000582x2 - 0.0050417x + 0.0931682
x = probability of Fasting Insulin > 95th Percentile; y = quetelet index
Equation 12 - Probability of at risk for Fasting Insulin as a function of quetelet index (ages 11-17)
y = 0.0000548x2 - 0.0045987x + 0.0760686
x = probability of Fasting Insulin > 95th Percentile; y = quetelet index
Equation 13 - Probability of at risk for Systolic Blood Pressure as a function of quetelet index (ages 5-10)
y = 0.0000435x2 - 0.0033672x + 0.0661171
x = probability of Systolic Blood Pressure > 95th Percentile; y = quetelet index
x = probability of Systolic Blood Pressure > 95th Percentile; y = quetelet index
Equation 15 - Probability of at risk for Diastolic Blood Pressure as a function of quetelet index (ages 5-10)
y = 0.0000183x2 - 0.0009286x + 0.0290296
x = probability of Diastolic Blood Pressure > 95th Percentile; y = quetelet index
Equation 16 - Probability of at risk for Diastolic Blood Pressure as a function of quetelet index (ages 11-17)
y = 0.0000037x2 - 0.0002198x + 0.0460476
x = probability of Diastolic Blood Pressure > 95th Percentile; y = quetelet index
High levels of insulin, systolic blood pressure and diastolic blood pressure were
defined as those with greater than the 95th percentile for race, sex and age specific
national standards.
Model outputs
Now that the model inputs are defined, Figures IV-3 and IV-4 provides an
Once the risk factor probabilities are established for an individual based on
quetelet index, a uniform distribution is utilized as a comparison constant. In other
words, say the probability for an individual being “at risk” due to total cholesterol is 0.25.
A uniform distribution from 0.00 to 1.00 will randomly select a comparison constant. If
the comparison constant is .36, then the individual in not “at risk” for total cholesterol
(i.e., .36 > .25). If, however, the comparison constant were .19 the individual would be at
risk for total cholesterol (i.e., .19 < .25).
Two additional outputs of the model include:
• Proportion of children and adolescents who are “At Risk for Overweight” but not “Overweight”. Children and adolescents with a quetelet index greater than 85% but less than 95% (see Appendix A) are defined as “At Risk for Overweight” but not “Overweight”.
• Proportion of children and adolescents who are “Overweight”. Children and adolescents with a quetelet index greater than 95% (see Appendix A) are defined as “Overweight”.
V. Discussion
Simulation results for adolescents 5 to 10 years of age.
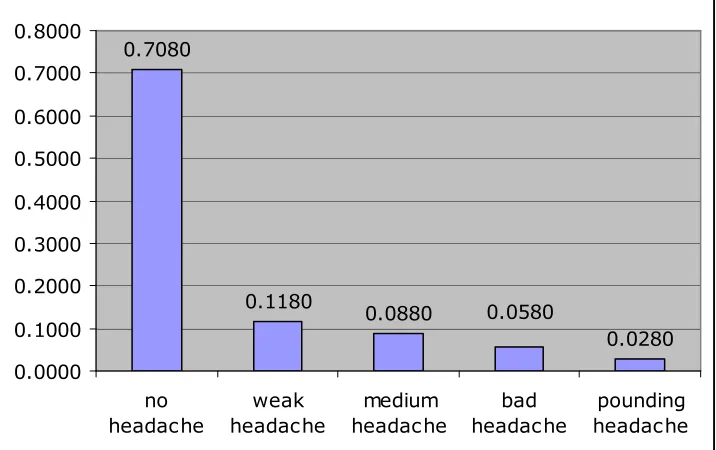
The results from the first simulation model (Figure IV-3) for children ages 5 to 10
are provided in Tables 6 through 9. Total number of occurrences and percentages are
shown for all trials (Table 6), children with BMI < 85th percentile (Table 7), children with
BMI between the 85th and 95th percentiles (Table 8), and children with BMI > 95th
Table 6 Simulation results for all children ages 5 to 10 years
Simulation results for all children ages 5 to 10 years
Yes No Total Percent
Children "at risk for overweight" but who are not "overweight" 624 4376 5000 12.48%
Children who are "overweight" 383 4617 5000 7.66%
Total Cholesterol > 200 mg/dL? 645 4355 5000 12.90%
Triglycerides > 130 mg/dL? 276 4724 5000 5.52%
Low-Density Lipoprotein Cholesterol > 130 mg/dL? 540 4460 5000 10.80%
High-Density Lipoprotein Cholesterol < 35 mg/dL? 322 4678 5000 6.44%
Fasting Insulin > 95th Percentile? 244 4756 5000 4.88%
Systolic Blood Pressure > 95th Percentile? 259 4741 5000 5.18%
Diastolic Blood Pressure > 95th Percentile? 212 4788 5000 4.24%
Table 7 Simulation results for healthy weight (quetelet index < 85th) children ages 5 to 10 years
Simulation results for healthy weight (quetelet index < 85th) children ages 5 to 10 years
Yes No Total Percent
Total Cholesterol > 200 mg/dL? 455 3538 3993 11.39%
Triglycerides > 130 mg/dL? 155 3838 3993 3.88%
Low-Density Lipoprotein Cholesterol > 130 mg/dL? 367 3626 3993 9.19%
High-Density Lipoprotein Cholesterol < 35 mg/dL? 221 3772 3993 5.53%
Fasting Insulin > 95th Percentile? 114 3879 3993 2.85%
Systolic Blood Pressure > 95th Percentile? 106 3887 3993 2.65%
Diastolic Blood Pressure > 95th Percentile? 106 3887 3993 2.65%
Table 8 Simulation results for "At risk for overweight" but not "Overweight" (85th < quetelet index < 95th) children ages 5 to 10 years
Simulation results for "At risk for overweight" but not "Overweight" (85th < quetelet index < 95th) children ages 5 to 10 years
Yes No Total Percent
Total Cholesterol > 200 mg/dL? 114 510 624 18.27%
Triglycerides > 130 mg/dL? 66 558 624 10.58%
Low-Density Lipoprotein Cholesterol > 130 mg/dL? 100 524 624 16.03%
High-Density Lipoprotein Cholesterol < 35 mg/dL? 48 576 624 7.69%
Fasting Insulin > 95th Percentile? 72 552 624 11.54%
Systolic Blood Pressure > 95th Percentile? 91 533 624 14.58%
Table 9 Simulation results for "Overweight" (quetelet index > 95th) children ages 5 to 10 years
Simulation results for "Overweight" (quetelet index > 95th) children ages 5 to 10 years
Yes No Total Percent
Total Cholesterol > 200 mg/dL? 76 307 383 19.84%
Triglycerides > 130 mg/dL? 55 328 383 14.36%
Low-Density Lipoprotein Cholesterol > 130 mg/dL? 73 310 383 19.06%
High-Density Lipoprotein Cholesterol < 35 mg/dL? 53 330 383 13.84%
Fasting Insulin > 95th Percentile? 58 325 383 15.14%
Systolic Blood Pressure > 95th Percentile? 62 321 383 16.19%
Diastolic Blood Pressure > 95th Percentile? 44 339 383 11.49%
A comparison of Tables 6 through 9, concludes that the percentage of children “at
risk” for various cardiovascular risk factors increased with each increasing level of
severity in weight status. What’s more, a status of “healthy weight” showed significant
reduction in occurrence of cardiovascular risk factors.
Tables 10 and 11 provide a summary of the results from the simulation model and
the Bogalusa Heart Study. A comparison of Tables 16 and 17 provides an example of the
level of variation experienced in computer simulation.
Table 10 Simulation results for children ages 5 to 10 years
Simulation results for children ages 5 to 10 years
All
BMI BMI<85th 85th<BMI<95th BMI>95th
Total Cholesterol > 200 mg/dL? 12.90% 11.39% 18.27% 19.84%
Triglycerides > 130 mg/dL? 5.52% 3.88% 10.58% 14.36%
Table 11 Bogalusa Heart Study results for children ages 5 to 10 years
Bogalusa Heart Study results for children ages 5 to 10 years
All
BMI BMI<85th 85th<BMI<95th BMI>95th
Total Cholesterol > 200 mg/dL? 12.01% 10.04% 18.00% 21.31%
Triglycerides > 130 mg/dL? 5.25% 3.04% 10.00% 17.91%
Low-Density Lipoprotein Cholesterol > 130 mg/dL? 10.66% 8.52% 18.00% 19.91% High-Density Lipoprotein Cholesterol < 35 mg/dL? 6.43% 5.16% 8.00% 14.91% Fasting Insulin > 95th Percentile? 4.53% 2.40% 4.00% 22.22% Systolic Blood Pressure > 95th Percentile? 5.06% 3.03% 7.00% 19.19% Diastolic Blood Pressure > 95th Percentile? 4.69% 3.39% 7.00% 12.60%
Utilizing the results from Tables 6 through 9 several implications can be made
that are relevant for addressing overweight in children and adolescents in the future. The
sensitivity analysis provided in Figures V-1 and V-2 show the risk factors that are most
sensitive to weight status. Particularly, Figure V-1 shows the sensitivity of risk factors by
healthy weight status (BMI less than 85th percentile) and “at risk of overweight” status