7
Wavelet Shrinkage Techniques for Images
S.S.Patil A.B.Patil S.C.Deshmukh M.N.Chavan
Lecturer Asstt. Professor Asstt. Professor Lecturer
AMGOI, Vathar WCE, Sangli AMGOI, Vathar ADCET, Ashta
ABSTRACT
An image is often corrupted by noise in its acquisition and transmission. Image denoising is used to remove the additive noise while retaining as much as possible the important image features. The motivation is that as wavelet transform is good at energy compaction, the small coefficients are more likely due to noise and large coefficient due to important signal features [6]. The proposed technique is based upon the analysis of wavelet transform which uses a soft thresholding method for thresholding the small coefficients without affecting the significant features of the image. In the proposed work, image denoising is studied using various wavelets for different images with two different noises at various levels of decomposition and comparison is done between the e three methods of wavelet shrinkage techniques.
Keywords
Wavelet shrinkage techniques, wavelet filters, wavelet transform.
1.
INTRODUCTION
In an increasingly digital world, digital images play an important role in day to day applications, such as, digital cameras, magnetic resonance imaging, satellite television, & in areas of research & technology including GIS (Geographical Information System)[4]. Datasets collected by image sensors are generally contaminated by noise & noise can be introduced by transmission errors & compression. Image denoising means to recover an image that is cleaner than its noisy observation. Thus noise reduction is an important technology in image analysis & the first step to be taken before images are analyzed. Wavelets are foundation for representing images in various degrees of resolution. Wavelets have efficient noise reduction ability. Wavelet transform has become an important tool to suppress the noise due to its effectiveness & producing better results. The wavelet transform has primary properties such as compression or sparsity which means that wavelet transforms of real-world signals tend to be sparse. Therefore, they have a few large coefficients that contain them energy of the signal and other small coefficients which can be ignored [11]. Moreover, the energy of the noise is spread among all the coefficients in the wavelet domain. Due to the fact that the wavelet transform of a noisy signal is a linear combination of the wavelet transform of the noise and the original signal, the noise power can be suppressed significantly with a suitable threshold while the main signal features can be preserved.
2.
WAVELET TRANSFORM
Everywhere around us are signals that can be analyzed. For example, there are seismic tremors, human speech, engine vibrations, medical images, financial data, music, and many other types of signals. Wavelet analysis is a new and promising set of tools and techniques for analyzing these signals. Many applications use the wavelet decomposition taken as a whole. The
common goals concern the signal or image clearance and simplification, which are parts of de-noising or compression. Wavelets give a superior performance in image denoising due to properties such as sparsity and multi resolution structure[8]. With Wavelet Transform gaining popularity in the last two decades various algorithms for denoising in wavelet domain were introduced. The focus was shifted from the Spatial and Fourier domain to the Wavelet transform domain.
2.1
Concept of Image Denoising
Wavelet denoising attempts to remove the noise present in the signal while preserving the signal characteristics, regardless of its frequency content. It involves three steps: a linear forward transform, nonlinear thresholding step and a linear inverse wavelet transform. Wavelet denoising must not be confused with smoothing; smoothing only removes the high frequencies and retains the lower ones. Wavelet shrinkage is a non-linear process and is what distinguishes it from entire linear denoising. Wavelet shrinkage depends heavily on the choice of a thresholding parameter and the choice of this threshold determines, to a great extent the effectiveness of denoising.
2.2
Image Denoising
Algorithm
This section describes the image denoising algorithm, which achieves near optimal soft threshholding in the wavelet domain for recovering original image from the noisy one. The algorithm is very simple to implement and computationally more efficient. It has following steps:
1. Perform multiscale decomposition [11] of the image corrupted by noise using wavelet transform.
2. Apply soft thresholding to the noisy coefficients.
3. Invert the multiscale decomposition to reconstruct the denoised image.
In order to choose optimal filter for the developed image denoising algorithm, exhaustive experiments are conducted with 19 different Wavelet filters such as Haar, Daubechies (order: 2, 4, 6, 8, 10, 20, 30), Symlet (order: 2, 4, 6, 8, 10, 20,), Bio-orthogonal (order: 1.3, 2.2, 2.6, 3.1, 3.5).
Performances of denoising algorithms were measured using quantitative performance measures such as peak signal-to-noise ratio (PSNR).Maximum value of PSNR indicates better denoising. PSNR represent the peak signal to noise ratio in db between original and reconstructed image[4]. The Peak Signal Noise Ratio in dB is calculated using Eqn. given below,
2552
PSNR =10log10 --- dB MSE
8 MSE = mean squared error between the original and reconstructed
image.
= STD (err (original image – reconstructed image)
3.
THRESHOLD SELECTION
Thresholding is a simple non-linear technique, which operates on one wavelet coefficient at a time. In its most basic form, each coefficient is thresholded by comparing against threshold, if the coefficient is smaller than threshold, set to zero; otherwise it is kept or modified[10]. Replacing the small noisy coefficients by zero and inverse wavelet transform on the result may lead to reconstruction with the essential signal characteristics and with less noise. Since the work of Donoho & Johnstone there has been much research on finding thresholds, however few are specifically designed for images. There are four types of thresholding available. They are
Hard Thresholding Soft Thresholding Semi-Soft Garotte
There are certain assumptions that are made during the application of such a thresholding scheme. One of these is that the signal to noise ratio is more than one. If this condition is not satisfied, then the signal will not be lost when the thresholding is applied to the coefficients. This loss of information is undesirable. Hence, it is imperative that the peak signal power be greater than the peak noise power. In practice, soft thresholding is more popular than hard thresholding because it reduces the abrupt sharp changes that occurs in hard thresholding and provides more visually pleasant recovered images.
4.
RESULTS & DISCUSSION
4.1
Performance of Thresholds at Different
Decomposition Levels with Added Noises
The performance of Minimax threshold, sqtwolog threshold and soft threshold at decomposition level-3, level-4 & level-5 and different standard deviations with added random noise and salt & pepper noise for Lena, Barbara and Boat image is studied in this section.
4.1.1
Performance for Lena image
[image:2.612.311.570.71.178.2]The values of PSNR for Lena image with added random noise and salt & pepper noise at various decomposition levels for different standard deviations were studied for Minimax threshold, sqtwolog threshold and soft threshold. The highest value of PSNR in each threshold at each level for each shrinkage (threshold) technique was identified and presented in table - 4.1.1.
Table -4.1.1 Highest values of PSNR for Lena image
Noise Decompos-
ition level
PSNR value in dB and corresponding filter Minimax threshold Sqtwolog threshold Soft threshold Random
3 30.1203
(sym10)
30.8529 (sym10)
32.7846 (sym20)
4 30.1116
(sym20)
30.8377 (sym20)
32.7616 (sym8)
5 30.1112 30.8291 32.7197
(sym20) (sym10) (sym10)
Salt & Pepper
3 26.9292
(Db30)
27.1896 (Db30)
29.7370 (Db30)
4 26.9236
(Db30)
27.1882 (Db30)
29.5563 (Db30)
5 26.8188
(Db30)
27.1273 (Db30)
[image:2.612.315.569.335.567.2]29.4011 (Db30)
Table 4.1 shows that, in case of Lena image with added random noise & salt & pepper noise, the highest PSNR value for soft threshold technique is greater than Sqtwolog threshold and Minimax threshold at decomposition level-3. The similar trend of the same was also observed at decomposition level-4 and level-5.
4.1.2
Performance for Barbara image
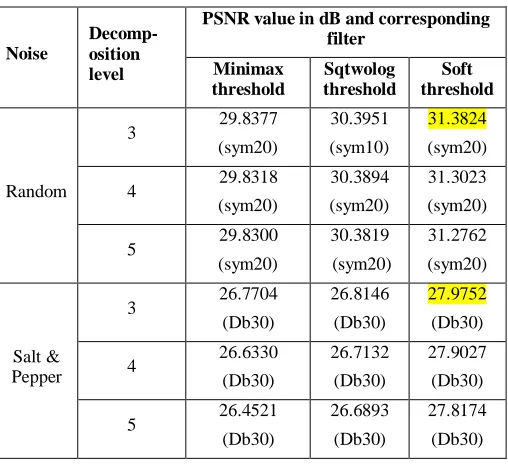
The values of PSNR for Barbara image with added random noise and salt & pepper noise at various decomposition levels for different standard deviations were studied for Minimax threshold, sqtwolog threshold and soft threshold. The highest value of PSNR in each threshold at each level for each shrinkage (thresholding) technique was identified and presented in table-4.1.2.
Table-4..1.2 Highest values of PSNR for Barbara image
Noise
Decomp-osition level
PSNR value in dB and corresponding filter Minimax threshold Sqtwolog threshold Soft threshold Random
3 29.8377
(sym20)
30.3951 (sym10)
31.3824 (sym20)
4 29.8318
(sym20)
30.3894 (sym20)
31.3023 (sym20)
5 29.8300
(sym20) 30.3819 (sym20) 31.2762 (sym20) Salt & Pepper
3 26.7704
(Db30)
26.8146 (Db30)
27.9752 (Db30)
4 26.6330
(Db30)
26.7132 (Db30)
27.9027 (Db30)
5 26.4521
(Db30)
26.6893 (Db30)
27.8174 (Db30)
In case of Barbara image with added random noise & salt & pepper noise, Table 4.1.2 shows that, the highest PSNR value for soft threshold technique is greater than Sqtwolog threshold and Minimax threshold at decomposition level-3. The similar trend of the same was also observed at decomposition level-4 and level-5. The best PSNR values for all three shrinkage techniques shows the decreasing trend with increase of decomposition levels from level-3 to level-5.
4.1.3
Performance for Boat image
[image:2.612.50.303.585.718.2]9 in each threshold at each level for each shrinkage (thresholding)
[image:3.612.56.289.530.710.2]technique was identified and presented in table-4.1.3.
Table - 4.1.3 Highest values of PSNR for Boat image
In case of Boat image with added random noise & salt & pepper noise, Table 4.3 shows that, the highest PSNR value for soft threshold technique is greater than Sqtwolog threshold and Minimax threshold at decomposition level-3. The similar trend of the same was also observed at decomposition level-4 and level-5. The best PSNR values for all three shrinkage techniques shows the decreasing trend with increase of decomposition levels from level-3 to level-5.
4.1.4
Image denoising results for Lena image
The highest value of PSNR in each threshold at 3rd decomposition level for each shrinkage (threshold) technique was identified & the image results for Lena image added random noise and salt & pepper noise are presented as below:
For Random noise
Original image Noisy image sym10(30.1203dB)
Sym10(30.8529dB) Sym20 (32.7846dB)
For Salt & Pepper noise
Original image Noisy image Db30 (26.9292dB)
Db30 (27.1896dB) Db30 (29.7370dB)
4.1.5
Image denoising results for Barbara image
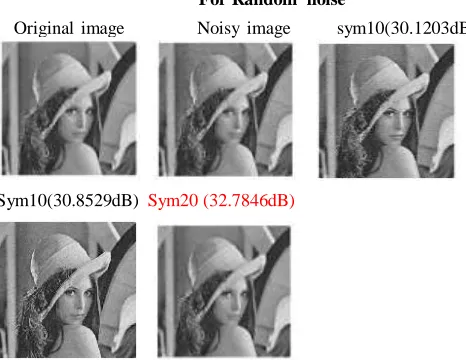
The highest value of PSNR in each threshold at each decomposition level for each shrinkage (threshold) technique was identified & the image results for Barbara image added random noise and salt & pepper noise are presented as below.
For Random noise
Original image Noisy image Sym20 (29.8377dB)
Sym10 (30.3951dB) Sym20 (31.3824dB)
For Salt & Pepper noise
Original image Noisy image Db30 (26.7704dB)
Db30 (26.8146dB) Db30 (27.9752 dB)
Noise
Decomp -osition level
PSNR value in dB and corresponding filter
Minimax threshold
Sqtwolog threshold
Soft threshold
Random
3 29.8801
(bior2.6)
30.4749 (bior2.6)
31.6094 (bior2.6)
4 29.8664
(sym10)
30.4658 (bior2.6)
31.5899 (bior2.6)
5 29.8587
(bior2.6)
30.4547 (sym10)
31.5782 (bior2.6)
Salt & Pepper
3 26.7704
(Db30)
27.0570 (Db30)
28.2837 (Db30)
4 26.7162
(Db30)
26.9828 (Db30)
28.1803 (Db30)
5 26.7142
(Db30)
26.9785 (Db30)
10
4.1.6
Image denoising results for Boat image
The highest value of PSNR in each threshold at each decomposition level for each shrinkage (threshold) technique was identified & the image results for Boat image added random noise and salt & pepper noise are presented as below
For Random noise
Original image Noisy image Bior2.6 (29.8801dB)
Bior2.6 (30.4749dB) Bior2.6 (31.6094dB)
For Salt & Pepper noise
Original image Noisy image Db30 (26.7704dB)
Db30 (27.0570dB) Db30 (28.2837dB)
6.
CONCLUSION
The analysis of exhaustive experimental results revealed the following conclusions:
1. The Soft threshold technique shows the maximum values of PSNR followed by Sqtwolog threshold and Minimax threshold technique at all the standard deviations with all the levels for added noises in all the images selected.
2. The maximum value of PSNR at all the standard deviations for all the filters were obtained at decomposition level-3 & the
decreasing trend of PSNR value was observed when the decomposition level increased from level-3 to level-5.
3. Wavelet filters were found to be effective in denoising all the images with added random noise & salt & pepper noise.
4. The highest value of PSNR was not obtained for unique wavelet filter but was obtained for different wavelet filters, for different images and for different noise types & standard deviations. However in an average sense, Symlet filter of the order of 20 (sym20) gives better performance for random noise removal & Daubechies filter of the order of 30 (Db30) gives better performance for salt & pepper noise removal among all other wavelet filters.
7.
REFERENCES
[1] A.Ben Hamza, P. Luque, J. Martinez, and R. Roman, “Removing noise and preserving details with relaxed median filters,” J. Math. Image Vision, vol. 11, no. 2, pp. 161–177, Oct. 1999.
[2] A.K.Jain, Fundamentals of digital image processing. Prentice-Hall, 1989.
[3] Andrew Bruce, David Donoho and Hung-YeGao, 1996, “Wavelet Analysis”, IEEE Spectrum, pp.27-35.
[4] Arivazhagan S.1,*, Deivalakshmi S.1, Kannan K.1, Gajbhiye B.N.2, Muralidhar C.2, Lukose Sijo2,Subramanian M.P.2, “Performance analysis of Wavelet Filters for Image Denoising” Advances in Computational Sciences and Technology, 2007, Vol: 1, Issue: 1
[5] D. L. Donoho, “De-noising by soft-thresholding”, IEEE Trans. Information Theory, vol.41, no.3, pp.613- 627, May1995. [6] David L. Donoho and Iain M. Johnstone., “Adapting to unknown smoothness via wavelet shrinkage”, Journal of the American Statistical Association, vol.90, no432, pp.1200-1224, December 1995. National Laboratory, July 27, 2001.
[7] David L. Donoho and Iain M. Johnstone,“Ideal spatial adaption via wavelet shrinkage”, Biometrika, vol.81, pp 425-455, September 1994.
[8] E. Hostalkov´a, A.Prochazka, “Wavelet Signal And Image Denoising” Institute of Chemical Technology, Prague Department of Computing and Control Engineering Technick´a 1905, 166 28 Prague 6.
[9] H. Choi and R. G. Baraniuk, "Analysis of wavelet domain Wiener filters," in IEEE Int. Symp. Frequency and Time-Scale Analysis,(Pittsburgh), Oct. 1998.
[10] Imola K. Fodor, Chandrika Kamath, “Denoising through wavlet shrinkage:an empirical study”, Center for applied science computing Lawrence Livermore National Laboratory, July 27, 2001.
[11] M.S. Crouse, R.D. Nowak, R.G. Baraniuk, Wavelet-based signal processing using hidden Markov models, IEEE Trans. Signal Process. 46 (1998) 886–902.
11 [14] R. Coifman and D. Donoho, "Translation invariant
de-noising," in Lecture Notes in Statistics: Wavelets and Statistics, vol. New York: Springer-Verlag, pp. 125- -150, 1995.
[15] R. Yang, L. Yin, M. Gabbouj, J. Astola, and Y. Neuvo, “Optimal weighted median filters under structural constraints,” IEEE Trans. Signal Processing, vol. 43, pp. 591–604, Mar. 1995. [16] R. C. Hardie and K. E. Barner, “Rank conditioned rank selection filters for signal restoration,” IEEE Trans. Image Processing, vol. 3, pp.192–206, Mar. 1994.
[17] V. Strela. “Denoising via block Wiener filtering in wavelet domain”. In 3rd European Congress of Mathematics, Barcelona, July 2000. Birkhäuser Verlag.