An Adaptive Energy Efficient Forwarding Data
Aggregation and QoS Protocol for Wireless Sensor
Networks
Basavaraj. S. Mathapati
Department of CSE.Appa IET,
Gulbarga, Karnataka, India
Siddarama R. Patil
Department of ECE P.D.A College of EngineeringGulbarga, Karnataka, India
V. D. Mytri
PrincipalShetty Institute of Technology. Gulbarga, Karnataka, India
ABSTRACT
In this paper, we propose to design an adaptive energy efficient forwarding data aggregation technique for wireless sensor networks. Initially we form clusters and a coordinator node (CN) is selected near the cluster in order to monitor the nodes in the cluster. The CN selects a cluster head (CH) in each cluster based upon the energy level and the distance to the CN. The packets sent by the sensor nodes are aggregated at the CH and transmitted to the CN. The CN measures the loss ratio and compares it with a threshold value of loss ratio. Depending upon this value, the forward node count is incremented or decremented and the cluster size is adaptively changed, ensuring reliability and balanced energy consumption. From our simulation results we prove that this technique is efficient in terms of energy consumption and reliability. We have compared our results with Adaptive Energy Efficient Reliable Routing protocol (AEERRP) and found our results are more energy efficient and reliable then AEERRP by varying Number of Nodes and rates.
General Terms
Reliability, Energy Efficient, QOS.
Keywords
Data aggregation, Cluster Node, Cluster Head, AEERDAT, Residual energy.
1.
INTRODUCTION
In data aggregation, the aggregation processes are used to aggregate the sensor data effectively. Data aggregation techniques enhances the network lifetime by gathering and aggregating the data in an energy efficient manner. A striking method for data gathering in wireless sensor networks involves distributed system architectures and dynamic access via wireless connectivity. In the case of energy constraint wireless sensor networks, the data aggregation techniques intend to eradicate the redundant data transmissions thereby improving the lifetime of the network. [1]
Due to that the sensor nodes are tightly packed in the sensor networks, there are possibilities for the nearby sensor nodes to overlap sensing ranges. Because of this, redundant or Correlated data are collected by the sensor networks. In order to save the energy, the data correlation is subjugated which effectively reduces the amount of data transmitted in the network. In wireless sensor network routing, data aggregation proves to be an important aspect. The data originating from
different sensor nodes aggregate together in the sink node during transmission. [2]
The main purpose of the data gathering in wireless sensor network (WSNs) is to obtain valuable information from the operating environment. It has been proven that the data redundancy can be eradicated and the communication load can be reduced using the data aggregation techniques. Multiple data sources and a data sink are included in the typical communication patterns of data aggregation. A data aggregation tree is constructed using the transmitted packet and this is similar to the reverse multicast structure. [3] Advantage of Data Aggregation:Robustness and accuracy of information acquired from the network can be improved effectively. The data aggregation requires the data fusion processing in order to reduce the redundant information which is present in the data collected from the sensor nodes. Traffic load is minimized and the energy in the sensors can be conserved with the help of data aggregation. Disadvantage of Data Aggregation:The cluster heads are also known as the data aggregator nodes which combine the data in order to send it to the base station. There are chances of malicious attackers in the cluster head or the aggregator node. The accuracy of the aggregate data sent to the base station cannot be guaranteed when the cluster head is compromised. The uncompromised nodes send several copies of the aggregate result to the base station which increases the power consumed at these nodes. [4].
Inthis paper, we proposed to develop An Adaptive Energy Efficient Forwarding Data Aggregation Technique for Wireless Sensor Networks
(AEEFDAT)
which is energy efficient and reliable. This technique is based on cluster formation and the loss ratios of the clusters are measured so that the energy consumption can be effectively reduced. Reliable transmission can be provided in the clusters using a coordinate node.2.
RELATED WORK
2.1
Previous work related to Power
Control in Data Aggregation
Target tracking and habitat monitoring which includes remote or hostile field monitoring are the main applications of sensor networks. Since the batteries are irreplaceable, in such applications the sensor node becomes inaccessible after deployment. These sensor nodes have limited battery power due to its small size of the sensor nodes. Thus, energy conservation should be done as much as possible due to its scarcity in the sensor networks. [2]
As concerned to WSNs, energy efficiency is considered in a wide range. The energy resources are carefully administrated since many sensor nodes in such networks need to function for a long period. The energy consumption can be made effective while using wireless communication. It is quite essential to design energy-efficient communication strategies for data gathering operation because considerable amount of communication in WSN involves data gathering. [3]
Determining energy efficient routing schemes is a noteworthy trouble since it extends the network lifetime by periodically gathering all the data at the sink. The time period between two sensing activities of sensor nodes is known as a round and the lifetime is estimated in terms of rounds. [5]
In order to fulfill the task, the additional sensor networks shouldn’t use any help from human. The network lifetime can be extended by using a limited capacity of common power supplies which include batteries or solar cells. When compared to the single hop network the energy-efficient data exchange becomes more complex in the multi-hop networks. The transmissions scheduling based on the individual demands are not strictly followed by the sensor nodes but the messages can be received and relayed from other nodes in the network by activating their radio. Due to this, idle listening and overhearing can be caused which in turn dissipates energy. [6]
2.2 Previous work related to Reliability in
Data Aggregation
Numerous messages transported in a single path use a data aggregation in order to combine them into a single message. The amount of messages can be reduced by the aggregation techniques and the scarce bandwidth can be preserved by minimizing the energy expensive transceiver operation. The data reliability at the sink is altered when the quantity of data concentrated in a single message is increased by the aggregation. The overall data reliability has higher effect on losing a message which contains single data reading than losing a message which has information of several sensor readings. [7]
The unexpected events in WSN affect the device reliability extensively. The internal problem or external impacts become the cause for failure of device hardware and software components. Though several devices are installed in a rival
environment, the normal functions of the nodes are not ensured until the battery energy gets depleted completely. Few network operations like sensing coverage of the area and the connectivity among nodes are affected by the individual node failures caused by energy depletion. [8]
Ren P. Liu et al [10] have proposed an Efficient Reliable Data Collection (eRDC) algorithm. Maximum number of retransmissions is controlled in order to achieve energy savings. Dynamic programming concept is used to find the optimal solution. Implementation of eRDC is provided which uses next hop link quality and number of hops for determining number of retransmissions.
Volker Turau et al [11] have presented the design and preliminary evaluation of a reliable data gathering service of periodic data in the face of poor link quality and frequent disconnects. The data is buffered by persistent storage provided by the nodes using services based on a packet-level, and hop-by-hop routing protocol. This design also provides an upper limit for sampling rate that is handled reliably. Hemant Sethi et al [12] have proposed an Energy Efficient Interest Based Reliable Data Aggregation (EIRDA) Protocol for WSNs. Here each cluster considers the uniform distribution of sensor nodes using EIRDA which is a static clustering scheme. Beta-distribution function is used to provide reliability with the help of Functional Reputation concept. The overall impact of all measures taken at each phase of protocol implementation is clearly visible on the energy spent in the setup phase of the protocol.
David Gugelmann et al [13] have presented a novel data dissemination protocol with a focus on reliability and energy-efficiency. Scheduling image dissemination only during reserved time slots eliminates interference with the regular data gathering protocol and increases the observability during the network reprogramming phase.
Mingming Lu et al [14] have proposed the data-gathering problem in wireless sensor networks from the maximization of the expected network utility point of view. The resource scarcity and the unstable nature of wireless channels are considered here. Data gathering problem is designed as an optimization problem and the NP-hard problem is proved here. For both the broadcast tree and reverse multicast tree problems several heuristics were proposed.
In wireless sensor networks, the data aggregation needs to be processed based upon the energy and the reliability due to the following reasons:
Operate the energy resources over a long period. Efficient energy is required for the sensor nodes in
order to schedule their transmission strictly. Improper transmissions may lead to idle listening and overhearing causing energy wastage.
The aggregation increases the amount of data concentrated in a single message which requires alteration in reliability.
In event detection, the packets are transmitted from the sensor nodes to the base station and then to the neighboring which is possible through reliable data transport.
To overcome our previous certain issues on data aggression, we provide an efficient energy based and reliable data aggregation technique in the wireless sensor network. This technique is based on cluster formation and the loss ratios of the clusters are measured so that the energy consumption can be effectively reduced. Reliable transmission can be provided in the clusters using a coordinate node.
3.
DESIGN OF AEEFDAT
3.1
Overview
In this paper, we propose to develop a data aggregation technique which is energy efficient and reliable. Initially a cluster is formed and the cluster head is selected based upon the cost value which is explained in section 3.2. The nodes in the cluster maintain a Neighbor information table (NIT) containing Node id, Distance and Cost. This NIT information is sent to the cluster head. Each cluster selects a coordinator node (CN) randomly in the network which is closer to the cluster and monitors the operations of the sensor nodes and commands them for specific operations. The cluster head aggregates the data and sends it to the CN.
The CN calculates the loss ratio which is the ratio of number of packets dropped and total packets broadcast from the source. Based upon the loss ratio, the cluster size can be modified and the forward node count of each node can be incremented or decremented which is explained in section 3.4. Once the cluster size is changed, the CN gathers the information again from the cluster head compresses it and sends it to the sink.
Since the loss ratio is measured at the CN itself, the energy consumption can be effectively reduced. Also the reliability can be increased due to altering the cluster size before the data is transmitted to the sink.
3.2 Cluster Head Selection
Initially the sensor nodes are arranged into clusters and the CN selects the cluster head for each cluster. Numbers of neighboring nodes M are determined by
the CN based upon the node density.
The sensor nodes transmit the M number of nearest neighbors to the CN.
Received signal strength indicator (RSSI) estimates the distance to the nodes.
K-theorem is used in each cluster by the CN to select the candidate set of cluster heads (SCH).
The request for the candidate set of cluster heads is sent by the CN and the sensor nodes reply their cost value (CV).
Each candidate cluster head node calculate it’s own CV based on residual energy, and distance to coordinator node, and send it to CN. Calculation of cost value is explained in section 3.2.2.
The coordinator node selects a node as cluster head among candidate set of cluster heads for each cluster based on CV. The higher the CV a node has; greater the chances of being cluster head. The CN confirms each cluster about their CH.
In this figure 1, we assume a cluster with three sensor nodes. The CN sends a request for the nodes in the cluster. The cost value of the sensor nodes 1, 2, and 3 are sent back to the CN. The node having higher CN becomes the Cluster head. Here the node 1 has CV value as 7 and it is elected as the CH for the cluster and the CN sends this information to other Clusters.
Figure 1: Selection of Cluster Head.
3.2.1 Selection of M for clustering
In each cluster, value of M is set by the CN and this M value is relative to the node density and the ratio of cluster heads in a WSN.
The ratio should be below 0.50 ranging from 0.01 to 0.99. Many local optima can be obtained when the value of M is lesser. The number of best sensor nodes which are suitable for CH can be determined using M value. Optimal sensor node for cluster head can be selected by providing alternate suboptimal options by M.
M nearest neighbors is selected for each sensor node deployed in the cluster which is based on the distance. The received signal strength indicator calculates the distance between the sensor nodes. For larger distance, nearest neighboring nodes can be determined using multihop communication route. Energy consumption is less in choosing a neighbor in multi-hop connection when compared to the direct communication.
3 2
1 CV=7
CV=3
CH CN
Request for CV
Every sensor node calculates its frequency of occurrence and minimum frequency required for a cluster to become a CH is also calculated. The weighted mean of frequencies is calculated and it is enhanced by adding 1 to it.
The product of each frequency of occurrence and number of sensor nodes having that frequency is calculated as weighted mean. The frequency value is rounded to its nearest integer. The value of Sensor nodes having frequency F or greater are identified and they become the candidates for cluster head (CH). The candidate cluster head nodes would always be equal to value of F [15].
3.2.2 Cost Value Calculation
The Cost value (CV) is calculated based on following criterion:
Residual energy (E)
The residual energy of a node preferably is greater than the approximate energy dissipated in previous round by the cluster head.
Distance to coordinator node (D)
The nodes having less distance from coordinator node should have higher probability to become cluster head. As energy consumption is directly proportional to the square of distance. Cost value is based on the residual energy and the distance to the coordinate node. The cost is maximum when the residual energy is high and the distance to the coordinator node is less.
CV = (a X E) + (b X (1/ D)) ………. (1)
Where a and b are normalization constants.
3.2
Loss Ratio Calculation
QoS is a set of service requirements to be met when transporting a packet stream from the source to its destination [16]. Quality of service (QoS) is defined as “the capability to provide resource assurance and service differentiation in a network” [17]. Quality of Service (QoS) in WSN aims at providing better networking services over current technologies such as ATM, Ethernet and others. The main three parameters for QoS are latency (delay), jitter and loss. Other QoS parameters include reliability, responsiveness, mobility, power efficiency network availability and bandwidth [18].
Qos Parameter we have considered are Delay, Loss Ratio, Reliability.
Each node maintains a forward node count (CFN), which
denotes the broadcast or rebroadcast probability.
Initially CFN [Nk] = CFNmin, for all nodes Nk, k=1, 2…….
CFNmin is the minimum number of forwarding nodes. Without
loss of generality, we can assume that
CFNmin =1. The steps involved in the adaptive energy
efficient forwarding phase are given below:
Suppose N wants to send the collected data to the sink, it attaches its cost to the data packet and broadcast the packet to the nearest neighbors. When a neighbor N1 receives the packet from N, it
first checks its cost is less than that of N. If it is less, it further forwards the packet. Otherwise it drops the packet, since N1 is not towards the direction of the sink.
When the packet reaches the destination D, it measures the loss ratio (LR), which is the ratio of number of packets dropped and total packets broadcast from the source.
Then D sends this LR value as a feed back to the source N.
When N receives this value, it checks the value of LR. It then modifies the value of CFN as
CFN = CFN + γ, if LR > LRmax. ………. (2)
Where γ is the minimum increment of decrement count and LRmax is the maximum threshold value of loss rate. It then rebroadcast the data packets with the incremented CFN,
so that increasing the reachability of the sink. The total power required to reach the sink is thus calculated based on the cost field of all the nodes in CFN. For example, if CFN =4, then the
minimum required power will be 4 * cost of each neighbor node in the NIT.
When the rebroadcast packets reach the destination D, it again calculates the loss ratio LR and sends back to N. It then reassigns the value of CFN, depending on the value of LR.
Once LR < LRmax , then
CFN = CFN - γ, until CFN >= CFNmin ……….. (3) [19]
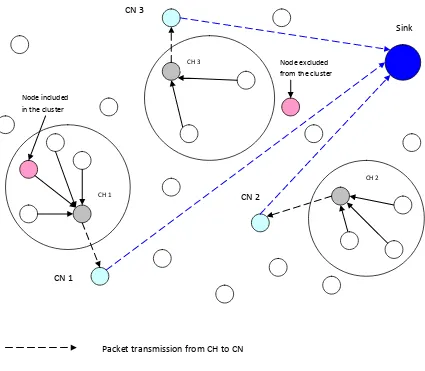
In figure 2, the calculation of loss ratio is explained. The nodes in cluster 1 send their data to CN1. The CN 1 calculates the loss ratio as explained in section 3.3. Similarly the loss ratio of clusters 2 and 3 are calculated. The loss ratios for all the clusters are calculated in the CN. We assume that the loss ratio for the cluster 1 is greater than the threshold value, the loss ratio for the cluster 2 is same as the threshold loss ratio and the loss ratio in the cluster 3 is less than the threshold value.
Figure 2: Calculation of Loss Ratio for Clusters
CN 3
Cluster 3
LR > LRmax LR < LRmax
LR = LRmax CH 1
CH 3
CH 2
CN 1
CN 2
Sink
Cluster 1
Figure 3: Reassigning the value of Forward node count
This data aggregation technique proves to be efficient in terms of energy and reliability since,
Energy is reduced effectively when the size of the cluster is altered based upon the loss ratio.
The reliability can be maintained due to the change in the size of the clusters.
Delay can be reduced due to that the loss ratio is measured in the CN itself. Measuring loss ratio at the sink causes high delay.
4.
SIMULATION RESULT
4.1 Simulation setup
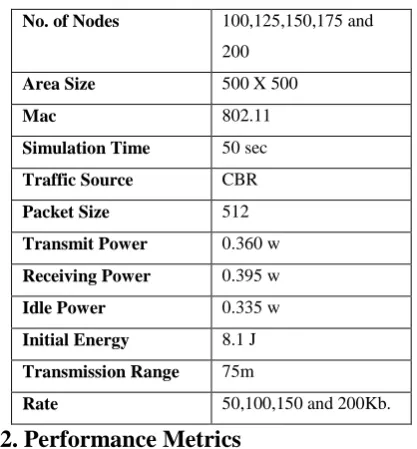
We evaluate our AEERDAT scheme through NS2 simulation [20]. We considered a random network deployed in an area of 500 X 500 m. The number of nodes is varied as 100,125,150,175 and 200. Initially the nodes are placed randomly in the specified area. The sink is assumed to be
situated 100 meters away from the above specified area. The initial energy of all the nodes assumed as 8.1 joules. In our simulation, the channel capacity of mobile hosts is set to the same value: 2 Mbps. We use the distributed coordination function (DCF) of IEEE 802.11 for wireless LANs as the MAC layer protocol. The simulated traffic is CBR with UDP source and sink. All experimental results presented in this section are averages of five runs on different randomly chosen scenarios. The following table summarizes the simulation parameters used.
CH 1
CH 3
CH 2
CN 1
CN 3
CN 2
Sink
Node included in the cluster
Node excluded from the cluster
Packet transmission from CH to CN
TABLE I Simulation Parameters
4.2. Performance Metrics
We compare AEERDAT with the extended AEERRP [19] scheme. We evaluate mainly the performance according to the following metrics.
Average end-to-end delay: The end-to-end-delay is averaged over all surviving data packets from the sources to the destinations.
Average Packet Delivery Ratio: It is the ratio of the number .of packets received successfully and the total number of packets transmitted.
Drop: It is the total number of packets dropped during the transmission.
Energy Consumption: It is the average energy consumption of all nodes in sending, receiving and forward operations.
The simulation results are presented in the next section.
4.3. Simulation Results
4.3.1. Based on Nodes
[image:7.595.63.272.106.331.2]In our first experiment we vary the number of nodes as 100,125,150,175 and 200.
Fig 4: Nodes Vs Delay
[image:7.595.322.524.283.413.2]From the figure 4, we can see that the average end-to-end delay of our proposed AEERDAT protocol is less than the existing AEERRP protocol
.
Fig 5: Nodes Vs Delivery Ratio
From the figure 5, we can see that the Delivery Ratio of our proposed AEERDAT is higher than the existing AEERRP protocol.
Fig 6: Nodes Vs Drop
From figure 6, we can see that the packet drop of our proposed AEERDAT is lower than the existing AEERRP protocol.
No. of Nodes 100,125,150,175 and 200
Area Size 500 X 500
Mac 802.11
Simulation Time 50 sec Traffic Source CBR Packet Size 512 Transmit Power 0.360 w Receiving Power 0.395 w Idle Power 0.335 w Initial Energy 8.1 J Transmission Range 75m
Rate 50,100,150 and 200Kb.
Nodes Vs Drop
0 1000 2000 3000 4000
100 125 150 175 200
Nodes
AEEFDAT AEERRP
Dr
o
p
(
P
k
ts
)
Nodes Vs Delay
0 5 10 15 20 25
100 125 150 175 200
Nodes
AEEFDAT
AEERRP
Del
a
y
(
S
e
c
)
Nodes Vs DeliveryRatio
0 0.5 1 1.5
100 125 150 175 200
Nodes
Del
iv
e
ry
R
a
ti
o
AEEFDAT
[image:7.595.321.529.498.631.2]Fig 7: Nodes Vs Energy
From figure 7, we can see that the Energy consumption of proposed AEERDAT is less than the existing AEERRP protocol.
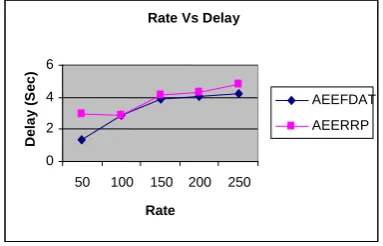
4.3.2. Based on Rate
In our experiment we vary the rate as 50,100,150 and 200Kb.
Fig 8: Rate Vs Delay
[image:8.595.339.528.74.196.2]From the figure 8, we can see that the average end-to-end delay of our proposed AEERDAT protocol is less than the existing AEERRP protocol.
Fig 9: Rate Vs Delivery Ratio
From the figure 9, we can see that the Delivery Ratio of our proposed AEERDAT is higher than the existing AEERRP protocol.
Fig 10: Rate Vs Drop
[image:8.595.70.262.350.473.2]From figure 10, we can see that the packet drop of our proposed AEERDAT is lower than the existing AEERRP protocol.
Fig 11: Rate Vs Energy
From figure 11, we can see that the Energy consumption of proposed AEERDAT is less than the existing AEERRP protocol.
5. CONCLUSION
In this paper, we have provided efficient data aggregation technique which considers both energy and reliability. Initially, the network is partitioned to various clusters .Each cluster selects a coordinator node (CN) randomly in the network which is closer to the cluster and monitors the operations of the sensor nodes and commands them for specific operations. In each cluster, the cluster head is selected based upon the cost value. The nodes in the cluster maintain a Neighbor information table (NIT) containing Node id, Distance and Cost. This NIT information is sent to the cluster head.. The cluster head aggregates the data and sends it to the CN. The CN calculates the loss ratio which is the ratio of number of packets dropped and total packets broadcast from the source. Based upon the loss ratio, the cluster size can be modified and the forward node count of each node can be incremented or decremented. Once the cluster size is changed, the CN gathers the information again from the cluster head compresses it and sends it to the sink. This technique proves to be efficient since the delay is reduced due to that the loss ratio is measured in the CN itself. Energy is reduced effectively and reliability is maintained when the size of the Nodes Vs Energy
0 2 4 6 8 10
100 125 150 175 200
Nodes AEEFDAT AEERRP E n e rg y ( J)
Rate Vs Drop
0 2000 4000 6000
50 100 150 200 250
Rate AEEFDAT AEERRP Dr o p ( P k ts )
Rate Vs Delay
0 2 4 6
50 100 150 200 250
Rate Del a y ( S e c ) AEEFDAT AEERRP
Rate Vs Energy
0 2 4 6 8
50 100 150 200 250
Rate E n e rg y ( J) AEEFDAT AEERRP
Rate Vs DeliveryRatio
0 0.2 0.4 0.6 0.8 1
50 100 150 200 250
[image:8.595.65.268.562.698.2]cluster is altered based upon the loss ratio. From our simulation results we prove that this technique is efficient in energy consumption and reliability.
5.
REFERENCES
[1] Nandini. S. Patil, and Prof. P. R. Patil “Data Aggregation in Wireless Sensor Network”, IEEE International Conference on Computational Intelligence and Computing Research, 2010.
[2] Kevin Yuen, Baochun Li, and Ben Liang “Distributed Minimum Energy Data Gathering and Aggregation in Sensor Networks,” IEEE International Conference on Communications ICC’ 06, Vol. 8, pp. 3536-3541, June 2006.
[3] Yang Yu, Bhaskar Krishnamachari, and Viktor K. Prasanna “Energy-Latency Tradeoffs for Data Gathering in Wireless Sensor Networks,” proceedings of International journal of Sensor Networks, Volume 4 Issue 1/ 2, pp. 48-54, July 2008.
[4] Kiran Maraiya, Kamal Kant, and Nitin Gupta, “Wireless Sensor Network: A Review on Data Aggregation”, International Journal of Scientific & Engineering Research Volume 2, Issue 4, Pp. 1-6, April -2011. [5] Hu¨ seyin Ozgu¨r Tan, Ibrahim Korpeoglu and Ivan
Stojmenovic “Computing Localized Power-Efficient Data Aggregation Trees for Sensor Networks”, IEEE Transactions On Parallel And Distributed Systems, VOL. 22, NO. 3, PP. 489-499, MARCH 2011.
[6] Nicolas Burri, Pascal von Rickenbach, and Roger Wattenhofer “Dozer: Ultra-Low Power Data Gathering in Sensor Networks,” proceedings of 6th international conference on Information proceeding and sensor networks, pp.450-459, April 25-27, 2007.
[7] Jonathan P. Benson, Utz Roedig, Andre Barroso, and Cormac J. Sreenan. “On the Effects of Aggregation on Reliability in Sensor Networks”, in proceedings of the 65th Vehicular Technology Conference VTC 2007, 2007. [8] Jae-Joon Lee, Bhaskar Krishnamachari and C.-C. Jay Kuo
“Impact of Energy Depletion and Reliability on Wireless Sensor Network Connectivity” , in proceedings of SPIE 2004, pp. 5440, 169, 2004.
[9] Jae-Joon Lee, Bhaskar Krishnamachari and C.-C. Jay Kuo “Impact of Energy Depletion and Reliability on Wireless Sensor Network Connectivity” , in proceedings of SPIE 2004, pp. 5440, 169, 2004.
[10] Vamsi Krishna Venkata Naga Nandanavanam “Energy-Efficient Reliable Sensor-To-Sink Data Transfer For Wireless Sensor Networks,” 2010 – Scholar works. boisestate.
[11] Ren P. Liu, John Zic, Iain B. Collings, Alex Y. Dong, and Sanjay Jha “Efficient Reliable Data Collection in Wireless Sensor Networks,” in proceedings of IEEE 68th Vehicular Technology Conference, VTC2008 , 2008. [12] Volker Turau and Christoph Weyer “Long-term Reliable
Data Gathering Using Wireless Sensor Networks,” proceedings of 4th International conference on networked Sensing Systems INSS '07, pp. 252-259, June 6-8 2007. [13] Hemant Sethi, Devendra Prasad, and R. B. Patel “EIRDA: An Energy Efficient Interest based Reliable Data Aggregation Protocol for Wireless Sensor Networks,” in proceedings of International Journal of Computer Applications, Volume 22– No.7, May 2011. [14] David Gugelmann, Philipp Sommer, and Roger
Wattenhofer “Poster Abstract: Reliable and Energy-Efficient Bulk-Data Dissemination in Wireless Sensor Networks,” in proceedings of SenSys’10, November 3–5, 2010.
[15] Mingming Lu and Jie Wu “Utility-Based Data-Gathering in Wireless Sensor Networks with Unstable Links,” proceedings of the 9th international conference on Distributed Computing and Networking ICDCN’ 08, pp. 3-24, 2008.
[16] Dazhi Chen and Pramod K. Varshney, “QoS Support in Wireless Sensor Networks: A Survey” International Conference on …, 2004 - adams.kwangwoon.ac.kr. [17] Mohamed A. el-Gendy, Abhijit Bose, Kang G.Shin,
“Evolution of the Internet QoS and Support for Soft Real-Time Applications”, In proceedings of IEEE, Vol.91, No. 7, pp. 1086-1104, 2003.
[18] S.Muthukarpagam, V.Niveditta, S.Neduncheliyan, “Design issues, Topology issues, Quality of Service Support for Wireless Sensor Networks: Survey and Research Challenges’ International Journal of Computer Applications (Volume 1 – No. 6, pp.1-4, 2010.
[19] S. M. Basavaraj and V. D. Mytri and Dr. Siddarama R. Patil, “An Adaptive Energy Efficient Reliable Routing Protocol for Wireless Sensor Networks”, ACEEE “International journal for network security”, Vol 1, Issue 1, January 2010.
[20] Network Simulator: http://www.isi.edu.nsnam/ns.