http://dx.doi.org/10.4236/ijcm.2016.77049
How to cite this paper: Adedoyin, R.A., Awotidebe, T.O., Borode, A.O., Ativie, R.N., Akindele, M.A., Adeyeye, V.O. and Johnson, O.E. (2016) Comparison of Blood Pressure Patterns of Teaching and Non-Teaching Staff of a Nigerian University. International Journal of Clinical Medicine, 7, 454-460. http://dx.doi.org/10.4236/ijcm.2016.77049
Comparison of Blood Pressure Patterns
of Teaching and Non-Teaching Staff of a
Nigerian University
Rufus A. Adedoyin1*, Taofeek O. Awotidebe1, Adedayo O. Borode1, Rita N. Ativie2, Mukadas A. Akindele3, Victor O. Adeyeye4, Olubusola E. Johnson1
1Department of Medical Rehabilitation, College of Health Sciences, Obafemi Awolowo University, Ile-Ife, Nigeria 2Department of Medical Rehabilitation, Faculty of Health Sciences and Technology, University of Nigeria,
Enugu, Nigeria
3Department of Physiotherapy, College Medical Sciences, Bayero University Kano, Kano, Nigeria 4Cardiac Care Unit, Obafemi Awolowo University Teaching Hospitals Complex, Ile-Ife, Nigeria
Received 7 January 2016; accepted 9 July 2016; published 12 July 2016
Copyright © 2016 by authors and Scientific Research Publishing Inc.
This work is licensed under the Creative Commons Attribution International License (CC BY). http://creativecommons.org/licenses/by/4.0/
Abstract
Objective: Differences in jobs descriptions and responsibilities may contribute to varying degree of exposure to diseases including high blood pressure. There is dearth of studies comparing blood pressure patterns and anthropometric parameters between teaching and non-teaching staff of university. Therefore, this study was designed to assess and compare the blood pressure and the anthropometric parameters of both teaching and non-teaching staff of a Nigerian university. Ma-terials and Methods: A cross-sectional study was conducted to assess blood pressure pattern and anthropometric parameters among 324 apparently healthy teaching (n = 120) and non-teaching (n = 202) staff of Obafemi Awolowo University, Ile-Ife, Nigeria. Anthropometric parameters in-cluding height, weight and hip and waist circumferences were measured. Blood pressure was measured thrice during office hours (9.00 - 11.00 hours) using standard procedures and hyper-tension was defined as ≥140 ≥90 mmHg. Descriptive and inferential statistics were used to analyze the data at p < 0.05 alpha level. Results: The mean of ages of teaching and non-teaching staff were 46.8 ± 9.8 and 45.6 ± 10.9 years. The prevalence of high blood pressure was 34.9% with a distribu-tion of teaching to non-teaching rate of 20.1% and 14.8% respectively. There were significant correlations between blood pressure and each of weight, body mass index and waist circumfe-rence in both groups (p < 0.05). Conclusion: Prevalence of high blood pressure was higher among teaching than non-teaching staff and significant correlations were found between blood pressure and some anthropometric parameters. Public health including regular physical activity enligh-tenment programmes to reduce blood pressure is recommended.
Keywords
Blood Pressure, Anthropometric Parameter, Teaching, Non-Teaching Staff, Nigerian University
1. Introduction
Hypertension or high blood pressure is the most common treatable risk factor for cardiovascular disease which accounts for about 25% of deaths globally [1][2]. Indeed, it has already been projected that up to three-quarters of the world’s hypertensive population will be in economically developing countries by the year 2025 [3]. The sudden increase in the prevalence of hypertension in sub-Saharan Africa (SSA) has been attributed to urbaniza-tion, industrializaurbaniza-tion, economic transition as well as globalization which bring about lifestyle changes and con-sequent predisposition to cardiovascular disease and other chronic diseases [4]. Thus, it is regarded as a serious public health problem being the leading cause of morbidity and mortality in SSA [5][6].
Although hypertension risk factors are numerous, sedentary lifestyles, poor dietary intake and occupational stress are now considered as risk factors for high blood pressure [7] [8]. More importantly, obesity resulting from physical inactivity has been linked with increased prevalence of hypertension [9]. Furthermore, significant association between work-related stress and cardiovascular complications has been reported [10][11]. Similarly, university staff are continually subjected to high level of psychological stress leading to chronic psychological disturbances such as excessive anger, anxiety, irritability and frustration [12][13].
Previously, Adedoyin et al., [14] reported moderate cardiovascular risk among university staff. They attributed this to reduced physical activity due to reduction in the active transportation such as walking and biking which have being replaced with proliferation of Tokunbo cars (fairly used imported cars) and Okada (commercial motor bike). Their study did not compare the level of cardiovascular risk between the academic (teaching) and non-teaching staff. We hypothesized that the academic staff would have higher risk of been hypertensive than the non-academic. Academic staff responsibilities include teaching, research, administration and community services while that of non-academic staff are mainly routine administrative works. Differences in jobs descriptions and responsibilities may contribute to varying exposures to diseases including high blood pressure. Presently, there is dearth of studies comparing blood pressure patterns and anthropometric parameters between teaching and non- teaching staff of universities. Therefore, this study was designed to assess and compare the blood pressure and the anthropometric parameters of both teaching and non-teaching staff of a Nigerian university.
2. Materials and Methods
2.1. Participants2.1.1. Research Design
This cross-sectional study recruited three hundred and twenty four (324) staff (academic = 122; non-academic =202) of the Obafemi Awolowo University, Ile-Ife, Nigeria using purposive sampling technique.
2.1.2. Population and Participants
The Obafemi Awolowo University was established in 1962. It is one of the first generation Federal Government Universities. There are two colleges and 13 faculties with 103 academic departments and units as well as seven specialized centres and institutes. The central campus comprises the academic, administrative units and service centers while the student residential area is made up of 10 undergraduate hostels and a postgraduate hall of resi-dence [15]. Both teaching and non-teaching were approached to participate in this study.
Inclusion criteria
Eligibility for inclusion was apparently healthy individuals free of obvious disabilities and full-time workers of the institution.
Exclusion criteria
Pregnant women and causal workers were excluded from the study.
2.2. Procedure
College of Health Sciences, Obafemi Awolowo University, Ile-Ife, Nigeria. The purpose of the study was ex-plained to the participants and informed consent was obtained. Data collection took place between 9:00-11:00 hours.
2.2.1. Assessment of Blood Pressure
Blood pressure of participants was measured using a validated electronic blood pressure kit (Omron Intelli Sense M6 Comfort, Japan) after about 10 minutes of quiet sitting. The blood pressure was measured in sitting position with the feet flat on the floor and the arm placed on the table so that the arm is at the same level as the heart. The cuff of the sphygmomanometer (of appropriate size) was wrapped around the left upper arm and the participants were instructed to remain calm and not to talk during the measurement while the palm was turned upward [16]. Three readings were taken at five minutes interval and the average was used for the analysis.
2.2.2. Assessment of Anthropometric Parameters
The weight of each participant was measured using a portable weighing scale (Seca 761, CE: 0109 0123, United Kingdom). The participant was asked to stand erect on the weighing scale bare-footed with light clothing with-out holding or carrying anything with them. The participant stood erect, looking straight ahead with as minimal amount of clothing and accessories as possible, considering the site of data collection. The height of participants was measured using a height meter with the participant standing upright, both arms lying by the sides, eyes looking straight without shoes while standing against the height meter placed against the wall with the partici-pant’s heels, back and the occiput touching the height meter. Waist and hip circumferences of participant was measured in centimeters using a measuring tape. The waist circumference was measured with the participants standing upright with their feet together arms by side with the palm facing inward and the measuring tape wrapped around the participants’ abdomen horizontally and positioned at the level of the umbilicus. Instruction was given to the participant to relax and breathe normally and with the tape measure aligned together horizon-tally. Measurement was then taken from zero line of tape at the end of expiration when the diaphragm is in neu-tral position. The hip circumference was measured at the widest diameter of the buttock; the greatest concavity of the buttock and measurement taken from zero line of the tape [17].
2.3. Data Analysis
Descriptive statistics of frequency, percentage, mean and standard deviation was used to summarize data. T-test was used to compare blood pressure and anthropometric parameters between teaching and non-teaching staff. Pearson Product Moment Correlation Analysis was used to determine the correlation between anthropometry and blood pressure among participants. Significant difference was set at p < 0.05. Data analysis was performed using Statistical Package for Social Science (SPSS 17.0 version).
3. Results
The sample comprised 324 participants with 122 teaching and 202 non-teaching staff. Table 1 showed physical characteristics of all participants. The mean age of academic and non-academic staff were 46.8 ± 9.8 and 45.6 ± 10.9 years respectively. All participants were comparable in age but significantly different in physical characte-ristics of weight, height, waist circumference and body mass index (p < 0.05).
Table 2 showed the prevalence of hypertension among teaching and non-teaching staff using the 140/90 mmHg cuff-point. The result showed that the prevalence of hypertension was higher among teaching than non-teaching staff. The total prevalence rate of hypertension among teaching and non-teaching 34.9% with an academic-to-non-academic distribution of 20.1% to 14.8% respectively. Furthermore, percentage of systolic hypertension among teaching and non-teaching staff were 25.4% and 17.4% respectively. Similarly, the percen-tage of diastolic hypertension in both groups were 14.7% and 12.1% respectively. The comparison of blood pressure profile between teaching and non-teaching staff showed that the academic staff has significantly higher systolic blood pressure than non- teaching staff (t = 2.268; p = 0.025). However, there was no significant differ-ence in the diastolic blood pressure in both groups (t = 1.326; p = 0.187).
Table 1. Physical characteristics of the participants.
Teaching staff Non-teaching staff
Variables Mean ± S.D Mean ± S.D t-cal. p-value
Age (years) 46.8 ± 9.8 45.6 ± 10.9 1.652 0.101
Height (m) 1.72 ± 0.08 1.65 ± 0.08 6.079 0.010*
Weight (kg) 74.96 ± 13.6 67.19 ± 11.4 5.600 0.010*
Waist Circumference 90.7 ± 11.1 88.3 ± 10.8 2.463 0.015*
Hip Circumference 99.8 ± 8.8 98.6 ± 8.9 1.789 0.076
Body mass index 25.4 ± 4.0 24.2 ± 4.7 2.079 0.040*
*Significant at p < 0.05.
Table 2. Prevalence of hypertension and comparison of blood pressure profile between teaching and non-teaching staff.
Variable Teaching staff Non-teaching staff
Blood Pressure % %
SBP (mmHg) 25.4 17.4
DBP (mmHg) 14.7 12.1
Teaching staff Non-teaching staff
Blood Pressure Mean ± S.D Mean ± S.D t-cal p-value
SBP 130.94 ± 14.6 126.97± 18.8 2.268 0.025*
DBP 77.7 ± 10.7 75.7 ± 11.3 1.326 0.187
*
[image:4.595.90.538.431.649.2]Significant at p < 0.05. Key: SBP; Systolic blood pressure. DBP; Diastolic blood pressure.
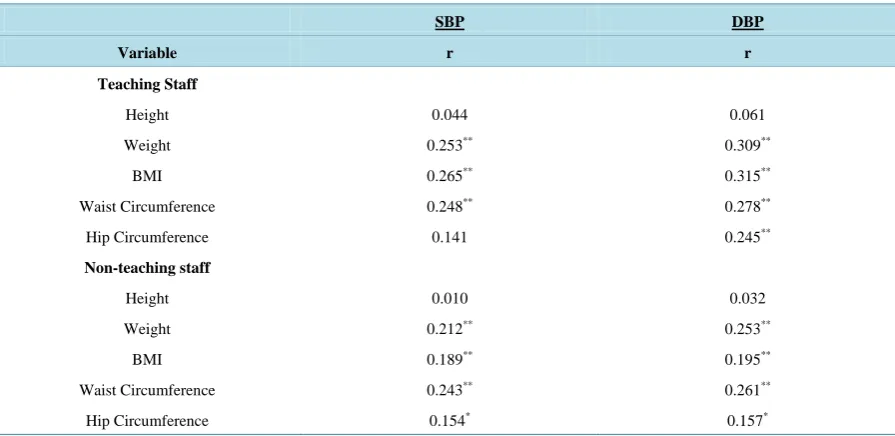
Table 3. Correlation between anthropometry and blood pressure among teaching staff non-teaching staff.
SBP DBP
Variable r r
Teaching Staff
Height 0.044 0.061
Weight 0.253** 0.309**
BMI 0.265** 0.315**
Waist Circumference 0.248** 0.278**
Hip Circumference 0.141 0.245**
Non-teaching staff
Height 0.010 0.032
Weight 0.212** 0.253**
BMI 0.189** 0.195**
Waist Circumference 0.243** 0.261**
Hip Circumference 0.154* 0.157*
**
Correlation is significant at p < 0.01. Key: SBP; Systolic blood pressure. DBP; Diastolic blood pressure.
0.195), waist circumference (r = 0.243; 0.261) (p < 0.01) and waist circumference (r = 0.159; 0.154) (p < 0.05).
4. Discussion
This study assessed the blood pressure of staff of the Obafemi Awolowo University, Ile-Ife, Nigeria and com-pared the blood pressure and the anthropometric parameters of both teaching and non-teaching staff. The study shows a significant difference in systolic blood pressure of teaching and non-teaching staff but no significant difference in the diastolic blood pressure in both groups. Also, this study shows the prevalence rate of hyperten-sion among teaching to be higher than that of non-teaching staff. It has been reported that a high level of psy-chological stress during certain occupational activities (public speeches like lectures in class and at meetings and seminars) contributes to blood pressure increase among certain professionals predominantly those with high in-tellectual activity like university lecturers [18][19]. This is supported by study done by Fauvel et al., [20] in which psychological stress is related to high blood pressure as well as unfavourable cardiovascular profile.
Kulkami et al., [21] explained that stress can cause hypertension through repeated blood pressure elevations as well as by stimulation to the nervous system to produce large amounts of vasoconstricting hormones that in-creases blood pressure. Furthermore, when one risk factor is coupled with other stress producing factors, the ef-fect on blood pressure is multiple. Some of the factors afef-fecting blood pressure through stress include white coat hypertension, job strain, race, social environment, and emotional distress. Development of high blood pressure may be associated with the poor knowledge on the risk factors for hypertension which may also result into ina-bility of the staff to manage hypertension effectively. In the study conducted by Abdullah et al., [22] on the knowledge of hypertension of the University of Ibadan staff, they found that the staff has low knowledge of some of the risk factors.
Our study shows that there were strong significant correlations between weight, body mass index, waist cir-cumference and systolic blood pressure as well as diastolic blood pressure among the teaching and non-teaching staff. These findings corroborate the study of Adebayo et al., [23] which indicated a trend towards increase pre-valence of risk of hypertension in Nigeria. Furthermore, Adebayo et al., [23] reported increased body mass in-dex (BMI) significantly increase blood pressure in adults and this was supported by other authors [24]-[27]. Ad-ditionally, Adedoyin et al., [16] reported similar findings in which weight and BMI were significantly correlated with systolic blood pressure and diastolic blood pressure but the correlations were weak contrary to that found in this study. Contrast to our findings, independent association between body mass index and systolic and diastolic blood pressure has been reported [28][29]. Furthermore, Janssen et al., [30] reported that waist circumference and not BMI explains obesity related health risk including hypertension. Increased blood pressure has been linked to the influence of modernization with concurrent increase in western lifestyle which increases the preva-lence of obesity [16][31].
According to study by Adebayo et al., [21] a significant correlation was found between hip circumference and diastolic blood pressure whereas no significant correlation was found between hip circumference and systolic blood pressure. This is consistent with the finding among teaching staff; however, hip circumference shows a significant correlation with both the systolic and diastolic blood pressure. In contrast to study conducted by Snijder et al. [32] an inverse relationship was found between hip circumference and blood pressure.
The increased prevalence of hypertension has also been associated with economic, dietary and lifestyle change which are by-products of the influence of modernization which have become perennial in the society [16]. It has however been noticed among the academic staff that they have little or no time for physical activity due to the nature of their work and as such are more prone or susceptible to increased blood pressure. Transition to a sedentary lifestyle as strong risk factor for hypertension has been reported, however a change from a seden-tary lifestyle to an active one can reduce blood pressure level and subsequently lower cardiovascular risk by 30% [33][34]. Therefore, it has been recommended that routine assessment could be of help to detect people that are at high risk of developing hypertension and approaches to reduce the risk of hypertension such as prevention of overweight and obesity and promotion of physical activity should be encouraged [16].
5. Conclusion
It was concluded that the academic staff have higher blood pressure than non-academic staff. Furthermore, anthropometric characteristics were significantly associated with blood pressure. It is therefore recommended that a periodic re-assessment be made to keep abreast of the changes in the blood pressure as well as to detect those that are at risk of developing hypertension so that preventive measures could be put in place. Therefore, more emphasis should be placed on prevention than treatment of hypertension.
Acknowledgements
The authors wish to thank the management of the Obafemi Awolowo University, Ile-Ife, Nigeria for granting permission to conduct this study among university staff.
Disclosure of Interest
The authors declare that they have no conflicts of interest concerning this article.
References
[1] Alberts, M., Urdal, P., Steyn, K., et al. (2005) Prevalence of Cardiovascular Diseases and Associated Risk Factors in a Rural Black Population in South Africa. European Journal of Preventive Cardiology, 12, 347-354.
http://dx.doi.org/10.1097/01.hjr.0000174792.24188.8e
[2] World Health Organization (2011) Global Atlas on Cardiovascular Disease Prevention and Control. Geneva.
[3] Kearney, P.M., Whelton, M., Reynolds, K., et al. (2005) Global Burden of Hypertension: Analysis of Worldwide Data.
The Lancet, 365, 217-23. http://dx.doi.org/10.1016/S0140-6736(05)70151-3
[4] Kadiri, S. (2005) Tackling Cardiovascular Diseases in Africa. BMJ West African Edition, 8, 172-173.
http://dx.doi.org/10.1136/bmj.331.7519.711
[5] World Health Organization (2002) World Health Report. Reducing Risks, Promoting Healthy Life. World Health
Or-ganization, 57.
[6] Cappuccio, F.P., Micah, F.B., Emmett, L., et al. (2004) Prevalence, Detection, Management, and Control of Hyperten-sion in Ashanti, West Africa. Hypertension, 43, 10-17. http://dx.doi.org/10.1161/01.HYP.0000126176.03319.d8
[7] Cooper, R.S., Amoah, A.G. and Mensah, G.A. (2003) High Blood Pressure: The Foundation for Epidemic
Cardiovas-cular Disease in African Populations. Ethnicity & Disease, 13, S48-S52.
[8] BeLue, R., Okoror, T.A., Iwelunmor, J., et al. (2009) An Overview of Cardiovascular Risk Factor Burden in Sub-Saharan African Countries: A Socio-Cultural Perspective. BMC. Globalization and Health, 5, 10.
http://dx.doi.org/10.1186/1744-8603-5-10
[9] Murray, C.J. and Lopez, A.D. (1997) Mortality by Cause for Eight Regions of the World: Global Burden of Disease.
The Lancet, 349, 1269-1276. http://dx.doi.org/10.1016/S0140-6736(96)07493-4
[10] Nordstrom, C.K., Dwyer, K.M., Merz, C.N., et al. (2001) Work-Related Stress and Early Atherosclerosis. Epidemiol-ogy, 12, 180-185. http://dx.doi.org/10.1097/00001648-200103000-00009
[11] Flaa, A., Mundal, H.H., Eide, I., et al. (2006) Sympathetic Activity and Cardiovascular Risk Factors in Young Men in the Low, Normal, and High Blood Pressure Ranges. Hypertension, 47, 396-402.
http://dx.doi.org/10.1161/01.HYP.0000203952.27988.79
[12] Schneider, G.M., Jacobs, D.W., Gevirtz, R.N., et al. (2003) Cardiovascular Haemodynamic Response to Repeated Mental Stress in Normotensive Subjects at Genetic Risk of Hypertension: Evidence of Enhanced Reactivity, Blunted Adaptation, and Delayed Recovery. Journal of Human Hypertension, 17, 829-840.
http://dx.doi.org/10.1038/sj.jhh.1001624
[13] Chan, D.W. (2003) Hardiness and Its Role in the Stress-Burnout Relationship among Prospective Chinese Teachers in
Hong Kong. Teaching and Teacher Education, 19, 381-395. http://dx.doi.org/10.1016/S0742-051X(03)00023-4
[14] Adedoyin, R.A., Mbada, C.E., Balogun, M.O., et al. (2008) Prevalence and Pattern of Hypertension in a Semi-Urban
Community in Nigeria. European Journal of Preventive Cardiology, 15, 683-687.
http://dx.doi.org/10.1097/HJR.0b013e32830edc32
[15] Obafemi Awolowo University. www.oauife.edu.ng
[16] Adedoyin, R.A., Mbada, C.E., Bisiriyu, L.A., et al. (2008) Relationship of Anthropometric Indicators with Blood Pressure Levels and Risk of Hypertension in Nigerian Adults. International Journal of General Medicine, 1, 33-40.
[17] Welborn, T.A. and Dhaliwal, S.S. (2007) Preferred Clinical Measures of Central Obesity for Predicting Mortality. Eu-ropean Journal of Clinical Nutrition61, 1373-1379. http://dx.doi.org/10.1038/sj.ejcn.1602656
[18] Wu, S., Li, J. and Wang, M. (2006) Intervention on Occupational Stress among Teachers in the Middle Schools in China. Stress and Health, 22, 329-336. www.nlm.nih.gov/medlineplus
http://dx.doi.org/10.1002/smi.1108
[19] Jin, P., Yeung, A.S., Tang, T.O., et al. (2008) Identifying Teachers at Risks in Hong Kong: Psychosomatic Symptoms and Sources of Stress. J Psychosom Res., 65, 357-362. http://dx.doi.org/10.1016/j.jpsychores.2008.03.003
[20] Fauvel, J.P., Quelin, P., Ducher, M., et al. (2001) Perceived Job Stress but Not Individual Cardiovascular Reactivity to Stress Is Related to Higher Blood Pressure at Work. Hypertension, 38, 71-75.
http://dx.doi.org/10.1161/01.HYP.38.1.71
[21] Kulkami, S., O’Farrell, I., Erasi, M. and Kochar, M.S. (1998) Stress and Hypertension. WMJ, 97, 34-38.
[22] Abdulahi, A.A. and Amzat, J. (2011) Knowledge of Hypertension among the Staff of University of Ibadan, Nigeria.
Journal of Public Health and Epidemiology, 3, 204-209.
[23] Adebayo, R.A., Balogun, M.O., Adedoyin, R.A., et al. (2013) Prevalence of hypertension in three rural communities of Ife-North Local Government of Osun State, Southwest Nigeria. International Journal of General Medicine, 6, 863-868.
http://dx.doi.org/10.2147/IJGM.S51906
[24] Wang, J., Thornton, J.C., et al. (2003) Comparisons of Waist Circumferences Measured at 4 Sites. The American Journal of Clinical Nutrition, 77, 379-384.
[25] Yekeen, L.A., Sanusi, R.A. and Ketiku, A.O. (2003) Prevalence of Obesity and High Level of Cholesterol in
Hyper-tension: Analysis of Data from the University College Hospital, Ibadan. African Journal of Biomedical Research, 6, 129-132.
[26] Gus, M., Fuchs, S.C., Moreira, L.B., et al. (2004) Association between Different Measurements of Obesity and the In-cidence of Hypertension. American Journal of Hypertension, 17, 50-53.
http://dx.doi.org/10.1016/j.amjhyper.2003.08.010
[27] Yildiran, H., Acar, T.N., Koksal, E., et al. (2011) The Association of Anthropometric Measurements and Lipid Profiles in Turkish Hypertensive Adults. African Health Sciences, 11, 407-413.
[28] Woo, J., Ho, S.C., Yu, A.L., et al. (2002) Is Waist Circumference a Useful Measure in Predicting Health Outcomes in the Elderly? International Journal of Obesity and Related Metabolic Disorders, 26, 1349-1355.
http://dx.doi.org/10.1038/sj.ijo.0802080
[29] Shahbazpour, N. (2003) Prevalence of Overweight and Obesity and Their Relation to Hypertension in Adult Male University Students in Kerman, Iran. International Journal of Endocrinology and Metabolism, 2, 55-60.
[30] Janssen, M.D. (2008) Role of Body Fat Distribution and the Metabolic Complications of Obesity. The Journal of Clin-ical Endocrinology & Metabolism, 93, S57-S63. http://dx.doi.org/10.1210/jc.2008-1585
[31] Misra, A. and Khurana, L. (2008) Obesity and the Metabolic Syndrome in Developing Countries. The Journal of
Clin-ical Endocrinology & Metabolism, 93, S9-S30. http://dx.doi.org/10.1210/jc.2008-1595
[32] Snijder, M.B., Zimmet, P.Z., Visser, M., et al. (2004) Independent and Opposite Associations of Waist and Hip
Cir-cumferences with Diabetes, Hypertension and Dyslipidemia: The AusDiab Study. International Journal of Obesity and
Related Metabolic Disorders, 28, 402-409. http://dx.doi.org/10.1038/sj.ijo.0802567
[33] Whelton, S.P., Chin, A., Xin, X., et al. (2002) Effects of Aerobic Exercise on Blood Pressure: A Meta-Analysis of Randomised, Controlled Trials. Annals of Internal Medicine, 36, 493-503.
http://dx.doi.org/10.7326/0003-4819-136-7-200204020-00006
[34] Whelton, P.K., He, J., Appel, L.J., et al. (2002) Primary Prevention of Hypertension: Clinical and Public Health Advi-sory from The National High Blood Pressure Education Program. JAMA, 288, 1882-1888.