Study on Voltage Sag Detection of Wind Power System
Based on HHT
Yanqing Li, Ting Yue, Hongling Xie, Feilong Wang
Hebei Provincial Key Laboratory of Power Transmission Equipment Security Defense, North China Electric Power University, Baoding, China
Email: [email protected]
Received December, 2012
ABSTRACT
For the output of wind power system has the characteristics of randomness, volatility and intermittence, the voltage of wind power system fluctuates frequently and voltage sag is one of the most common voltage fluctuations in wind power system. For the problem of voltage sag of wind power system, the limitations of the detection methods such as the square detection method, the half-wave RMS detection method and wavelet transform are summed up, and a new de-tecting method named Hilbert-huang Transform(HHT) is put forward in this paper, which can detect the voltage sag accurately and timely. In order to solve the problem of end effect in the process of empirical mode decompostion (EMD), a self-adaptive method named improved waveform matching is applied in dealing with the end issue. Voltage fluctuations are reflected by two parameters named voltage amplitude and frequency of each intrinsic mode function (IMF) in HHT. The practicality of the method is verified by Matlab simulation.
Keywords: HHT; Wind Power System; Voltage Sag; Detection
1. Introduction
With the development of the society, we are facing a problem of a gradually reduce of primary energy reserves, it is essential for us to develop other forms of energy. In such a background, renewable and clean wind gradually cause concern at home and abroad in the related field, large-scale development and utilization of wind power is considered to be an effective measure to solve the energy crisis and environment pollution problem. Our country has massive land, abundant wind power, so if we make full use of this energy, not only can we create consider-able economic benefits, but we can also effectively re-lieve the pressure caused by the shortage of traditional energy, and we also can provide long-term effective en-ergy supply[1].
The development of new energy resources in China, such as wind power, conforms to the strategic require-ments of sustainable development. However, wind power is vulnerable to natural climate influence. The output of wind power system has the characteristics of randomness, volatility and intermittence. Wind power system voltage fluctuations may happen at any time, which is difficult to control. Voltage sag is one of the most common forms of voltage fluctuation. It has serious impact on the power quality of wind power system, causes great harm to the sensitive loads, brings great difficulties to wind power
integration, and seriously restricts the large-scale devel-opment of wind power.
We need to detect real-time wind power system volt-age sag’s happen time and amplitude effectively, so that we can take certain compensation measures and improve the wind power system’s power supply reliability and power quality. This paper presents a improved HHT me-thod to detect voltage sag of the wind power system. This method is based on the waveform matching method for end processing. And the simulation results verify the practicability.
2. Method Introduction
2.1. HHT Introduction
Hilbert-Huang transformation(HHT) is a new developed method for signal analysis. This method consists the em-pirical mode decomposition(EMD) and Hilbert transfor-mation[6]. Through the EMD decomposition, signal can be decomposed into a series of intrinsic mode function (IMF). The intrinsic mode function is a signal which is approximate to single-frequency components, which means at all times, there is only one signal frequency component. For each intrinsic mode function on Hilbert transform, we can get the instantaneous spectrum of each IMF.
1) EMD process
According to the maximum point and the minimum point of the signal x t( ),
1( )
we can find out the average of the upper envelope x t and the lower envelope x t2( ).
1 1 2
1
[ ( ) ( )] 2 x t x t
(1)
Then calculate the difference between x t( ) and 1
as 1:
1 x t( ) 1
(2)
If 1 satisfies the two conditions of IMF( The
number of the points which past the extreme point and
zero point is the same or differ at most one. The signal
is symmetric about time axis), 1 is the first IMF
component of x t( )[7]. If 1 doesn’t satisfy the two
conditions of IMF, Put 1 as raw data. Repeat the
above process k times, get 1k 1(k1)1k, then judge whether each screening results are IMF components us-ing SD.
2 1( 1) 1
2 0 1( 1)
( ) ( ) ( ) n k k D t k t t S t
(3)in Formula (3), SD can be determined according to the
actual requirements. If 1k satisfies the requirement of
D
S , then make 11k, and 1 is the first IMF
compo-nent of signal ( )x t . Separate 1 from x t( ) as Formula
(4):
1 ( )
r x t
Take r1 as the new x t( )
,
and repeat the above process, we can get 2, 3, 4 … Stop until rn is monotonic or
n
r is very small. The result of the decomposition is as
follows: 1 ( ) ( ) n i i n
x t t
r
(5)2) Hilbert transformation
Do Hilbert transformation on i( )t which is a IMF
component as follows:
( ) 1
( ) i
i H t t d
(6)Its inverse transform is as follows:
( ) 1
( ) i
i H t t d
(7)We can get analytic signal A t( ):
( )
( ) ( ) ( ) ( ) jit
i i i i
A t t jH t a t e (8) The instant amplitude:
2 2
( ) ( ) ( )
i i i
a t t H t ,
The phase:
( ) ( ) arctan .
( ) i i i H t t t
The instant frequency:
( ) 1 ( ) 2 i i d t f t dt
(9)
2.2. Introduction of End Effect
In the decomposition process of empirical mode, we need to calculate the local average of signal according to the envelope in the calculating process of the IMF. What's more, the upper and lower envelope can respectively be obtained by making cubic spline interpolation algorithm on signal’s local maximum and local minimum[8]. Due to the signal’s two endpoints are not necessarily the ex-treme point which couldn’t satisfy the requirements of interpolation, so it may bring some error, this situation is so-called end effect.
2.3. Introduction of Self-adaptive Method Named Improved Waveform Matching
In the aspect of end effect’s inhibition, common methods include mirror continuation method, continuation method based on neural network, continuation method based on polynomial fitting, etc. These methods can inhibit end effect to a certain extent. But they also have some prob-lems[9]. In order to detect voltage sags of wind power system quickly, a self-adaptive method named improved
1
waveform matching is applied in dealing with the end issue. The core idea of the waveform matching method is as follows: According to the law of nature signal, we assume that the development and change of the signal is always according to certain rules. Signal’s development trend at boundaries will also be reflected in inner signal, especially for the regularity strong signal, this feature will be more obvious. In order to test the true extent for continuation waveform, we need to introduce the concept of waveform matching degree to test the authenticity of
the continuation waveform. Assume 1 2 are two
data sequences whose length both are N. 1 1
2 2 are two points on . Then the
waveform matching degree of 1 2 which
rela-tive to 1 can be obtained according to the
follow-ing steps.
( ) ( )
f t f t, S t
1( ) ( )2
f t f t,
( ), f t( )
( ,f t( )), ( , ( ))
S t f t
,
S
f t
2
S
1) Translating coincides the and , the
new waveform is
1( )
f t
' 1( )
1
S S2
f t ;
2) Obtain the waveform matching degree of 1
2 which relative to according to formula
(10).
( )
f t,
( )
f t S1, S2
'
1 2 2 1
1
( ( ) ( ) S) ( ( ) ( ))
N
j
md f t f t f j f j
, , 2
(10)
Concrete steps of waveform matching method are as follows:
1) Obtain all extreme points Mi of original signal
, put the maximum points into set{ } and the
minimum points into set { };
( )
f t Mi,max
,min
i
2) The first minimum point is 0
M
M and the first
maximum point is Mi. The distance between M1 and
at the start time is
( )
f t sd0. The length of sd0
M
is l;
3) The waveform matching degree of all respect
to
,max
i
0
sd is i;
4) The minimum wave band of mdi is i
md
sd .If
i
md l (is a constant which is determined by the
matching accuracy requirements), take i as
wave-form continuation of ’s left end. Otherwise, process
according to the step (5);
md
( )
f t
5) Specify the maximum and the minimum of the endpoint directly. Take the average value of two adjacent maximum points at original signal’s left-most derivation as the maximum at left end. Take the average value of two adjacent minimum points at original signal’s left- most derivation as the minimum at left end.
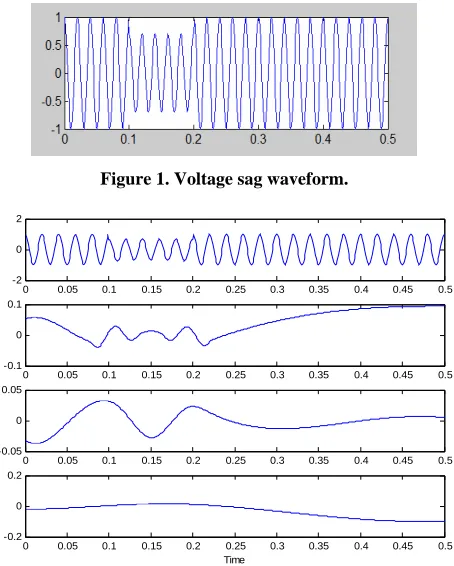
3. Example Simulation
In fact, due to natural environment’s influence on the voltage of wind power system, fluctuations are more complex. This paper does some simulation analysis to voltage sags of wind power system voltage fluctuation. During the non-sag, we assume the wind power system voltage waveform always remain unchanged(amplitude is rated voltage and its frequency is 50 Hz). Voltage sag
usually refers to root-mean-square voltage quickly drop to 90% - 10% of the rated voltage, and then quickly re-store to the normal voltage. Its typical duration is 0.5-30 period [10]. Accordingly, we assume that a wind power system voltage RMS temporarily reduces to 70% of the rated voltage, and the duration is five period. The voltage function is shown in Equation (11), and the voltage sag
waveform is shown in Figure 1.
cos(100 ),
( )
0.7 cos(100 ), 0.1 0.2
t others u t
t t
(11)
For the problem of voltage sag, this paper firstly apply waveform matching data continuation subroutine within Matlab to the extension of original signal, which can effectively avoid the end effect in the process of HHT transform. Then call the procedure about Hilbert-huang Transform to do HHT treatment for the continuation sig-nal, and output the amplitude / time, frequency / time curve of IMF1. Finally, according to the amplitude/time, frequency/time curve of IMF1, we got the voltage am-plitude and voltage frequency of wind power system when voltage sag happened, which could help to judge the time and the amplitude about voltage sag. HHT simulation
results are shown in Figure 2 and Figure 3. And the
si-mulation is after the endpoint processing based on the waveform matching adaptive.
[image:3.595.311.538.432.715.2]In the simulation, we assume a voltage sag happen af-ter 0.1 - 0.2 s. We can conclude that the voltage is only
Figure 1. Voltage sag waveform.
0 0.05 0.1 0.15 0.2 0.25 0.3 0.35 0.4 0.45 0.5 -2
0 2
0 0.05 0.1 0.15 0.2 0.25 0.3 0.35 0.4 0.45 0.5 -0.1
0 0.1
0 0.05 0.1 0.15 0.2 0.25 0.3 0.35 0.4 0.45 0.5 -0.05
0 0.05
0 0.05 0.1 0.15 0.2 0.25 0.3 0.35 0.4 0.45 0.5 -0.2
0 0.2
Time
0.62 times the rated voltage at the moment of 0.1s or 0.2s from the HHT simulation results; At the moment near 0.1 s or 0.2 s, the instantaneous frequency also has great changes. The highest frequency is up to 78.64 Hz, the minimum frequency is only 19.8 Hz. We can judge the situation of voltage sags in wind power system effec-tively and in real time according to the mutations of the voltage parameter.
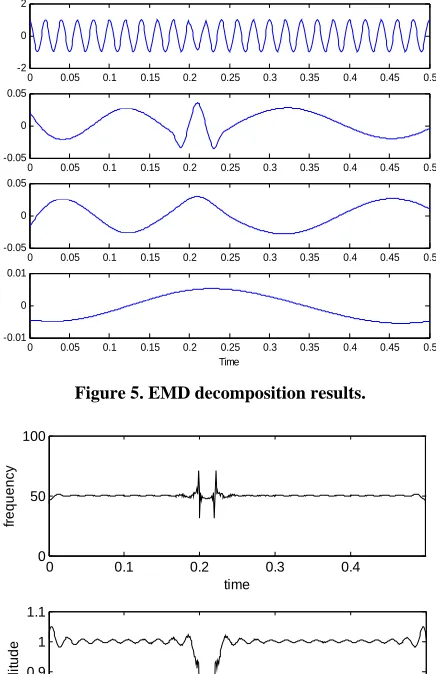
If the wind power system voltage RMS temporary de-cline to 80% of the rated voltage, and the duration is 0.5 a period, then voltage function is shown in formula12,
voltage waveform is shown in Figure 4.
cos(100 ),
( )
0.8 cos(100 ), 0.2 0.21
t others u t
t t
(12)
Voltage sag parameters of a wind power system are as follows: the root-mean-square voltage temporarily reduce to 80% of the rated voltage, the duration is 0.5 periods. HHT simulation results after self-adaptive endpoint
treatment based on waveform matching is shown in
Fig-ure 5, Figure 6.
0 0.1 0.2 0.3 0.4
0 50 100
time
fr
eque
n
c
y
0 0.1 0.2 0.3 0.4 0.5
0.8 1 1.2 1.4
time
a
m
pli
tud
[image:4.595.313.531.90.427.2]e
Figure 3. IMF1’s amplitude, frequency variation overtime.
0 0.05 0.1 0.15 0.2 0.25 0.3 0.35 0.4 0.45 0.5 -2
-1.5 -1 -0.5 0 0.5 1 1.5 2
time
amp
lit
ud
[image:4.595.63.282.352.517.2]e
Figure 4. Voltage mutation waveform.
0 0.05 0.1 0.15 0.2 0.25 0.3 0.35 0.4 0.45 0.5 -2
0 2
0 0.05 0.1 0.15 0.2 0.25 0.3 0.35 0.4 0.45 0.5 -0.05
0 0.05
0 0.05 0.1 0.15 0.2 0.25 0.3 0.35 0.4 0.45 0.5 -0.05
0 0.05
0 0.05 0.1 0.15 0.2 0.25 0.3 0.35 0.4 0.45 0.5 -0.01
0 0.01
Time
Figure 5. EMD decomposition results.
0 0.1 0.2 0.3 0.4
0 50 100
time
fr
equ
ency
0 0.1 0.2 0.3 0.4 0.5
0.7 0.8 0.9 1 1.1
time
am
pl
it
ud
e
Figure 6. IMF1 amplitude, frequency variation over time.
The HHT simulation results show that in the half cycle start at 0.2 s, the wind power system voltage changes. At the time of 0.2 s, the minimum voltage of wind power system is 0.77 times the rated voltage. At the time of 0.2 s, instantaneous frequency also have great changes, The highest frequency is 68.4 Hz, the minimum frequency is only 32.2 Hz. We can judge the situation of voltage sags in wind power system effectively and in real time ac-cording to the mutations of the voltage parameter.
4. Conclusions
[image:4.595.59.287.546.728.2]in real time, can accurately judge the moment of voltage sag and the voltage amplitude after sag and voltage sag’s duration. Export voltage of wind power system is influ-enced by the natural environment, so the export voltage is fluctuating. Practical problems are more complex than the research of voltage sag in this paper and it is more difficult to detect voltage fluctuation. The detection me-thod used in this paper is especially for voltage sag of wind power system. In order to strengthen the control of the wind power system, we also need to do further re-search on other voltage fluctuation problems.
REFERENCES
[1] Y. Zhang and G. D. Gao, “Wind power generation,” Bei-jing, China Power Press, 2002.
[2] Y. Y. Hu, S. S. Niu, Z. R. Liang, etc. “Of Voltage Flicker Measurement Algorithm,” Journal of Low Voltage Elec-trical Appliances, 2012, pp. 32-36.
[3] S. J. Hu, J. L. Li and M. L, “Test Method of Wind Power
System’s Implementation LVRT Grid Voltage Drop. High Power Communication Technology, Vol. 2, 2008, pp. 17-21.
[4] X. P. Wei, Y. H. Xu and X. G. Xiao, “Voltage Fluctua-tion and Flicker DetecFluctua-tion Methods in Electric Measure-ment and InstruMeasure-ment., Vol. 46, 2009, pp. 1-6.
[5] Y. C. Liu, “Analysis and Study of Voltage Sag’s Detec-tion Method,” Changsha: hunan university, 2007.
[6] T. Y. Li, Y. Zhao, N. Li N, etc. “New Method for the Detection of Power Quality Based on the HHT,” Chinese Journal of Electrical Engineering, Vol. 17, 2005, pp. 32-56.
[7] Y. M. Zhong, S. R. Qin and B. P. Shang, “Research of Hilbert - Huang Transform,” Journal of Vibration and Impact, Vol. 21. 2002, pp. 13-17.
[8] D. J. Yu, J. S. Cheng, Y. Yang and H. Hilbert, “Trans-form Method for Mechanical Fault Diagnosis,” Beijing: Science Press, 2006.