Journal of Chemical and Pharmaceutical Research, 2017, 9(2):92-98
Research Article
CODEN(USA) : JCPRC5
ISSN : 0975-7384
92
Fluorescent Carbon Dots as Nanosensor for Sensitive and Selective
Detection of Cefixime based on Inner Filter Effect
Farhad Akhgari, Naser Samadi
*and Khalil Farhadi
Department of Analytical Chemistry, Faculty of Chemistry, Urmia University, Urmia, Iran _____________________________________________________________________________
ABSTRACT
A simple and sensitive fluorescent assay was developedfor the sensitive and selective determination of cefixime based on inner filter effect (IFE). In this sensing platform, fluorescent carbon dots (CDs) were prepared by one-pot synthesis and was directly used as fluorophore in IFE. The method is based on the complexation reaction between cefixime and palladium ion in the presence of acidic buffer solution (pH 4). Production Pd(II)-CEFcomplex induced the absorption band which complementary overlap with the excitation spectra of CDs. Due to the competitive absorption, the excitation of CDs was significantly weakened, resulting in the quenching of CDs. The present IFE-based sensing strategy showed a good linear relationship from 0.2×10⁻⁶ M to 8 ×10⁻⁶ M (R2 = 0.994) and provided an exciting detection limit of 0.9×10⁻⁷ M (3δ/slope). The proposed method has been successfully applied for the determination of cefixime in pharmaceutical preparations and human urine samples.
Keywords: Carbon quantum dot; Cefixime; Fluorescence detection; Sensor; Inner filter effect
_____________________________________________________________________________
INTRODUCTION
Nowadays there are many pharmaceutical companies all over the world producing a variety of antibiotics. Although antibiotic use plays a beneficial role in the public health, but Studies have shown that long-term treatments with antibiotics increase the resistance of human pathogens to antibiotics [1]. Therefore monitoring antibiotics is important for obtaining optimum therapeutic concentration and also can help to clarify their direct or indirect impact on human health. Cefixime (CEF) is a semi synthetic and generally classified as a third-generation cephalosporin antibiotic. It is active against gram-positive and gram-negative bacterial infections and used in treating infections of urinary tract, upper respiratory tract, skin and middle ear[2].Common methods such as liquid chromatography-mass spectrometry [3], high performance liquid chromatography [4] and voltammetry5 have been used for the detection of CEF. These techniques are all effective, but none of them is ideal due to certain features such as being time consuming, expensive, lack of portability, and requiring delicate equipment. Thus, developing simple, selective and sensitive sensor for monitoring low levels of CEF is urgent and necessary.
93
analytical absorption signals into fluorescence signals [27-29]. In sensors based on the IFE, there is no need for establishing of any covalent linking between the receptor and a fluorophore but utilize the fluorophore and the receptor as such. Moreover, since the changes in the absorbance of the absorber translate into exponential changes in fluorescence of the fluorophore, an enhanced sensitivity and decreased detection limits for the analytical method is reasonable, comparing with the absorbance values alone [30]. In this study, we synthesized green CDs from pomegranate juice through simple hydrothermal method and testified their application as sensitive probes for the detection of CEF. The optical property and the morphology of the obtained CDs were characterized by UV–Vis absorption spectra, PL spectra, Fourier Transform-Infrared (FT-IR) spectroscopy and transmission electron microscopy (TEM), respectively. The proposed method is based on the complexation reaction between cefixime and palladium ion in the presence of acidic buffer solution (pH 4). The results showed that the absorption of Pd(II)-CEF complex overlapped with the excitation spectra of the synthesized CDs. Then, the fluorescence intensity of CDs was decreased in the presence of CEF and Pd(II) through the inner filter effects. This phenomenon was used for quantitative detection of CEF. The Sterne–Volmer plot showed a linear relationship (R2 = 0.998) between F0/F and the concentration of CEF over the ranges from 0.2×10
-6
M to 8 ×10⁻⁶ M (R2 = 0.987). The limit of detection (LOD) was estimated to be 0.5×10⁻⁷ M (3δ/slope).
EXPERIMENTAL SECTION
Materials and compounds
Pomegranates were bought from the local market. All chemicals used were of analytical grade or of the highest purity available. Hydrochloric acid (HCl) and sodium hydroxide (NaOH) were used to adjust the pH. All glassware was thoroughly cleaned with freshly prepared 3:1 HCl / HNO3 (aqua regia) and rinsed thoroughly
with deionized water prior to use. Double-distilled deionized water was used to prepare all the solutions in this study. A standard stock solution of CEF (100 μg mL-1) was prepared by dissolving 0.01 g of CEF standard in 20 mL of ethanol. The resultant solution was diluted to 100 mL with deionized water.
Instrument for characterization
UV–visible absorption spectra were recorded using a Biochrom Biowave II spectrophotometer. Fluorescence emission spectra were recorded by a FP-6500 Jasco fluorescence spectrophotometer. Microscopy images were obtained by high-resolution transmission electron microscopy (HRTEM, JEOL 2010F) at 200 KV. The Fourier transform infrared (FTIR) spectra of the CDs were recorded in the form of KBr pellets with a NEXUS 670 FTIR spectrometer.
Preparation of Fluorescent CDs
Carbon nanoparticles were synthesized from the hydrothermal of pomegranate juice. In a typical procedure, 20 mL pomegranate juice and was mixed with 5 mL deionized water. The resulting mixture was transferred into a Teflon-lined autoclave for hydrothermal treatment at 100 ºC for 5 h. For collecting highly fluorescent carbon dots, the resulting red solution was centrifuged at 10000 rpm for 25 min to separate large particles. The as-prepared CDs were freeze dried and then re-dispersed in ultrapure water at the concentration of 1mg mL-1 for further characterization and use.
Fluorescence assay ofCEF
In a typical run, 3 μL CDs dispersion solution was added into 1 mL phosphate-citrate buffer solution (25m M, pH 4.0). Then 50µL of freshly 10×10-4 M palladium chloride solution was added and diluted up to the 5 mL with deionized water. The final concentration of Pd (II) was about 10×10-6 M. Finally, an appropriate volume of CEF solution was added into above sample and after 5 minute the associated fluorescence quenching spectra were recorded at the room temperature. The fluorescence intensities were recorded in the range of 360 to 600 nm while the excitation wavelength was set at 350 nm. Fluorescence intensity was measured at 455 nm.
Analysis of actual samples
94
RESULTS AND DISCUSSION Synthesis and characterization of CDs
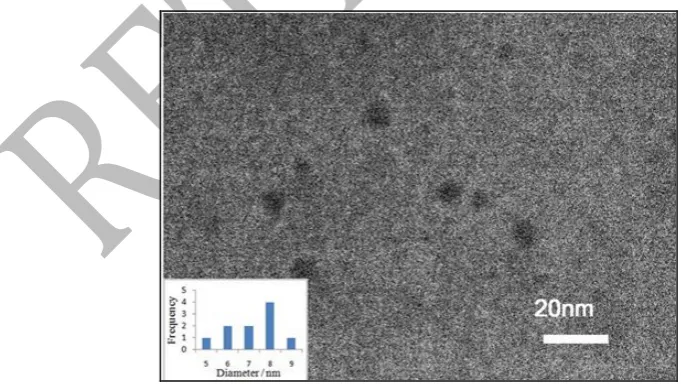
Water-soluble CDs were simply prepared by one-step hydrothermal treatment of pomegranate juice at 100 ºC. To explore the optical properties, the absorption and emission spectra of synthesized CDs were investigated. As can be seen in Figure 1, the UV−Vis spectrum showed a strong peak at 230 nm which is ascribed to the π- π* transition of aromatic C-C bonds, whereas a shoulder at 300 nm is attributed to the n- π* transition of C=O bond or other connected groups [31].Figure 1 also shows a strong PL emission peak at 455 nm when excited at 350 nm. Quantum yield of the as-obtained CDs was obtained to be about 3.8 % using quinine sulfate as the reference. Figure 2 shows the transmission electron microscopy (TEM) image of CDs, from which it can be seen that CDs were well separated from each other. The corresponding nanoparticle size distribution histogram indicates that their diameters were mainly distributed in the range of 5-9 nm. These CDs were very stable for several months without any precipitation or variation in the absorbance and emission peaks.
The structure and components of CDs were characterized by Fourier transformed infrared (FTIR) spectroscopy. The FT-IR spectrum (Figure 3) exhibited characteristic absorption band of OH stretching vibrations at 3405 cm
-1
[image:3.595.164.447.306.467.2]. The peaks at 2932 cm-1 and 1722 cm-1 were ascribed to the C-H and C=O stretching vibration, respectively. The peaks at 1664 cm-1and 1075 cm-1 also were attributed to the stretching vibrations of C=C and C–O or C-O-C, respectively [32-34]. Also as depicted in fig. 4a the XPS survey spectrum exhibited two peaks at 285 and 532.6 eV, which are attributed to C1s and O1s, respectively [35]. In detail, The C1s spectrum (Figure 4b) shows three peaks at 284.6, 286.3 and 287.9 eV which are attributed to C–C, C–O, and C=O, respectively [35].
Figure 1: UV−Vis spectrum of CEF, Pd, Pd(II)-CEF complex and CDs with normalized fluorescence spectrum of CDs
[image:3.595.88.429.493.686.2]95
Figure 3: The FT-IR spectrum of CDs
Figure 4: The XPS (a) and C1s (b) spectra of the as-obtained CDs
Optimizing of detection conditions
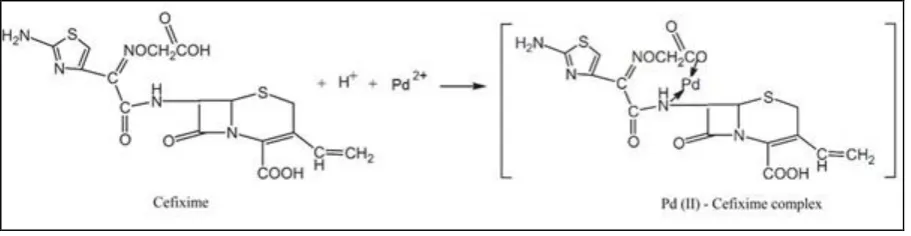
The fluorescence curves of CDs at different pH values suggested that there was an increase in fluorescence intensity by increasing the pH from 2 to 7. This variation of fluorescence was similar to CDs modified with carboxylic and hydroxyl groups [36,37]. Also as shown in figure 5, the fluorescence intensity decrease of CDs reached the maximum in the presence of CEF as well as pH 4.0. Then the pH of all samples was adjusted at pH 4.0 using phosphate–citric acid buffer. This is the result of formation Pd(II)-CEF complex in acidic pH [38]. A proposed mechanism for the complexation of Pd(II)-CEF complex is given in figure 6.
[image:4.595.107.433.578.744.2]The reaction time between CEF and CDs was also investigated and the results showed that the fluorescence intensity of CDs were quenched after the addition of CEF and were stable after 5 minute. This fast response could be used in promising applications in which require fast, stable and convenient sensing.
96
Figure 6: Proposed reaction for Pd(II)-Cefixime complex formation
Fluorescence detection of Cefixime
As shown in Fig. 1, it is obvious that the excitation spectrum of CDs was overlapped with the absorption spectrum of the Pd(II)-CEF(λ max=350). Interestingly, we found that in acidic pH, Pd(II)-CEF complex could quench the fluorescence of CDs, revealing the potential application of CDs as nanosensors for CEF detection. The observed decrease in fluorescence intensity of the CDs may also be attributed to the possibility that Pd(II) or CEF directly quenches the CDs fluorescence. To clarify this issue, the effect of Pd (II) and CEF on the fluorescence spectra of CDs were also studied separately. The fluorescence signal of CDs didn’t significantly change in the presence of CEF and Pd alone. This observation can be attributed to that Pd(II)-CEF complex can quench the fluorescence of CDs presumably via inner filter effect (IFE) [39].
For a sensitivity study, different concentration of CEF in the range of 0.1×10⁻⁶ - 10×10-6 M were investigated. Interestingly, the fluorescence intensity of CDs is sensitive to CEF in the presence of pd(II) and decreases with the increase of CEF amount (Figure 7).
Figure 7: (a) Fluorescence emission spectra of CDs in the presence of various concentrations of CEF. (b) The Fluorescence intensity ratio F/F0 of versus the concentration of CEF
The quenching efficiency is fitted to the Stern-Volmer equation, F0/F=1+Ksv[Q], where Ksv is the Stern-Volmer
quenching constant, [Q] is the concentration of analyte (CEF), and F0 and F are the fluorescence intensity at 455
nm in the absence and presence of CEF, respectively. As shown in Figure 7(b), there is a good linear dynamic range from 0.2×10⁻⁶ M to 8 ×10⁻⁶ M (R2 = 0.994) and detection limit of 0.9×10⁻⁷ M was obtained based on a 3δ/slope.
Specificity of the Sensing System
To investigate whether our system is specific for CEF, we measured the fluorescence response of this sensing system with most of the common ions such as Na+, Ca2+, et al., and small molecules like glucose and L-cysteine under similar conditions. The results, as shown in table 1, indicated that there was no obvious fluorescence change in the presence of the listed ions and biomolecules.
Applications for actual samples
[image:5.595.73.526.346.513.2]97
As listed in table 3, the results of analyzing the pharmaceutical samples with the current method were satisfactory all with average CEF recoveries between 93% and 107%. In addition, including the sample pretreatment procedure, the whole experiment process could be completed within 30 minute, demonstrating that this method can meet the needs of rapid detection for CEF in real samples.
Table 1: Effect of coexisting foreign species (concentration of CEF is 6µM)
Species added (5×10⁻⁶ M) Change in fluorescence intensity to Cefixime %
Na+ 2
Ca2+ -2
Mg2+ -3
Glucose 2.3
L-Cysteine -3.1
L-Tryptophan -2.1
Glutathione -3.1
Urea -3
Meroxan 1
Erythromycin -4
Cefazolin 3.6
[image:6.595.148.482.141.485.2]Cetirizine -2.8
Table 2: Recoveries of CEF in supplemented human urine detected by current method (n=3)
Number Spiked(µM) Found(µM) Recovery (%) RSD
1 2 2.1 105 3.6
2 4 4.3 107.5 3.8
3 6 5.8 96.6 3.2
4 8 7.9 98.7 2.8
Table 3 Recoveries of CEF in pharmaceutical preparation detected by current method (n=3)
Sample Amount Spiked(µM) Found Recovery(%) RSD
1 3 2 5.1 103.3 3.8
2 3 3 6.2 106.6 4.2
3 3 4 6.8 93.3 3.7
CONCLUSIONS
In summary, carbon dots were synthesized via one-step hydrothermal treatment of pomegranate juice at 100 ºC. Carbon dots served as an effective fluorescent sensing probe for sensitive and selective detection of CEF with a detection limit as low as 0.9×10⁻⁷ M. The developed probe had remarkable advantages such as high selectivity, high speed and wide response range. Also, the results obtained from real sample analysis proved the promising potential application of these green probes in physiological conditions. We believe that the green production of fluorescent carbon dots has bright prospects in biological detection.
ACKNOWLEDGEMENTS
We would like to express our gratitude to the Iranian Nanotechnology Initiative council for the financial support of this research. We also wish to thank Mr. Mehrdad Akhgari (operator of analytical instruments) from Urmia University for his cooperation and useful advices.
REFERENCES
[1] NV Beloglazova; SA Eremin. Anal. Bioanal. Chem, 2015, 407(28), 8525-8532. [2] J Shah; MR Jan. S Shah; Inayatullah. J. Fluoresc., 2011, 21(2), 579-585. [3] F Meng; X Chen; Y Zeng; D Zhong. J. Chromatogr. B, 2005, 819(2), 277-282.
[4] KS Khandagle; SV Gandhi; PB Deshpande; NV Gaikwad. Int J Pharm Pharm Sci, 2011, 3(1), 46-48. [5] R Jain; VK Gupta; N Jadon; K Radhapyari. Anal. Biochem., 2010, 407(1), 79-88.
[6] W Bai; H Zheng; Y Long; X Mao; M Gao; L Zhang. Anal. Sci., 2011, 27(3), 243-243. [7] Y Yang; Y Liu; L Yang; J Liu; K Li; S Luo. J. Chem. Sci., 2015, 127(3), 359-363.
[8] M Tayebi; M Tavakkoli Yaraki; A Mogharei; M Ahmadieh; M Tahriri; D Vashaee; L Tayebi. J. Fluoresc., 2016, 26(5), 1787-1794.
[9] F Akhgari; H Fattahi; YM Oskoei. Sens. Actuators B Chem., 2015, 221, 867-878.
98
[11] SY Lim; WShen; Z Gao. Chem. Soc. Rev., 2015, 44(1), 362-381.
[12] P Roy; PC Chen; AP Periasamy; YN Chen; HT Chang. Mater. Today, 2015, 18(8), 447-458. [13] H Gonçalves; JCG Esteves da Silva. J. Fluoresc, 2010, 20(5), 1023-1028.
[14] C Zhu; J Zhai; S Dong. Chem. Commun., 2012, 48(75), 9367-9369. [15] M Sheng; Y Gao; J Sun; F Gao. Biosens. Bioelectron., 2014, 58, 351-358.
[16] X Wang; L Cao; ST Yang; F Lu; MJ Meziani; L Tian; KW Sun; MA Bloodgood; YP Sun. Angew. Chem. Int. Ed., 2010, 49(31), 5310-5314.
[17] L Cao; X Wang; MJ Meziani; F Lu; H Wang; PG Luo; Y Lin; BA Harruff; LM Veca; D Murray; SY Xie; YP Sun. J. Am. Chem. Soc., 2007, 129(37), 11318-11319.
[18] Y Liu; M Liao; X He; X Liu; X Kou; D Xiao. Anal. Sci., 2015, 31(10), 971-977.
[19] NC Gong; YL Li; X Jiang; XF Zheng; YY Wang; SY Huan. Anal. Sci., 2016, 32(9), 951-956. [20] Q Yue; Y Hou; S Yue; K Du; T Shen; L Wang; S Xu; H Li; J Liu. J. Fluoresc, 2015, 25(3), 585-594. [21] Y Mosaei Oskoei; H Fattahi; J Hassanzadeh; A Mousavi Azar. Anal. Sci., 2016, 32(2), 193-199. [22] H Zhu; X Wang; Y Li; Z Wang; F Yang; X Yang. Chem. Commun., 2009, 34, 5118.
[23] Y Dong; N Zhou; X Lin; J Lin; Y Chi; G Chen. Chem. Mater., 2010, 22, 5895.
[24] C Liu; P Zhang; X Zhai; F Tian; W Li; J Yang; Y Liu; H Wang; W Wang; W Liu. Biomaterials, 2012, 33, 3604.
[25] Y Li; Y Hu; Y Zhao; G Shi; L Deng; Y Hou; L Qu. Adv. Mater., 2011, 23, 776.
[26] L Cao; S Sahu; P Anilkumar; CE Bunker; J Xu; KAS Fernando; P Wang; EA Guliants; KN Tackett; Y P Sun. J. Am. Chem. Soc., 2011, 133, 4754.
[27] P Yuan; DR Walt. Anal. Chem., 1987, 59(19), 2391-2394..
[28] X Yang; K Wang; C Guo. Anal. Chim. Acta, 2000, 407(1–2), 45-52. [29] XF Yang; P Liu; L Wang; M Zhao. J. Fluoresc, 2008, 18(2), 453-459. [30] L Shang; C Qin; L Jin; L Wang; S Dong. Analyst, 2009, 134(7), 1477-1482.
[31] H Li; X He; Y Liu; H Huang; S Lian; ST Lee; Z Kang. Carbon, 2011, 49(2), 605-609. [32] D Sun; R Ban; PH Zhang; GH Wu; JR Zhang; JJ Zhu. Carbon, 2013, 64, 424-434. [33] H Ding; JS Wei; HM Xiong. Nanoscale, 2014, 6(22), 13817-13823.
[34] Y Dong; H Pang; HB Yang; C Guo; J Shao; Y Chi; CM Li; T Yu. Angew. Chem. Int. Ed., 2013, 52(30), 7800-7804.
[35] M Xu; G He; Z Li; F He; F Gao; Y Su; L Zhang; Z Yang; Y Zhang. Nanoscale, 2014, 6(17), 10307-10315.
[36] H Liu; T Ye; C Mao. Angew. Chem. Int. Ed., 2007, 46(34), 6473-6475.
[37] QL. Zhao; ZL Zhang; BH Huang; J Peng; M Zhang; DW Pang. Chem. Commun., 2008, 41, 5116-5118. [38] SNH Azmi; B Iqbal; NSH Al-Humaimi; IRS Al-Salmani; NAS Al-Ghafri; N Rahman. J. Pharm.
Analysis, 2013, 3(4), 248-256.