Number 6112
Konkoly Observatory Budapest
22 July 2014
HU ISSN 0374 – 0676
SEVEN NEW PERIOD-CHANGE ECLIPSING BINARY STARS
NELSON, ROBERT H.1,2
11393 Garvin Street, Prince George, BC, Canada, V2M 3Z1
2Guest User, Canadian Astronomy Data Centre, which is operated by the Dominion Astrophysical
Observa-tory for the National Research Council of Canada’s Herzberg Institute of Astrophysics email: [email protected]
In the course of surveying eclipse timing difference (or O−C) plots for a series of papers
on period change (Nelson et al. 2014a,b,c), several overcontact systems came to light— not previously noted in the literature—which showed strong evidence of period change. The eclipse timing (ET) data were well modelled by quadratic functions. However, the time interval over which the quadratic relation was evident was short, typically around a decade. Because subsequent data can often prove a relationship wrong, these systems were not included in the main group of 60 to be discussed in detail. Rather, they were simply added as notes at the end of Paper 3. Therefore it was deemed useful to describe the relationships more fully here.
EG CVn
The variability of EG CVn (GSC 3026-1046, ROTSE1 J133726.05+373458.4) was discov-ered as part of the Robotic Optical Transient Search Experiment I (ROTSE-1, Akerlof et al. 2000). It was identified as EW-type with a period of 0.34927(2) days. Bl¨attler & Diethelm (2002) presented new eclipse timings and an unfiltered CCD light curve. Since then, there have been a number of eclipse timings reported, but no period analysis. As far as is known, there has been no light curve analysis for this system.
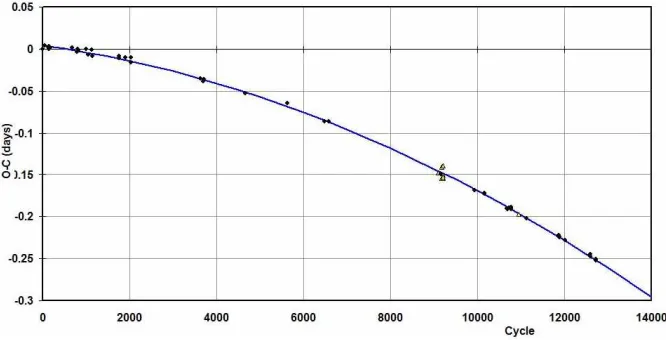
In Figure 1, the ET differences from the 32 eclipse timings from 1999 to 2012 are plot-ted. (The abscissa is the cycle number; the ordinate is the eclipse timing difference (O−C
value) in days. Legend: squares—photographic; triangles—visual; open (red) circles— photoelectric; solid circles—CCD timings). The least squares best-fit quadratic curve is shown; its parameters yield the rate of period change as dP/dt= 5.9(4)·10−
7
Figure 1. EG CVn: Eclipse timing differences (O−C) using Min I (hel) = 2451246.7820 + 0.349271 E.
V2240 Cyg
The variability of V2240 Cyg (GSC 2684-1255) was discovered by Saf´ar (1999) who pre-sented elements (epoch, period of 0.404194(68) days), six CCD eclipse timings, and an unfiltered light curve. From the shape of the light curve, he identified it as a W UMa variable. Since then, there have been numerous eclipse timings reported in the literature, but no period analysis. As far as is known, there has been no light curve analysis for this system.
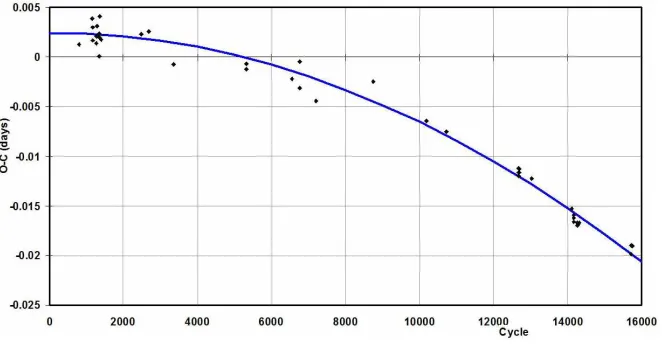
Figure 2. V2240 Cyg: Eclipse timing differences (O−C) using Min I (hel) = 2451375.4523 +
0.404194 E.
In Figure 2, the ET differences from the 63 eclipse timings from 1999 to 2013 are plotted (for the legend, see Section 1). The least squares best-fit quadratic curve is shown; its parameters yield the rate of period change as dP/dt = −1.84(4)·10−
6
[image:2.595.132.465.449.619.2]MS Her
[image:3.595.136.463.222.563.2]The variability of MS Her (GSC 2101-0313, ROTSE1 J181653.46+273945.4) was dis-covered by Hoffmeister (1949). The reference is from the CGVS4, but the work is not available. The next reference is the ROTSE-I paper, Akerlof et al. (2000) which lists co-ordinates and a period of 0.86793(28) days. Since then, there have been numerous eclipse timings reported, but no period analysis. Strangely, the GCVS4 lists the period of this system incorrectly as 0.6052626 days. As far as is known, there has been no light curve analysis for this system.
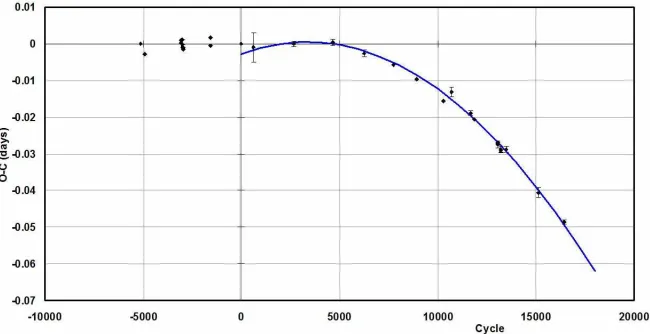
Figure 3. Top: MS Her: eclipse timing differences (O−C) using Min I (hel) = 2449534.4903 +
0.8680423 E. Bottom: eclipse timing differences (O−C) using Min I (hel) = 49534.4903 + 0.8680423 E.
In Figure 3a, the ET differences from the 33 photographic, visual, photoelectric and CCD timings from 1931 to 2012 are plotted. In Figure 3b, the same data and fit are plotted, but for the restricted range cycle 0 (1994) to cycle 7463 (2012). The fact that the quadratic fit—which uses parameters optimized for all the data—fits the restricted range well gives one confidence that the cycle reassignments necessary for Figure 3a are correct.
Weighted least squares fitting for all the data yields a value of dP/dt= 1.74(2)·10−
6
days/year with a cc of 0.999. Using only the data from cycle 0 or later yields a value of dP/dt= 1.77(7)·10−
6
V400 Lyr
[image:4.595.135.466.246.418.2]This variability of V400 Lyr (GSC 3121-1799, VV 223) was discovered by Miller (1969) who classified it as RRab and supplied a period of 0.3201645 days. Bl¨attler & Diethelm (2000b) presented unfiltered CCD light curves showing the system to be of type EW. They also supplied an updated pair of elements (epoch, period); the latter being 0.2534306(8) days. Marino (2011) obtained CCD light curves and—using PHOEBE software (Prsa & Zwitter 2005)—obtained a Wilson-Devinney fit for BVRI pass bands (Wilson & Devinney 1971). Marino (2011) also displayed an ET difference plot which showed a secular period decrease but did not determine a quadratic fit.
Figure 4. V400 Lyr: Eclipse timing differences (O−C) using Min I (hel) = 2451801.3651 +
0.2534274 E.
In Figure 4, the (all CCD) ET differences from the 43 eclipse timings from 2001 to 2011 are plotted, yielding a value dP/dt = −2.61(23)·10−
7
days/year with a coefficient of correlation (cc) of 0.992.
V406 Lyr
The variability of V406 Lyr was discovered by Parenago (1946). Meinunger (1970) ob-tained the first period, 1.51130 days and published a photographic light curve. Agerer et al. (1994) presented new photographic and CCD eclipse timings, and determined that the above period was an alias of the true one, P = 0.86078384(9) days. They also obtained a new light curve with two distinctly unequal minima. Since then, there have been many eclipse timings published but no period analysis.
In Figure 5, the (all CCD) ET differences are plotted for the time interval 1993-2013; the earlier photographic and visual timings are not plotted because the gaps impose an uncertainty as to the correct cycle count. Plotted are 29 points yielding a value dP/dt= 8.35(29)·10−
7
Figure 5. V406 Lyr: Eclipse timing differences (O−C) using Min I (hel) = 2449250.4582 +
0.8607838 E.
V579 Lyr
The variability of V579 Lyr (GSC 3131-0476) was discovered by Akerlof et al. (2000) in the ROTSE-1 all-sky survey for variable stars. Bl¨attler & Diethelm (2000a) presented unfiltered CCD light curves showing the system to be of type EW. They also supplied an updated pair of elements (epoch, period); the latter being 0.2429100(25) days. Since then, there have been many eclipse timings published but no period analysis.
Figure 6. V579 Lyr: Eclipse timing differences (O−C) using Min I (hel) = 2452500.0623 +
0.2429093 E.
In Figure 6, the (all photometric-CCD) ET differences are plotted for the time interval 1999-2013, but only the eclipse timings since cycle 0 (2002) were used to compute the period change, dP/dt=−8.78(48)·10−
7
[image:5.595.137.462.448.615.2]any case, future eclipse timings over several decades are required to establish the true relationship. As far as is known, there has been no light curve analysis for this system.
KN Vul
[image:6.595.136.464.231.402.2]The variability of KN Vul (GSC 2148-3403) was discovered by Wachmann (1966) in a survey of the southern stars in Cygnus. Kreiner (2004) provided a set of elements (epoch, period). Since then, there have been a number of eclipse timings published, but no period analysis.
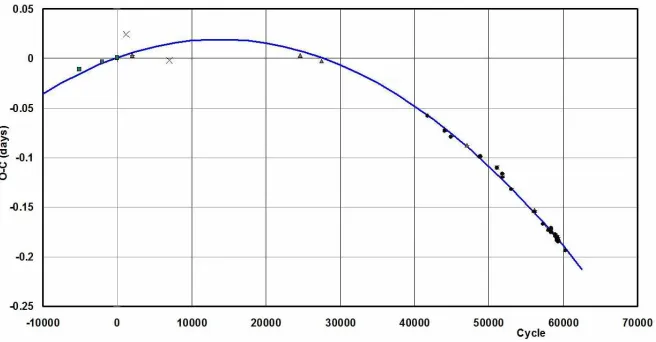
Figure 7. KN Vul: Eclipse timing differences (O−C) using Min I (hel) = 2434634.2821 + 0.3573325 E.
In Figure 7, the ET differences from the 85 eclipse timings from 1948 to 2012 are plotted. The rate of period change is dP/dt = 2.00(2)·10−
7
days/year with a cc of 0.999. As far as is known, there has been no light curve analysis for this system.
Acknowledgements: This research has made use of the SIMBAD database, oper-ated at CDS, Strasbourg, France. Also useful were the Lichtenknecker—Database of the BAV (http://www.bav-astro.de/LkDB/index.php?lang=en) and the O−C Gateway
(http://var.astro.cz/ocgate/).
References:
Agerer, F., Kleikamp, W. & Moschner, W., 1994,IBVS No. 4132 Akerlof, C., et al., 2000,AJ, 119, 1901
Bl¨attler, E. & Diethelm, R., 2000a, IBVS, No. 4982 Bl¨attler, E. & Diethelm, R., 2000b, IBVS, No. 4995 Bl¨attler, E. & Diethelm, R., 2002,IBVS, No. 5269
GCVS4, General Catalogue of Variable Stars, http://www.sai.msu.su/gcvs/ Hoffmeister, C., 1949, Ver¨off. Sternw. Sonneberg, 1, N3
Kreiner, J. M., 2004, AcA, 54, 207 Marino, G., 2011, IBVS, No. 6002
Miller, W. J., 1969,Ricerche Astronomiche,7, 459
Nelson, R. H., Terrell, D. & Milone, E.F., 2014a, New Astr. Rev., 59, 1 (Paper 1) Nelson, R. H., Terrell, D. & Milone, E.F., 2014b,New Astr. Rev., (Paper 2), submitted Nelson, R. H., Terrell, D. & Milone, E.F., 2014c,New Astr. Rev., (Paper 3), in preparation Parenago, P., 1946, Perem. Zvezdy,6, 25
Prsa, A. & Zwitter, T., 2005, ApJ, 628, 426 Saf´ar, J., 1999, IBVS, No. 4818