N A N O E X P R E S S
Synthesis of Starch-Stabilized Ag Nanoparticles and Hg
2+Recognition in Aqueous Media
Yingju FanÆ Zhen LiuÆ Le WangÆ Jinhua Zhan
Received: 29 March 2009 / Accepted: 1 July 2009 / Published online: 15 July 2009
Óto the authors 2009
Abstract The starch-stabilized Ag nanoparticles were successfully synthesized via a reduction approach and characterized with SPR UV/Vis spectroscopy, TEM, and HRTEM. By utilizing the redox reaction between Ag nanoparticles and Hg2?, and the resulted decrease in UV/ Vis signal, we develop a colorimetric method for detection of Hg2? ion. A linear relationship stands between the absorbance intensity of the Ag nanoparticles and the con-centration of Hg2? ion over the range from 10 ppb to 1 ppm at the absorption of 390 nm. The detection limit for Hg2?ions in homogeneous aqueous solutions is estimated to be*5 ppb. This system shows excellent selectivity for Hg2? over other metal ions including Na?, K?, Ba2?, Mg2?, Ca2?, Fe3?, and Cd2?. The results shown herein have potential implications in the development of new colorimetric sensors for easy and selective detection and monitoring of mercuric ions in aqueous solutions.
Keywords Nanoparticles RecognitionMercury ion SilverColorimetric
Introduction
Noble metal nanostructures have drawn great interests because of their unique properties. One of them is large optical field enhancements resulting in strong scattering and absorption of light [1]. Remarkable progresses have been made in diverse research fields such as optical spec-troscopy, cell imaging, quantum information processing, nanophotonics, and building blocks for nanoscale devices and chemical sensors [2–4]. The interesting optical attri-butes of metal nanoparticles, as reflected in their bright intense colors, are due to their localized surface-plasmon resonance (LSPR) [5,6]. So each metal nanoparticle can be considered an optical probe equivalent to up to a million dye molecules. As a result, nanoparticles at nanomolar concentration can clearly be observed by naked eyes, allowing sensitive detection with minimal consumption of materials. Unlike dyes, metal nanoparticles are photostable and do not undergo photobleaching, allowing the nano-particles to be utilized as ideal color reporting groups for colorimetric sensor design [7].
Among heavy metals, mercury is one of the most commonly encountered toxic pollutants in the environment as a result of natural processes and emissions from coal-burning power plants and gold mining [8]. In aqueous solution, bacteria can transform water-soluble mercuric ion (Hg2?) into methylmercury, which subsequently bioaccu-mulates through the food chain [9]. Methylmercury is known to cause health problems such as sensory, motor, and neurological damage. It is particularly dangerous for children, because it can cause developmental delays [10]. Although the traditional instrumental techniques, such as absorption spectroscopy, cold vapor atomic fluorescence spectrometry, and gas chromatography, give the direct and quantitative detection of Hg2?concentration [11,12], it is
Electronic supplementary material The online version of this article (doi:10.1007/s11671-009-9387-6) contains supplementary material, which is available to authorized users.
Y. FanZ. LiuL. WangJ. Zhan (&) School of Chemistry and Chemical Engineering,
Shandong University, 250100 Jinan, People’s Republic of China e-mail: [email protected]
Y. Fan
School of Chemistry and Chemical Engineering,
highly desirable to develop facile and quick methods for measuring the level of this detrimental metallic ion in the environment with high sensitivity and selectivity. To date, several methods providing the immediate optical feedback for the detection of Hg2?based upon fluorophores [13–23], chromophores [21], polymer [22], and noble metal-based probes [23–25] have been developed to avoid complicated instrumentation or sample preparation. Hg2? ion, with a closed-shelld10configuration, has no optical spectroscopic signature. Among the approaches proposed thus far, its optical detection generally relied on the complexation of Hg2? ion to ligands. Various small-molecules chro-mophores, biomolecules, chemically modified nanoparticles must carefully be designed and selected [13–28], or showed cross-sensitivity toward other metal ions [29]. In this communication, we present a method with colorimetric quantitative recognition of Hg2?with excellent selectivity and sensitivity (5 ppb) based on an erosion reaction of starch-stabilized Ag nanoparticles in aqueous media. The easy synthesis and high stability of the starch-stabilized Ag nanoparticle allow the method to be very simple and easy to implement.
Experimental Section
Chemicals
All chemicals were of analytical grade and were used as received without further purification. Silver nitrate (AgNO3), sodium borohydride (NaBH4), and soluble starch
(linear structure (C6H10O5)n) for synthesis of silver nano-particles were supplied by Beijing Chemical Reagent Company and used as received. Chloroauric acid (HAuCl4)
was purchased from Sigma–Aldrich. Hg(NO3)2 standard
solution was from Chinese National Standard Chemical Center. All the other solutions were freshly made for all the experimental procedures in this work. Ultrapure water was used, and all glassware were cleaned with aqua regia and thoroughly rinsed with ultrapure water prior to use. Synthesis of Silver Nanoparticles
Aqueous starch dispersion containing Ag?ions is prepared by adding 3 mL of a 0.1 M solution of AgNO3 to about
200 mL of 0.20% w aqueous solution of soluble starch, followed by stirring to ensure that the mixture was homogeneous. Next, 6 mL of freshly prepared 0.1 M NaBH4 was added all at once with vigorous stirring. A
color change occurred almost immediately. The solution was allowed to stir for an additional 30 min at room tem-perature, the as-prepared Ag nanoparticles formed and used without purification.
Characterization
The X-ray powder diffraction (XRD) patterns were col-lected on a Bruker D8 advance X-ray diffractometer equipped with graphite monochromatized Cu Ka radia-tion (k=1.5418A˚ ). High-resolution transmission electron microscopy (HRTEM) images were recorded by a JEOL 2100 transmission electron microscope equipped with an energy-dispersive X-ray spectrometer (EDS). The changes in the UV–vis absorption spectra were monitored at room temperature using a double-beam UV–vis spectrophotom-eter, Shimadzu UV-240 (Japan) with 1 cm quartz cell. In each measurement, 3 mL reaction solution was used.
General Procedure for Detection of Metal Ions
Many tests were carried out to optimize the sensing condi-tions such as addition time and concentration. In a typical procedure, three steps were involved. First, 1 mL freshly prepared Ag nanoparticles were diluted with deionized water to obtain a 1.5910-4M solution. Second, different amounts of Hg2? or other metal ions were separately injected into series cuvettes containing the silver nanopar-ticles followed by vigorous stirring. It was found that all the sensing systems were very stable and no precipitates or flocs were observed. Third, 3 mL reaction solution was sepa-rately taken out from the cuvette and injected into a standard 1 cm quartz cell for the measurement of UV–vis spectrum.
Results and Discussion
Characterizations of the Ag Nanoparticles and Sensing Detection of Hg2?
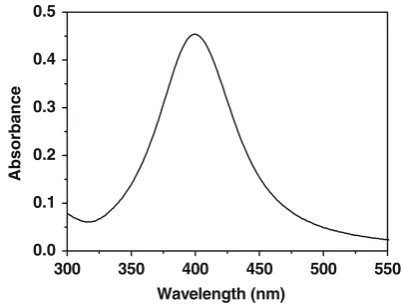
The silver nanoparticles were obtained through a reduction reaction of silver nitrate with NaBH4 in the presence of
reaction can occur between zero-valent silver and Hg2?, for the Standard Electrode Potential of Ag?/Ag is 0.80 V and Hg2?/Hg is 0.85 V [32]. The sensitivity of silver nanoparticles toward Hg2?was hence identified by UV–vis absorption spectra in this work. The sensing begins by adding an aliquot of an aqueous solution of Hg2? at a designated concentration to a solution of the Ag nanopar-ticles at room temperature. Various concentrations of Hg2? from one stock solution were tested. As indicated in Fig.2a, the absorbance peak of the Ag nanoparticles could be depressed with the increased concentration of Hg2?ion. A linear relationship (y=1.41–5.75910-4x, R2=
0.9984), as suggested by Fig.2b stands between the absorbance intensity of the Ag nanoparticles and concen-tration of Hg2?ion over the range from 10 ppb to 1 ppm at the absorption of 390 nm. The limit of quantification, at a signal to noise ratio of 3, was down to 5 ppb. Lee et al. [23] reported a colorimetric method to detect Hg2?using DNA– Au NPs in aqueous media whose limit of quantification was 20 ppb. The detection limit for Hg2?ions using col-orimetric sensors based on the ruthenium complexes was estimated to be 20 ppb [21].
Figure2a also demonstrated that the increased concen-tration of Hg2? ion may cause a slight blue shift of the
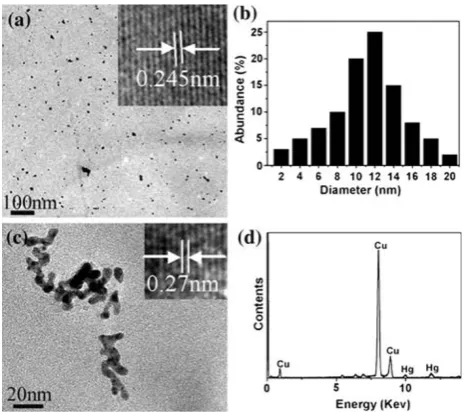
surface-plasmon absorption band. It has been reported that mercury ions could radiolytically be reduced in an aqueous silver sol to form a mercury layer around silver particles, accompanied by a moderate broadening and blue shift of the plasmon absorption band [33]. In our experiments, Hg2? ions reacted with silver nanoparticles to form metallic mercury. The freshly generated mercury atoms could strongly be bonded on the silver surface to form a solid amalgam-like structure, which could be accounted for the slight blue shift of the surface-plasmon absorption band of silver nanoparticles. Detailed structural and chemical analyses for the products of the reaction between Hg2?ions and Ag nanoparticles were further carried out with trans-mission electron microscopy (TEM), high-resolution TEM (HRTEM), and energy-dispersive EDS. Figure3a, b, the typical TEM images of the as-prepared Ag nanoparticles and its corresponding size distribution, display that its core diameter is *10–15 nm. A clearly resolved interplanar fringe of 0.245 nm was observed in the HRTEM image displayed in the inset of Fig.3a corresponding to the d spacing of the (111) crystal plane of fcc silver (JCPDS card no. 04-0783). Figure3c, a TEM image of the product after the reaction between the Ag nanoparticles and Hg2?, showed its aggregated nature. The HRTEM image, displays in the inset of Fig.3c, shows a discerned lattice spacing of 0.27 nm. It corresponds to the d spacing of the (110) crystal plane of body-centered tetragonal Hg [34]. EDS spectrum of this product, depicted in Fig.3d, further suggests that the final product is composed of metallic mercury.
In our experiments, the nanoparticle size is much smaller than the wavelength of the incident field. The particles are subjected to an almost uniform field. A model consisting of a sphere of radius R in a suspending medium is shown in the supporting information (SI-2) [35–38]. According to the Lambert–Beer’s law, the intensity of absorption can be given by
A¼Kbc¼rabsNAbc¼
24p2R3e1
ie2
k ðe1rþ2e2Þ2þe21i
h iNAbc ð1Þ
300 350 400 450 500 550
0.0 0.1 0.2 0.3 0.4 0.5 Absorbance Wavelength (nm)
Fig. 1 The surface-plasmon absorbance spectrum of starch-stabilized Ag nanoparticles
300 350 400 450 500 550
0.0 0.3 0.6 0.9 1.2 1.5 10 100 200 300 400 500 600 700 800 900 1000 [Hg2+]/ppb
Absorbance
Wavelength (nm)
(a)
0 200 400 600 800 1000 0.8 0.9 1.0 1.1 1.2 1.3 1.4 1.5 Absorbance
Hg2+ concentration ( ppb)
(b)
[image:3.595.68.270.58.210.2] [image:3.595.182.544.517.715.2]wheree1and e2are, respectively, the dielectric functions
for the sphere and embedding regions, k is the incident field wavelength,adenotes the nanoparticle polarizability,
NA is the Avogadro number, b denotes the length of the
optical path, and c is the concentration of the Ag nano-particles. A linear relationship between the absorption intensity and the concentration of Ag nanoparticles could be observed from the Eq.1, which supports the quantita-tive detection of Hg2?based on an erosion reaction of Ag nanoparticles.
Selective Detection of Hg2?
It was also of interest to determine the selectivity of this system for Hg2?. This has been evaluated through testing the response of the assay to various environmentally rele-vant metal ions including Hg2?, Na?, K?, Ba2?, Mg2?, Ca2?, Fe3?, and Cd2? (Fig.4a) at a concentration of 10-4M. Only the Hg2?sample shows a significant fading relative to that of the blank, whereas all others remain exhibiting light yellow color without any eye-perceptible change. The absorption spectra of silver colloid before and after the addition of Na?, K?, Ba2?, Mg2?, Ca2?, and Fe3? were almost unaffected (Fig.4c). The addition of Cd2? resulted in a tiny red-shift of the absorption band. This effect could be interpreted in terms of the donation of electron density from the silver particles to the adsorbed Cd2?[39]. The colorimetric response of Ag NPs to alkali,
alkaline earth metal ions, Fe3?, Cd2?, and its selectivity for Hg2?is illustrated in Fig.4b. AuCl4-is more
electropos-itive than Hg2?, it could make the Ag colloid turn purple owing to the formation of Au particles (Fig. 5). However, this selectivity could directly be visualized with the naked eyes. The possible interference of the mixing cations was also investigated. The fading response of the Ag nanopar-ticles to Hg2?ion was unaffected in a background of ions mixture (see supporting information SI-3).
Fig. 3 Typical TEM and HRTEM images (depicted in theinset) of
a Ag nanoparticles, b the size distribution of Ag nanoparticles,
cproduct of the reaction between the Ag nanoparticles and Hg2?,
[image:4.595.54.291.57.263.2]d EDS spectrum of the product of the reaction between the Ag nanoparticles and Hg2?
[image:4.595.309.541.59.472.2]Conclusions
In conclusion, the starch-stabilized Ag nanoparticles were obtained via a reduction approach. Hg2?ions in aqueous media were recognized by these nanoparticles via a col-orimetric method with very high selectivity and sensitivity. This approach relies on the simple redox reaction between Ag nanoparticles and Hg2?ion solution. The concentration of Hg2?can be determined by the change of the intensity of the silver absorbance peak at room temperature. Influ-ence of various metal ions has also been investigated. Most of molecular chromophores for Hg2?have to be evaluated in organic media or organic–aqueous mixtures owing to their low water solubility. The facile synthesis, high sta-bility, and high water solubility of the starch-stabilized Ag nanoparticle probes allow a reliable assay performed in aqueous environments.
Acknowledgments Helpful discussion with Prof. Yitai Qian and Financial supports from National Natural Science Found of China (NSFC 20501014), Program for New Century Excellent Talents in University (NCET-06-0586), Key Project of Chinese Ministry of Education (No. 109098) and National Basic Research Program of China (973 Program 2005CB623601, 2007CB936602) are gratefully acknowledged.
References
1. M.A. El-Sayed, Acc. Chem. Res.34, 257 (2001). doi:10.1021/ ar960016n
2. E. Ozbay, Science311, 189 (2006). doi:10.1126/science.1114849
3. J. Lee, P. Hernandez, J. Lee, A.O. Govorov, N.A. Kotov, Nat. Mater.6, 291 (2007). doi:10.1038/nmat1869
4. J.M. Slocik, F. Tam, N.J. Halas, R.R. Naik, Nano Lett.7, 1054 (2007). doi:10.1021/nl070267x
5. P.K. Jain, K.S. Lee, I.H. El-Sayed, M.A. El-Sayed, J. Phys. Chem. B110, 7238 (2006). doi:10.1021/jp057170o
6. S. Link, M.A. El-Sayed, Annu. Rev. Phys. Chem.54, 331 (2003). doi:10.1146/annurev.physchem.54.011002.103759
7. C. SO¨ nnichsen, B.M. Reinhard, J. Liphardt, A.P. Alivisatos, Nat. Biotechnol.23, 741 (2005). doi:10.1038/nbt1100
8. O. Malm, Environ. Res.77, 73 (1998). doi:10.1006/enrs.1998. 3828
9. H.H. Harris, I. Pickering, G.N. George, Science 301, 1203 (2003). doi:10.1126/science.1085941
10. P. Grandjean, P. Weihe, R.F. White, F. Debes, Environ. Res.77, 165 (1998). doi:10.1006/enrs.1997.3804
11. S. Yoon, A.E. Albers, A.P. Wong, C.J. Chang, J. Am. Chem. Soc.
127, 16030 (2005). doi:10.1021/ja0557987
12. J. Wang, B. Liu, Chem. Commun., 4759 (2008). doi:10.1039/ b806885b
13. X.J. Zhu, S.T. Fu, W.K. Wong, J.P. Guo, W.Y. Wong, Angew. Chem. Int. Ed.45, 3150 (2006). doi:10.1002/anie.200600248
14. J.V. Ros-Lis, M.D. Marcos, R.M. Ma´nˇez, K. Rurack, J. Soto, Angew. Chem. Int. Ed. 44, 4405 (2005). doi:10.1002/anie. 200500583
15. Y.K. Yang, K.J. Yook, J. Tae, J. Am. Chem. Soc.127, 16760 (2005). doi:10.1021/ja054855t
16. J.V. Ros-Lis, M.D. Marcos, R. Martinez-Manez, K. Rurack, J. Soto, Angew. Chem. 117, 4479 (2005). doi:10.1002/ange.2005 00583
17. X.J. Zhu, S.T. Fu, W.-K. Wong, J.P. Guo, W.Y. Wong, Angew. Chem.118, 3222 (2006). doi:10.1002/ange.200600248
18. X. Guo, X. Qian, L. Jia, J. Am. Chem. Soc.126, 2272 (2004). doi:
10.1021/ja037604y
19. A. Caballero, R. Martinez, V. Lloveras, I. Ratera, J. Vidal-Gan-cedo, K. Wurst, A. Tarraga, P. Molina, J. Veciana, J. Am. Chem. Soc.127, 15666 (2005). doi:10.1021/ja0545766
20. S. Yoon, E.W. Miller, Q. He, P.H. Do, C.J. Chang, Angew. Chem. Int. Ed.46, 6658 (2007). doi:10.1002/anie.200701785
21. E. Coronado, J.R. Galan-Mascaros, C. Marti-Gastaldo, E. Pal-omares, J.R. Durrant, R. Vilar, M. Gratzel, M.K. Nazeeruddin, J. Am. Chem. Soc. 127, 12351 (2005). doi:10.1021/ja0517724
22. Y. Zhao, Z. Zhong, J. Am. Chem. Soc. 128, 9988 (2006). doi:
10.1021/ja062001i
23. J.S. Lee, M.S. Han, C.A. Mirkin, Angew. Chem. Int. Ed.46, 4093 (2007). doi:10.1002/anie.200700269
24. G.K. Darbha, A.K. Singh, U.S. Rai, E. Yu, H. Yu, P.C. Ray, J. Am. Chem. Soc.130, 8038 (2008). doi:10.1021/ja801412b
25. D. Li, A. Wieckowska, I. Willner, Angew. Chem. Int. Ed.47, 3927 (2008). doi:10.1002/anie.200705991
26. C.C. Huang, Z. Yang, K.H. Lee, H.T. Chang, Angew. Chem. Int. Ed.46, 6824 (2007). doi:10.1002/anie.200700803
27. C.C. Huang, H.T. Chang, Anal. Chem. 78, 8332 (2006). doi:
10.1021/ac061487i
28. X. Xue, F. Wang, X. Liu, J. Am. Chem. Soc.130, 3244 (2008). doi:10.1021/ja076716c
29. A.S. Susha, A.M. Javier, W.J. Parak, A.L. Rogach, Colloids Surf. A Physicochem. Eng. Aspects 281, 40 (2006). doi:10.1016/ j.colsurfa.2006.02.014
30. P. Raveendran, J. Fu, L. Wallen, J. Am. Chem. Soc.125, 13940 (2003). doi:10.1021/ja029267j
31. P. Raveendran, J. Fua, S.L. Wallen, Green Chem.8, 34 (2006). doi:10.1039/b512540e
32. A.J. Bard, R. Parsons, J. Jordan,Standard Potentials in Aqueous Solution (International Union of Pure and Applied Chemistry Marcel Dekker Inc., New York, 1985)
33. L. Katsikas, M. Gutie´rrez, A. Henglein, J. Phys. Chem. 100, 11203 (1996). doi:S0022-3654(96)00357-7
34. J. Atoji, Chem. Phys.31, 1628 (1959)
[image:5.595.62.278.58.198.2]35. J. Zhu, Y.C. Wang, L.Q. Huang, Y.M. Lu, Phys. Lett. A.323, 455 (2004). doi:10.1016/j.physleta.2004.02.038
Fig. 5 a TEM and HRTEM images of product of the reaction
36. J. Zhu, Physica E 27, 296 (2005). doi:10.1016/j.physe.2004. 12.006
37. M. Gaudry, J. Lerme´, E. Cottancin, M. Pellarin, J.-L. Vialle, M. Broyer, B. Pre´vel, M. Treilleux, P. Me´linon, Phys. Rev. B 64, 085407 (2001). doi:10.1103/PhysRevB.64.085407
38. K.S. Lee, M.A. El-Sayed, J. Phys. Chem. B110, 19220 (2006). doi:10.1021/jp062536y