ISSN: 1992-8645 www.jatit.org E-ISSN: 1817-3195
266
SMES PERFORMANCE AND SUBSIDIES IN IT
INVESTMENTS: A VIS-À-VIS APROACH
1CHRISTOS LEMONAKIS, 2KONSTANTINOS VASSAKIS, 3ALEXANDROS GAREFALAKIS,
4PETRO PAPA
1
Visiting Lecturer, Neapolis University Paphos, MBA Postgraduate Program, NUP, Greece
2,3
Technological Educational Institute of Crete, TEIC, Greece
4
University of Portsmouth, UOP, England
E-mail: [email protected],[email protected], [email protected],
4
ABSTRACT
In the knowledge-based and globalized economy, information provides value to firms and Information Technology (IT) is the mechanism through can be achieved. Companies that exploit endless possibilities of Information Technology obtain the capacity to overcome future challenges. This study is focused on the case of Greek SMEs that face an extremely competitive and unfriendly macro environment and examines the performance of IT investments of Greek SMEs through a combination of qualitative and quantitative longitudinal data. A variety of financial as well as qualitative (primary) data are used for the examination of the correlation between profitability and IT.Α survey-based methodology was used for the collection of qualitative data of Greek SMEs covering the time period of 2004-2010. The examining period is divided into two sub-periods: pre crisis and post crisis periods. Additionally, the examination of the relationship of European IT investment subsidy with firm profitability is examined. The results of this empirical study indicate that companies with IT investments present higher profitability than their rivals. SMEs are the backbone of national economy, thus their competitiveness plays a significant role to national development and growth. Therefore, the findings of this research have implications for practitioners, managers and policy makers.
Keywords: IT investments, SMEs Performance, Profitability, Competitiveness and European Subsidies.
1. INTRODUCTION
This study attempts to measure the performance of IT investments on Greek SMEs. The study is related to an extended literature of measuring IT performance and examining its origins. It gives empirical results from the Greek market, takes position on some key issues of the existing theory, introduces a new approach of utilizing data available and initiates a debate over the possible implications that the existence of subsidy programs may create when researchers try to value the performance of IT investments.
Academic cycles have been calling for an extension of the existing theory about the nature of IT in order to keep pace with the new reality that has been created. The new theory is more applicable when trying to explain the behavior of complex modern multinational firms and is not necessary best when trying to examine companies which operate in a more old fashioned way [1].
The study is also hoped to attract the interest of practitioners as it makes use of primary data,
collected directly from the market participants and attempts to answer a question which stands at the heart of business decision making. Moreover, the study can be very useful to policy makers and other parties that are professionally interested to deepen their knowledge on the financial performance of IT investments.
The study adopts elements from prior theoretical and empirical research, but tries to also incorporate new ones which can better reflect the particularities of the chosen case. More specifically, the study takes initiative from the fact that IT expenditures form a critical part of the annual budget of the modern business enterprise and its importance is increasing [2]. Therefore, its behavior needs theoretical explanations and its performance should
become visibly measurable by explaining
differences on various performance indexes among firms.
The two leading theories of explaining the performance differences among firms are Porter’s Competitive Strategy and the Resource Based View
ISSN: 1992-8645 www.jatit.org E-ISSN: 1817-3195
267 Technology makes it difficult defining answers for worldwide applicability and particularly in the case of SMEs.
One gap that the study aims to cover is about the performance of IT investments on Greek SMEs during the past few years, since no other study related to that exists. Therefore, the study goes deeper in theory and proposes a new methodology technique that can address for a wide range of companies wherever they operate. Apart from contributing to the existing academic debate of the performance of IT investments, this paper also introduces the issue of subsidy programs which support technology investments European-wide and, hopefully, opens a new area of discussion among scholars. Moreover, the real life practical results of this work can influence the decision making process of practitioners who are constantly interested on these kind of studies from the academic world.
The structure of the paper is as follows: Section 2 provides a brief introduction for the Greek case
regarding European Union (EU) funding
framework. Section 3 places emphasis on the related literature in view of the relation between IT investments and performance. Section 4 describes the methodology, the data sets and the research structure of the study, while setting the research questions. Section 5 analyses and interprets the outcomes of the regression model, while in Section 6 discussions of results are explicitly presented.
Finally, Section 7 summarizes the main
implications and places the innovative
characteristics of the study.
2. THE CASE OF GREECE
Greece’s growth rate in fixed assets experienced significant decrease from the eruption of financial crisis in 2008. Greece presents more than 725,000 SMEs [4]. Small enterprises having a share of 21.2% of the total economy, as opposed to the European average of 18.5%. In addition, Medium-sized enterprises generate a value of €10 Billion per year, or 14.8% of the total value added, as opposed to the 18.4% average of the 27 countries of the European Union. Although Greek companies perform better than their European counterparts on Entrepreneurship indexes, there is evidence that they face more difficulties in State aid and Public Procurement. In addition, they face difficulties in their access to finance because of the tightening of loan granting after the crisis. Moreover, even though they are generally more innovative, they lack in participating in EU funded research projects
and using of the Internet as a channel to buy or sell products.
According to the “7thProgramme for Research and Technological Development 2007-2013” [5], almost €50 billion are planned to be allocated towards SMEs for reasons of technology related projects alone. Thus, funding from the various European Union programs is always a considerable option for European SMEs. Greek SMEs, as part of European Union, are eligible to participate in various programs which subsidize part of their investments, especially in the area of innovation and new technology. These funds can prove to be vital for Greek SMEs which are currently not available to use more traditional funding from financial institutions [4] and operate in a country which lacks behind its European counterparts on expenditures on Information and Communication Technologies as a percentage of GDP [6].
3. LITERATURE REVIEW
There is bulk of literature in theoretical
frameworks, datasets, methodologies and
estimation techniques used in order to answer the questions relating to the links between IT and business performance [7].
In the beginning of the 1990’s the topic attracted more attention after several empirical studies established what is now known in the literature as “productivity paradox” [8]. The “productivity paradox” described the difficulty that researchers had in observing a positive relationship between the
ever increased IT investments on firms’
performance. In [9] the authors suggest that previous research was misguided by posing the wrong questions. Their study concluded that there was a direct link between IT investments and production output, which, however, need not, necessarily, be reflected in the profitability ratios of firms operating in competitive markets where consumers can be the ultimately benefited ones. They showed that consumer surplus had increased alongside with firms’ productivity.
Even with the “productivity paradox put to rest” [10], the question of whether IT investments should be mirrored on the bottom lines of the firms’ Income Statements or in other market oriented measures still remained. Although an equally straightforward answer to this question, as the one given on productivity, is seemingly more difficult, it can be argued that it is of higher importance to business managers and investors.
ISSN: 1992-8645 www.jatit.org E-ISSN: 1817-3195
268
relationship between IT investments and
performance leading to enhancement of
performance and becoming source of sustainable competitive advantage (see [11], [12], [13], [14], [15] and [16]). Although this approach improved information related to the behavior of IT investments, but there have been others that not exclude Porter’s Competitive Advantage theory from the equation (see [3]). The authors in [17] recognize IT as a source of obtaining Competitive Advantage suggesting that IT investments should not be seen in isolation from the rest of the world, and trying to incorporate the competitive environment into its empirical part.
In literature it is also observed focus on well established companies mainly from Western [13]. SMEs form a substantial part of the economy of a country and should be given more attention. Many scholars’ select large companies in order to use matched pairs technique (see [12] and [18]). The author [12] used a data sample of 56 firms, whilst in [18] a dataset of 71. Even whether the sample size limitation is offset by the superiority of the technique, seeking examination of SMEs finds no reliable third party data to distinguish IT leaders from their counterparts.
Because of lack in qualitative data on firms’ IT characteristics scholars make primary research survey through questionnaires (see [19] and [3]). The studies using primary data are more likely to
show a positive relationship between IT
investments and firm performance [20].
Another limitation for scholars examining behavior of IT investments on SMEs is the lack of publicly available data of their value in the market. One widely used in the literature market oriented measure utilized is Tobin’s q (see [21] and [14]) concluding that IT investments have a positive effect on firms’ value. Authors in [22] use data from the American healthcare industry having access to market value data of hospitals that changed ownership and conclude that Tobin’s q ratio better reflects the impact of IT investments. Although Tobin’s q can better capture a firm financial performance, many scholars used of book value ratios (see [20], [14] and [23]).
The most widely accepted and used accounting ratio as dependent variable is the Return on Assets (ROA). However, this ratio has produced mixed results in empirical works. Some researchers found a negative correlation of IT with ROA (see [24], [25] and [23]), while others found positive correlation (see [26] and [12]). Additionally, some studies found the relationship of IT to ROA to be insignificant (see [27], [28] and [22]), while others
that were inconclusive due to different results in sign and significance with different models or populations (see [9] and [29]).
The sample sizes of the studies reviewed differ and are usually related to the estimation method used. Authors [20] in their meta-analysis of previous studies found evidence that larger sample sizes are usually correlated with the studies reporting a positive relationship between IT investments and firm performance. Moreover, longitudinal data are preferred to cross-sectional data because they control for lag effects from the time the IT investments are made till the time that their impact on the firm’s performance can become measurable. Many popular studies choose an up to a six years period of longitudinal data (see [9], [14], [23] and [16]). Although researchers would always prefer to be able to employ as much data as possible, a six years period is considered satisfactory enough in order to control for lag effects since IT investments are not expected to start making their impact visible a long time after they are implemented. In fact, authors in [18] argued that the benefit from IT investments on firm performance, although significant, is only valid for a short period of time, with a period of two years being the usual upper limit.
Another point of concern is whether identification of IT investments into their respective categories has an impact on the final results obtained. Authors in [30] found mixed results from CAD/CAM
systems’ implementation in the Greek
manufacturing industry. Successful implementation of Supply Chain Management (SCM) systems and
Customer Relationship Management (CRM)
systems were most likely to follow prior successful implementation of Enterprise Resource Planning (ERP) systems [25]. Several studies attempt to develop a broader framework of what consists the IT and how it behaves (see [31] and [32]), and empirical findings that non exact identification of IT is related with observations of a positive impact on firms’ performance [20].
ISSN: 1992-8645 www.jatit.org E-ISSN: 1817-3195
269 investments as discretionary expenditures as it is widely accepted that managers use in order to maximize their own utility function, taking into consideration the constraints of satisfactory profits required by stakeholders [34]. In fact, agency theory was proposed as a possible explanation for the “productivity paradox” [8]. Authors in [35], also, raise agency theory questions investigating the role of the board of directors’ independence in the performance of corporate IT investments in the Taiwanese market. Even though this viewpoint is beyond the scope of the present paper, lending from behavioral economics’ theory can be useful in order to examine a particular moral hazard aspect that can arise in the case of our study population.
Authors in [36] present evidence that European R&D Subsidy Programs have produced mixed results in Spain arguing that there is a gap in the literature of Information Technology investments to control real life aspects of SMEs. It is reasonable to be assumed that the subsidy programs should increase the profits of the beneficiated companies. However, it could also be the case that businesses misuse these third party funds and do not take the necessary actions to align these investments with the corresponding human IT resources and other complementary resources as theory suggests (see [32] and [37]). Authors in [32] suggest that a comprehensive model on IT investments should take into account, apart from the various IT resources, the business processes and performance, the competitive environment and the macro environment. Authors in [38] found that IT investments, size and subsidies on IT financing have positive impact on firms’ profitability in line with some previous academic studies.
Greece’s growth rate in fixed assets experienced.
4. METHODOLOGY-DATA
Two major contributors to the Greek economy are the Manufacturing industry and the Hospitality Industry [39]. Manufacturing has been experienced a contraction in the last 20 years and amounts for only 8% of the economy. However, it is important because it is the third largest employer and makes the most contributions to the social insurance schemes. The hospitality industry, on the other hand, is a traditional strength of the Greek economy, accounting for 15% of the Gross Domestic Product.
This study chooses Small and Medium-size enterprises from these two industries to perform its empirical part due to their importance to the Greek
economy. For the determination of SMEs European Commission’s definition of SMEs is followed [40]. Greece’s largest business intelligence database, ICAP, was used in order to obtain the quantitative data the time period of 2005 to 2010, which, however, is totally acceptable for this kind of analysis. For the qualitative data required a questionnaire was formed and answered by telephone interviews from firms’ managers. From the questionnaire, significant issues relating to IT investments, their characteristics, internal and competitive environment.
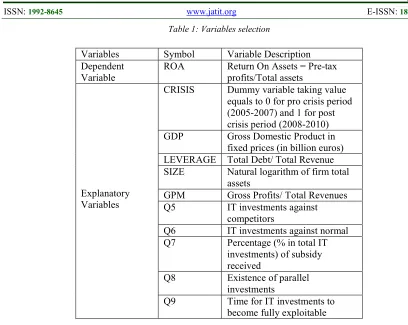
Additionally, issues about external funding to subsidize IT investments are extracted. The data sample is constituted by 88 Greek SMEs. In this survey we use the following variables (Table 1 provides a brief summary of the variables selected). More specifically:
• ROA is the dependent variable, the behavior of
which is intended to be examined. In the absence of market data, this is a very popular book value measure of how the firm’s assets performed throughout the year (see [41] and [15]). The nominator of the ratio is comprised by the reported pre-tax earnings [42] in order to minimize any discrepancies in the ratio coming from the tax code. The denominator is comprised by the book value of the total assets in the end of the year [29].
• CRISIS is a dummy variable in order to control
for the structural break that the recent economic downturn caused in the Greek Economy after the year 2008. Authors in [32] suggest that a comprehensive model should take account of the macroeconomic variables GDP as well as CRISIS.
• LEVERAGE is a risk variable, a ratio to
control for risk effects. It is comprised of the total long term and short term debt in the numerator and the total revenues in the denominator [2]. Size estimated by the natural logarithm of the total assets [43].
A five point discrete longitudinal variable also included, taking values from 0 to 4 indicating
correlation of IT investments with firms’
competitiveness. Recent study of [37] suggests that IT investments should show a positive impact on profitability. More specifically, we have:
• VARIABLE (Q5), a five point discrete variable
that takes values from 0 to 4 for IT investments level, with 0 the lower value and 4 the highest value.
• VARIABLE (Q6), a six point discrete
ISSN: 1992-8645 www.jatit.org E-ISSN: 1817-3195
270
• DUMMY VARIABLES (Q7) AND (Q8),
which take the values 0 and 1 for existence or not of IT investments (Q7) and existence or not of parallel investments (Q8), respectively.
• VARIABLE (Q9), a three point discrete
variable taking the values of 0 to 2 throughout the six year period, for each firm of the sample, indicating the time in years needed for the appropriate exploitation of IT investments.
5. EMPIRICAL RESULTS
In order to investigate the relationship of IT investments on Greek SMEs’ performance the econometric model combines quantitative data and qualitative data (see [15] and [16]) as the inclusion of primary data is considered superior to the usage of secondary data. Estimated Generalized Least Squares (EGLS) regression with cross section weights was used.
We run through all appropriate econometric tests and we find out that the most appropriate model for our research consists of the variables CRISIS, GDP, LEVERAGE, SIZE, GPM, Q5, Q8 and Q9, while the variables Q6 and Q7 are excluded from the model; it happens because variables Q6 and Q7
increase the serial correlation
and heteroskedasticity of the econometric model. So, the model we finally use is the following:
ROAij=b0+b1CRISISj+b2GDPj+b3LEVERAGEij+b4
SIZEij+b5GPMij+b6Q5ij-1+b7Q8ij-1+b8Q9i+eij,
where eij is the error term.
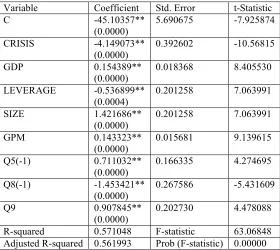
Also, we use lagged values for variables Q5 and Q8 up to 1 period, in order to better describe the effects of the IT investments in sample firms. See Tables 2 and 3, where regressions’ results are depicted with quantitative variable only (Table 2) and both quantitative and qualitative variables (Table 3), respectively.
The model is theory consistent with the structural variables. More specifically, the financial crisis had a severe negative impact on firms’ profitability. The Gross Domestic Product (GDP) has a small positive but statistically significant impact on Returns on Assets (ROA). LEVERAGE, in the way it is defined in this research, has a moderate
negative impact on ROA, reflecting the
unjustifiable risks expanding through firms’ debt, and more importantly, the short term debt. The SIZE of the firm as measured by the log of Total Assets has a large positive impact on profitability. The operational capabilities of firms, as measured
by the Gross Profit Margin, do have a small but positive relationship with profitability, suggesting that higher gross profits would likely lead to higher net profits volumes, regarding no change in the total sales and the size of the company.
The most significant findings of this study come from the regressed qualitative variables of the questionnaire used. Firms’ IT investments in relatively higher level than that of their competitors provide significantly higher returns in any case, even in the short run, with lag values of one period (Q5).
Parallel investments of strategic importance (Q8) decrease profitability in the short run, which is quite rational in a sense that strategic investments pose a differentiation in firms’ efficiency in a medium to long time period. Also, the time required for IT investments to become fully exploitable by a firm (Q9) shows that firms’ IT investments can be exploitable and able to create competitive advantage at least after one year of their establishment. Finally, there is no conclusion about the effects in firms’ efficiency of subsidy programs whether positive or negative, as it looks like that there is no significant relation with firms’ profitability, as it was initially expected.
6. DISCUSSION OF RESULTS
The findings of this study about the impact of IT investments on SMEs profitability are significant and in parallel with other research works (see [26]
and [12]). However, other studies found
insignificant relationship of IT investments and firms’ performance (see [27], [28] and [22]) or negative effects on ROA (see [24], [25] and [23]), while there are studies that question the explanatory power of models with accounting data altogether [21]. There are also several studies found a positive relation of IT investments on firms’ profitability as measured by ROA or other measures (see [26], [12], [18] and [16]) and do not present the “profitability paradox” [23].
ISSN: 1992-8645 www.jatit.org E-ISSN: 1817-3195
271 certainly leverage the overall benefits (see [27], [14] and [19]). However, the findings of this research are a strong indicator for the growing importance of SMEs IT investments’ that can provide a solid ground not only for their survival but also for their competitive and efficient way of making business.
7. CONCLUSIONS
This research study is innovative in many aspects and contributes to the relevant academic field. The approach used here is to utilizing quantitative and qualitative data collected specifically for this study, using a panel regression model to describe IT investments and their effects on SMEs profitability. Moreover, the design of a simple, yet powerful questionnaire, adds to the existing literature of how IT investments should be perceived and treated. In addition, this paper initiates a new discussion about the possible effects that subsidy programs may have on the SMEs performance, which are in some cases doubtful regarding their real effectiveness.
Also, financial institutions will sooner or later face the fact to turn again their interest in granting loans to SMEs, towards increasing their efficiency. Through the easing of access to financial resources in businesses, SMEs can better serve their own interests, become more efficient and competitive, while regaining gradually part of the losses occurred during the crisis period.
REFRENCES
[1] Kohli, R. and Grover, V., “Business Value of
IT: An Essay on Expanding Research Directions to Keep up with the Times”, Journal of the Association for Information
Systems, Vol.9, No.1, 2008, pp. 23-39.
[2] Henderson, B.C., Kobelsky, K., Richardson,
V.J. and Smith, R.E., “The Relevance of
Information Technology Expenditures”,
Journal of Information Systems, Vol.24, No.2,
2010, pp. 39-77.
[3] Rivard, S. Raymond, L. and Verrault, D.,
“Resource Based View and Competitive Strategy: An integrated model of the contribution of Information Technology to
firm performance”, Journal of Strategic
Information Systems, Vol.15, 2006, pp. 29-50.
[4] European Commission, “Enterprise and
Industry SBA Fact Sheet 2012”, 2012a
Available at:
http://ec.europa.eu/enterprise/policies/sme/fact
s-figures-analysis/performance- review/files/countries-sheets/2012/greece_en.pdf
[5] European Commission, “European Union
Support Programmes for SMEs: An overview of the main funding opportunities available to
European SMEs”, 2012b,
Available at:
http://ec.europa.eu/enterprise/newsroom/cf/_g etdocument.cfm?doc_id=7264
[6] European Commission, “The Economic
adjustment program for Greece: Third Review”, Occasional Papers, 77, 2011.
Available at:
http://ec.europa.eu/economy_finance/publicati ons/occasional_paper/2011/pdf/ocp77_en.pdf
[7] Osei-Bryson, K.M. and Ko, M., “Exploring
the relationship between information
technology investments and firm performance
using regression splines analysis”, Information
& Management, Vol. 42, 2004, pp. 1-13.
[8] Brynjolfsson, E., “The productivity paradox of
information technology”, Communications of
the ACM, Vol. 36, No12, 1993, pp. 66-77.
[9] Hitt, L.M. and Brynjolfsson, E., “Productivity,
Business Profitability and Consumer Surplus: Three Different Measures of Information
Technology Value”, MIS Quarterly, June,
1996
[10]Dedrick, J., Gurbaxani, V. and Kraemer, K.L.,
“Information Technology and Economic Performance: A Critical Review of the
Empirical Evidence”, ACM Computing
Surveys, Vol.35, No.1, 2003, pp. 1-28.
[11]Powell, T.C. and Dent-Micallef, A.,
“Information Technology as Competitive Adventage: The Role of Human, Business and
Technology Resources”, Strategic
Management Journal, Vol. 18, No.5, 1997,
pp. 375-405.
[12]Bharadwaj, A.S., “A Resource-Based
Perspective on Information Technology
Capability and Firm Performance: An
Empirical Investigation”, MIS Quarterly, Vol.
24, No.1, 2000, pp. 169-196.
[13]Wade, M. and Hulland, J., “Review: The
Resource-Based View and Information
Systems Research, Extension, and
Suggestions for Future Research”, MIS
Quarterly, Vol. 28, No.1, 2004, pp. 107-142.
[14]Tanriverdi, H., “Information Technology
Relatedness, Knowledge Management
Capability, and Performance of Multibusiness
Firms”, MIS Quarterly, Vol.29, No. 2, 2005,
ISSN: 1992-8645 www.jatit.org E-ISSN: 1817-3195
272
[15]Huang, S-M., Ou, C-S., Chen, C-M. and Lin,
B., “An empirical study of relationship between IT investment and firm performance:
A resource-based perspective”, European
Journal of Operational Research, Vol. 173,
2006, pp. 984-999.
[16]Mithas, S., Tafti, A., Bardhan, I. and Goh,
J.M., “Information Technology and firm profitability: Mechanisms and Empirical
Evidence”, MIS Quarterly, Vol. 36, No. 1,
2012, pp. 205-224.
[17]Porter, M.E. and Millar, V.E., “How
information gives you competitive
advantage”, Harvard Business Review, Vol.
63, 1985, pp. 149–160. Available at: http://search.ebscohost.com/login.aspx?direct =true&db=bth&AN=8500002422&lang=fr&si te=ehost-live
[18]Stratopoulos, T. and Dehning, B., “Does
successful investment in information
technology solve the productivity paradox?”,
Information Management, Vol. 38, 2000, pp.
103-117.
[19]Byrd, T.A., Lewis, B.R. and Bryan, R.W.,
“The leveraging influence of strategic alignment on IT investment: An empirical
examination”, Information & Management,
Vol. 43, 2006, pp. 308-321.
[20]Kohli, R. and Devaraj, S., “Measuring
Information Technology Payoff: A meta-analysis of Structural Variable in Firm-level
Empirical Research”, Information Systems
Research, Vol. 14, No. 2, 2003, 127-145.
[21]Bharadwaj, A.S., Bharadwaj, S.G. and
Konsisky, B.R., “Information Technology
effects as measured by Tobin’s Q”,
Management Science, Vol. 45, No. 7, 1999,
pp. 1008-1024.
[22]Kohli, R., Devaraj, S. and Ow, T.T., “Does
Information Technology Investment Influence a Firm’s Market Value? A case of
Non-Publicly Traded Healthcare Firms”, MIS
Quarterly, Vol. 36, No. 4, 2012, pp.
1145-1163.
[23]Beccalli, E., “Does IT investment improve
bank performance? Evidence from Europe”,
Journal of Banking & Finance, Vol. 31, 2007,
pp. 2205-2230.
[24]Sircar, S., Turnbow, J.L. and Bordoloi, B., “A
Framework for Assessing the Relationship Between Information Technology Investments
and Firm Performance”, Journal of
Management Information Systems - Special issue: Impacts of information technology
investment on organizational performance, Vol. 16, No. 4, 2000, pp. 69-97.
[25]Aral, S., Brynjolfsson, E. and Wu, D.J.,
“Which came first, IT or Productivity? The Virtuous Cycle of Investment and Use in
Enterprise Systems”, Twenty seventh
International Conference on Information
Systems, Milwaukee, 2006
[26]Rai, A., Patnayakuni, R. and Patnayakuni, N.,
“Technology Investment and business
performance”, Communications of the ACM,
Vol. 40, 1997, pp. 89-97.
[27]Shin, N., “The impact of information
technology on financial performance: the
importance of strategic choice”, European
Journal of Information Systems, Vol. 10,
2001, pp. 227-236.
[28]Aral, S. and Weill, P., “IT assets,
organizational capabilities, and firm
performance: How resource allocations and
organizational differences explain
performance variation”, Organization Science,
Vol. 18, No. 5, 2007, pp. 763-780.
[29]Tam, K.Y., “The impact of information
technology investments on firm performance
and evaluation: evidence from newly
industrialized economics”, Information
Systems Research, Vol. 9, 1998, pp. 85-98.
[30]Theodorou, P. and Florou, G., “Manufacturing
strategies and financial performance: The effect of advanced information technology: CAD/CAM systems”, Omega, Vol. 36, 2008, pp. 107-121.
[31]Sambamurthy, V., Bharadwaj, A. and Grover,
V., “Shaping Agility Through Digital Options: Reconceptualizing the role of Information
Technology in Contemporary Firms”, MIS
Quarterly, Vol. 27, No. 2, 2003, pp. 237-263.
[32]Melville, N., Kraemer, K. and Gurbaxani, V.,
“Review: Information Technology and
Organizational Performance: An Integrative
Model of IT Business Value”, MIS Quarterly,
Vol. 28, No. 2, 2004, pp. 283-322.
[33]Brynjolfsson, E. and Hitt, L.M., “Beyond
Computation: Information Technology,
Organizational Transformation and Business
Performance”, Journal of Economic
Perspectives, Vol. 14, No. 4, 2000, pp. 23-48.
[34]Jones, T., “Business Economics and
Managerial Decision Making”, Chichester:
Wiley, 2004.
[35]Ho, J.L.Y., Wu, A. and Xu, S.X., “Corporate
ISSN: 1992-8645 www.jatit.org E-ISSN: 1817-3195
273
emerging market”, Strategic Management
Journal, Vol. 32, 2011, pp. 595-623.
[36]Blanes, J.V. and Busom, I., “Who participates
in R&D subsidy programs?: The case of
Spanish manufacturing firms, Research
Policy, Vol. 33, No. 10, 2004, pp.1459-1476.
[37]Wang, N., Liang, H., Zhong, W., Xue, Y. and
Xiao, J., “Resource Structuring or Capability Building? An Empirical Study of the Business
Value of Information Technology”, Journal of
Management Information Systems, Vol. 29,
No. 2, 2012, pp. 325-367.
[38]Voulgaris, F., Lemonakis, C. and Vassakis,
K., “SMEs and IT investment: a Structural
Equation Modeling (SEM) Approach”,
Journal of System and Management Sciences,
Vol. 5, No. 2, 2015, pp. 59-75.
[39]McKinsey & Company, “Greece 10 Years
Ahead- Defining Greece’s new growth and
strategy: Executive summary”, 2012,
Available at:
http://www.mckinsey.com/locations/athens/Gr eeceExecutiveSummary_new/pdfs/Executive_ summary_English_new.pdf
[40]European Commission, “The new SMES
definition: User guide and model Declaration,
Enterprise and Industry Publications”, 2003,
Available at:
http://ec.europa.eu/enterprise/policies/SMEs/fi les/SMEs_definition/SMEs_user_guide_en.pd f.
[41]Mahmood, M.A., & Mann, G.J., “Measuring
the organazational impact of Information Technology Investment: An exploratory
study”, Journal of Management Information
Systems - Special section: Realizing value
from information technology investment, Vol.
10, No. 1, 1993, pp. 97-122.
[42]Dickerson, A.P., Gibson, H.D. and Tsakalotos,
E., “An impact of Acquisitions on company performance: Evidence from a large panel of
U.K. firms”, Oxford Economic papers, Vol.
49, 1997, pp. 344-361.
[43]Kalkan, A., Erdin, O. and Celtinkaya, O.,
“The relationships between Firm size,
prospector strategy, Architecture of
Information Technology and Firm
Performance”, Procedia Social and
behavioral Sciences, Vol. 24, 2011, pp.
ISSN: 1992-8645 www.jatit.org E-ISSN: 1817-3195
[image:9.612.87.495.70.395.2]274
Table 1: Variables selection
Variables Symbol Variable Description
Dependent Variable
ROA Return On Assets = Pre-tax
profits/Total assets
Explanatory Variables
CRISIS Dummy variable taking value
equals to 0 for pro crisis period (2005-2007) and 1 for post crisis period (2008-2010)
GDP Gross Domestic Product in
fixed prices (in billion euros) LEVERAGE Total Debt/ Total Revenue
SIZE Natural logarithm of firm total
assets
GPM Gross Profits/ Total Revenues
Q5 IT investments against
competitors
Q6 IT investments against normal
Q7 Percentage (% in total IT
investments) of subsidy received
Q8 Existence of parallel
investments
Q9 Time for IT investments to
become fully exploitable
Table 2: Model with quantitative variables only (Prob. in parentheses, *: statistical significant at 5% level, and
**: statistical significant at 1% level of significance)
Variable Coefficient Std. Error t-Statistic
C -25.41207**
(0.0000)
2.895730 -8.775704
CRISIS -3.762972**
(0.0000)
0.552047 -6.816401
GDP 0.054347**
(0.0002)
0.014393 3.775849
LEVERAGE -0.676834**
(0.0000)
0.080525 -8.405276
SIZE 1.355562**
(0.0000)
0.107555 12.60340
GPM 0.155751**
(0.0000)
0.011683 13.33121
R-squared 0.441482 F-statistic 78.09681
Adjusted R-squared
0.435829 Prob
(F-statistic)
[image:9.612.162.451.451.645.2]ISSN: 1992-8645 www.jatit.org E-ISSN: 1817-3195
[image:10.612.167.447.137.387.2]275
Table 3: Model with quantitative and qualitative variables (Prob. in parentheses, *: statistical significant at 5% level, and
**: statistical significant at 1% level of significance)
Variable Coefficient Std. Error t-Statistic
C -45.10357**
(0.0000)
5.690675 -7.925874
CRISIS -4.149073**
(0.0000)
0.392602 -10.56815
GDP 0.154389**
(0.0000)
0.018368 8.405530
LEVERAGE -0.536899**
(0.0004)
0.201258 7.063991
SIZE 1.421686**
(0.0000)
0.201258 7.063991
GPM 0.143323**
(0.0000)
0.015681 9.139615
Q5(-1) 0.711032**
(0.0000)
0.166335 4.274695
Q8(-1) -1.453421**
(0.0000)
0.267586 -5.431609
Q9 0.907845**
(0.0000)
0.202730 4.478088
R-squared 0.571048 F-statistic 63.06848