ISSN: 1992-8645 www.jatit.org E-ISSN: 1817-3195
568
AN IMPROVED OF SPAM E-MAIL CLASSIFICATION
MECHANISM USING K-MEANS CLUSTERING
1,2NADIR OMER FADL ELSSIED, 1OTHMAN IBRAHIM, 1WAHEEB ABU-ULBEH
1
Faculty of Computing, Universiti Teknology Malaysia(UTM), 81310, Skudai, Johor Bahru, Malaysia 2Algeraf Sharq Technical College, Khartoum, Sudan
E-mail: [email protected] , [email protected] , [email protected]
ABSTRACT
Spam e-mails are considered as a serious violation of privacy. In addition, it has become costly and unwanted communication. Although, Support Vector Machine (SVM) has been widely used in e-mail spam detection, yet the problem of dealing with huge data is time and memory consuming and low accuracy. This study speeds up the computational time of SVM classifiers by reducing the number of support vectors. This is done by the K-means SVM (KSVM) algorithm proposed in this work. Furthermore, this paper proposes a mechanism for e-mail spam detection based on hybrid of SVM and K-means clustering and requires one more input parameter to be determined: the number of clusters. The experiment of the proposed mechanism was carried out using spambase standard dataset to evaluate the feasibility of the proposed method. The result of this hybrid method led to improved SVM classifier by reducing support vectors, increasing the accuracy and decreasing the time of e-mail spam detection. Experimental results on spambase datasets showed that the improved SVM (KSVM) significantly outperforms SVM and many other recent spam detection methods in terms of classification accuracy (effectiveness) and time consuming (efficiency).
Keywords: K-means clustering, Machine Learning, Spam detection, SVM.
1. INTRODUCTION
With the increasing growth of internet technologies, electronic mail (e-mail) has become an essential way of communication among members of society [1, 2].This is due to minimal transmission costs, faster delivery of a message, reliability and enhanced efficient communication [3-7]. The wide use of e-mails consequently leads to spam e-mails and according to an estimated statistical report, over 1.4 billion e-mail messages were sent per day in 2009. This figure is anticipated to double by 2013 [8].In fact over 70% of business e-mails are spam [9]. The growth of internet and the growing use of e-mails have led to the appearance of extra growth of problems caused by unwanted bulk e-mail messages, regularly referred to as spam [10-12]. There are several critical problems connected with increasing volumes of spam such as filling user’s mailboxes, wastage of storage space and e-mail bandwidth, wasting user’s time to delete all spam messages and damage their computers due to infecting them with viruses [13, 14]. Spam mails vary significantly in content and most of it is
commercial adverts [15]. Several measures are put in place by many companies in creating anti-spam software based on signatures, and have a very efficient performance in detecting spam quickly [16]. However, no spam detection software is 100% effective, new variations of spam and unknown spam are very difficult to detect by this software [17]. The traditional way of detecting spam based on signature is no more efficient in today’s systems [18].
569 Currently, SVM is one of the most common algorithms for spam detection [23]. However, in many cases it takes a long processing time and provides a less accurate rate for classification due to huge data [3, 19, 24]. Although SVM can build classifiers with high testing accuracy, the computational time of SVM classifiers still needs to improve when applied into e-mail spam detection. Two elements affecting the computational time of SVM classifiers are the number of input variables and that of the support vectors. Several researchers tried to improve the computational time by selecting parts of input variables; this paper tries to improve the computational time of SVM classifiers by reducing support vectors. Based on the above motivation, this paper proposes a new e-mail spam detection mechanism called KSVM by using a hybrid of SVM and K-means clustering to enhance SVM and increase the accuracy (effectiveness) of e-mail spam detection mechanism. This paper tries the K-means clustering technique to reduce support vectors. A review of the current literature reveals that the combined of K-means clustering and SVM not has been employed for e-mail spam classification till date. K-means clustering is used to reduce the support vectors and SVM for classification to improve the accuracy and reducing the computational time for SVM.
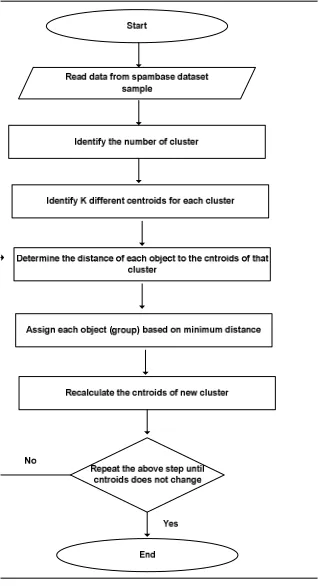
The experiments result showed the KSVM algorithm can find a good combination of input parameters to greatly reduce the number of support vectors and computational time of classifiers and maintain a similar testing accuracy to SVM. A comparative study has been carried out between spam detection using SVM and by using the hybrid of SVM and K-means clustering. Structure of the proposed method is shown in Figure 1.
The remaining of this paper is organized as follows: Section two discusses the related work of spam detection. Proposed method has been elaborated in section three. Section four presents the experimental dataset. Section five describes the experimental and discussion. Finally, the study describes the statistical testing.
2. RELATED WORK
E-mail classification has been an active area of research. Over the past years there have been many algorithms to classify spam mails such as Support Vector Machine (SVM), Negative Selection Algorithm(NSA), Bayesian Network, Artificial Immune Systems(AIS), Particle Swarm Optimization (PSO) and Naïve Bayesian (NB)[3, 6, 14, 25-28]. In most machine-learning based methods, classification methods using behavior-based features are intuitive since they are easier to implement. According to Vinther [29] an approach using Artificial Neural Network (ANN) to classify spam mail was proposed. ANN is an automatic method for detecting spam mail where the training and updating of the classification rules can be done automatically. The input data to the neural network is a list of words presented in e-mails. They used a training dataset consisting of 168 non-spam mails and 186 spam mails, while the testing dataset contained 204 non-spam mails and 337 spam mails. In their work Lee et al. [30] suggested a spam detection model using Random Forest (RF) based on feature selection and parameters optimization simultaneously. Using feature selection to eliminate irrelevant features to prevent processing overhead and parameters optimization to decrease the amount of consuming resources and both of them guaranteeing high detection rate. RF is a particular kind of ensemble learning mechanism and strong on regarding the noise and the number of attributes. They used a spambase dataset for experiments. The results are summarized and optimize the parameters of RF, identifying the main features as a numerical value and detecting spam with low processing overheads and high detection rates.
In his journal Idris [31] presented e-mail spam classification using spambase dataset based on combination of Artificial Neural Network (ANN) and Negative Selection Algorithm (NSA) to improve the performance of detection. The result of testing and training used the hybrid of artificial neural network and negative selection algorithm is 94.30 compared with 94.05 when using negative selection algorithm and the false positive rate is 0.50. Then, Salehi et al [21] in their work, proposed a hybrid between Simple Artificial Immune System
Figure 1: Structure of the proposed method
Study of SVM and the problem Study of K-means clustering and apply for dataset to clustering or grouping data
Testing the Spam using SVM, comparing result with other known method Apply a combination of K-means
clustering and SVM to testing Spam
Comparisons the result between SVM and combination of K-means clustering and SVM with other known method
ISSN: 1992-8645 www.jatit.org E-ISSN: 1817-3195
570 (SAIS) and Particle Swarm Optimization (PSO) to enhance the performance of spam detection. The result of testing and training is 88.33% with false positive rate of 0.18. The result is get better accuracy than using SAIS only. Later in his paper Idris [18] suggested email spam classification using spambase dataset based on combination of Artificial Neural Network (ANN) and SVM algorithm to improve the performance of detection. The testing and training result used the combinations of ANN and SVM algorithm is 97.78% compared with 96.30 when using SVM with false positive rate of 1.03. In his paper Ying [32] presented an ensemble approach, based on the decision tree (DT), support vector machine (SVM) and back-propagation network (BPN) using two datasets. The first dataset is comprised of 504 emails and, while the second dataset is comprised of 657e-mails; the proposed ensemble approach has the best accuracy test of classification comparing it with others. The first dataset obtained 91.07% while the second dataset obtained 91.78% accuracy. In their study Yin et al.[33] suggested a new spam classification based on linear discrimination analysis (LDA) and ant colony optimization (ACO) algorithm to enhance classification accuracy. LDA is a supervised learning method and it is used for feature selection and dimension reduction by mapping the high dimensional to lower dimensional. ACO is a new-meta heuristic search method for hard combinatorial optimization problems. In his paper, using LDA and ACO with the ling-spam dataset to improve the classification, the result is better than other spam classification algorithm. In their work Drucker et al. [11] proposed SVM approach to classify spam mails. SVM is Binary Classification based on statistical learning theory and can automatically learn from the input data to classify or eliminate spam mails. It was tested on two different datasets and different feature representation of learning algorithms. The result is compared with different algorithms such as Ripper and Boosting decision trees from an accuracy point of view. Then Chhabra et al. [3] presented another approach using SVM to classify spam mails and evaluate the performance of nonlinear SVM based classifiers with various kernel functions over Enron dataset and the result is increased performance. Later Youn [7] suggest email spam classification using different classifiers (Neural Network, SVM , Naïve Bayesian and J48) based on different datasets and feature size. In addition, making comparison with the above method from an accuracy perspective the result is J48 which verifies a better accuracy for the
classification compared with other methods. In his paper DeBarr [34] used clustering method to select an initial set of email message to be labeled as an training example based on Partitioning Around Medoids (PAM) algorithm. After the cluster he used Random Forest algorithm to improve the performance. The result of testing and training used Random Forest algorithm after clustering is 95.2 .Then Zhang [4] proposed a new method based on semantic body and fuzzy clustering to solve the problem of imprecision and fuzziness existing in current spam filtering technology. Zhang used fuzzy due to the complexity of natural language, high uncertainty, fuzziness in description and comprehension. The method also used the semantic body as the object of classification and used similarity coefficient to define the similarity between semantic bodies. The result of testing and training is 89.02 and the result of this method is more objective in determining email content compared with others.
Until now, no one has reached the optimal solution in order to increase the detection accuracy. There are shortcomings regarding the problem of enhancing SVM and increasing the accuracy of spam detection. Numerous studies have shown that combining classifiers yields better results than an individual classifier. These studies implement the combination of K-means clustering and SVM to enhance SVM and to increase the accuracy percentage of spam detection.
3. PROPOSED METHOD
571 and the comparison is carried out for different datasets and classification algorithms.
3.1 Support Vector Machines
Support Vector Machines (SVMs) are relatively new methods that have quickly gained popularity because of the appropriate results that have been achieved in a wide variety of machine learning problems, and because they have solid theoretical underpinnings in statistical learning theory[28, 32, 35]. SVM is a Binary classification technique based on statistical learning theory that was applied with great success in many challenging non-linear classification problems and on large datasets [24, 36]. Binary classification has many advantages such as provide a limited problems space that is easier to analyze mathematically and it is convenient to use for classification data[37]. It can be used to solve Linearly separable as well as Non linear separable problems[3, 19].
The SVM is a supervised learning method that generates input-output mapping functions from a set of labeled training data[38]. Before the
discovery of SVMs, machine learning were not very successful in learning and generalization tasks, with many problems being impossible to solve[7]. There are many kernel-based functions such as linear kernel function , the normalized poly kernel, polynomial kernel function, Radial Basis Function(RBF)or Gaussian Kernel and Hyperbolic Tangent (Sigmoid) Kernel sigmoid function can be implemented in SVM[3]. In this paper for classification, normalized poly kernel are used to transform input data to a high-dimensional feature space in which the input data become more separable compared to the original input space. Maximum-margin hyperplanes are created and SVM algorithm divide the n-dimensional space representation of the data into two regions using a hyperplane [7]. Hyperplane is a concept in geometry and in n-dimensional space the hyperplane is a space with the dimension n-1.The produced model depends only on a subset of the training data near the class boundaries. SVM has many advantages such as obtaining the best result when deal with the binary representation, able to dealing with low number of features[39]. In addition, SVM using statistical learning method, and lead to good performance without the need to incorporate prior information, very effective in text classification field because it has the ability to handle high dimensional data by using kernels, and it can also use large input data and feature set. Furthermore, it is easy to test the influence of the number of features on classification accuracy, SVM more robust to different dataset and pre-processing procedure, and much more for efficient for training and able to deal with supervised and unsupervised learning[10, 40, 41]. It has high accuracy for binary classification, but has the level of misclassification such as non-spam message is very high that mean get low precision[39] .SVM has a number of disadvantages such as require longer learning time, time and memory consuming when the size of data is huge and training time can be very large if there are the large number of training example [3, 19].
SVM classifiers utilize the hyperplane to separate classes. Every hyperplane is characterized by its direction (w), (b) is the exact position in space or a threshold, (x) is the input vector of
dimension N or text content and indicates the class. Thus, a set of labeled training examples:
x, y, x, y, … . x, y;
X∈ R where d the dimensionality of the vector is; y ∈ 1, 1 ; i 1,2, … , k
ISSN: 1992-8645 www.jatit.org E-ISSN: 1817-3195
572 We consider decision function of the form
fx, w, b sgnwx b ,w ∈ R,b ∈ R
Then, the region between the hyperplane if and if, which separates two classes, is called as the margins see Figure 2: illustrates the classification of spam using SVM.
Width of the margin is equal to
‖w‖ and
get the maximum possible margin is the underlying idea of SVM algorithm. Maximization of the margin requires minimization of:
fw, b, ε
‖‖
This is subject to
w x b ≫ 1 , if x ∈ C
w x b ≪ 1 , if x ∈ C
K is a user defined constant, and ε is the margin error. Margin error occurs if data belonging to one class is on the wrong side of the hyperplane. Minimizing the cost is therefore a trade-off issue between a large margin and a small number of margin errors. Solution of this optimization problem is obtained as
w " λ
γχ
This is the weighted average of the training features. Here, λ is a Lagrange multiplier
of the optimization task, and γ is a class label.
Values of λ′s are non zero for all the points lying
inside the margin and on the correct side of the classifier.
3.2 K-means Clustering
573 a K-means clustering to solve the problem of time and memory consuming, by dividing the huge data into subgroups according to similarity, to improve the accuracy of spam detection. The steps of K-means clustering algorithms are seen in Figure 4 showed K-means clustering step. The K-means algorithm starts with initial K centroids, then it assigns each remaining point to the nearest centroid, updates the cluster centroids, and repeats the process until the K centroids do not change .Standard K-means clustering utilizes Euclidean distance to measure the difference between email messages (or Euclidean distance is used as a measure to describe the similarity between data objects) [4, 46].
&X, y ("X y²
The position of a point in a Euclidean n-space is a Euclidean vector. So, X (X,X, ., X ) and Y (Y, Y, ..Y ) are Euclidean vectors, starting from the
origin of the space, and their tips indicate two points.
4. EXPERIMENT DATASET
There are various benchmark datasets available for researchers related to spam mail classification[3]. There has been significant effort to generate public benchmark datasets for the anti-spam classification. One of the main concerns is how to protect the privacy of the users whose non-spam messages are included in the datasets. The first approach is to use non-spam messages collected from mailing lists with public archives. There are many examples of dataset such as:
1. Ling-Spam 2. The Spam Assassin 3. The Spambase
To develop and test spam detection, a dataset containing both non-spam and spam message is required. Furthermore, certain metrics are also required to evaluate the performance of the system. Both problems are discussed below to clarify the experimental framework considered in this paper [28].Machine learning repository has been used for the datasets, center for machine learning and intelligent system for classifying the e-mail as spam and non-spam. The spambase dataset collection is composed of 57 attributes (features) and 4601 instances, the dataset after division has 1813 messages (39.39%) marked as Spam while the non-spam dataset has 2788 messages (60.61%) was proposed by Hopkins et al[47].
This dataset was divided into two classes training and testing dataset which was divided with the percentage of 70% and 30% respectively. Use of the hybrid of K-means clustering and Support Vector Machine (SVM) for trained classifiers by using the spam vector and non-spam vector to detect the testing sample.
A performance index was used for K-means clustering and Support Vector Machine (SVM) to verify the effectiveness and efficiency of the proposed approach. The parameter for K-means clustering and Support Vector Machine (SVM) to be used in this experiment is considered as a constant change optimization process carried out by SVM algorithm. Each partition use 70% as the training data and 30% as the testing data using K-means clustering and SVM as the classification algorithm. This study used a K-means clustering to divide the dataset into groups or clusters, then the output of clustering are used as input of classification for using SVM.
[image:6.612.113.274.420.713.2]Analyzing the spambase dataset from spam and non-spam ratio as demonstrated in Fig.5, the red color indicates to spam (1) while the blue color represent non-spam (0). The X-axis represented by
ISSN: 1992-8645 www.jatit.org E-ISSN: 1817-3195
574 count of e-mail and Y-axis represented by spam type (spam or non-spam) and SVM in Y-axis mean classification type. Figure 5 showed the count of spam mails are 1813 messages while the count of non-spam mails are 2788 messages and the total of emails are 4601 messages.
5. EXPERIMENTAL AND DISCUSSIONS
[image:7.612.74.266.192.298.2]This section explains the accuracy (effectiveness), false positive and time-cost (efficiency) result. The results are compared with others for training and testing results used in the experiments. Use statistical testing for the significance of study, and the evaluation metrics for the accuracy and error rate. Table 1 depicts how the false positive and false negatives are calculated. The first row displays the total non-spam. That is divided to true negative and false positive. The second row is the same as a first row. This row contains the total spam in data sets. Some of them are dedicated wrongly as non-spam and the rest of them correctly dedicated as spam.
Table 1: Illustrates How The False Positive And False Negatives Are Calculated
Non-spam spam
Non-spam True Negative(TN) False Positive(FP) spam False Negative (FN) True Positive(TP)
We provide two general testing parameters or function measurement that are commonly used in spam detection as following see Eq2, 3,4&5:
Accuracy rate TP TN
TP TN FP FN∗ 100 2
Error rate FP FN
TP TN FP FN∗ 100 3
FP FP
FP TP∗ 100 4
FN FN
FN TN∗ 100 5
5.1 Experimental Results and Analysis
[image:7.612.324.518.302.406.2]These sections discuss the result. Figure 6 illustrates the gain charts for accuracy results of the SVM before using K-means clustering. Classification using SVM for testing is at its best 96.30% accurate. Gain chart with baseline, best line is ($Best-SVM) and the result of SVM before improvement is ($S- SVM).
Table 2 below a show the results of the experiment for accuracy, false positive (FP) and time-cost using SVM. The correct classification using SVM for testing is 96.30% of accuracy, the wrong classification is 3.70% for testing, false positive rate is 0.06% and the time-cost is 169.42 second CPU time.
Table 2: Analyse The Accuracy, False Positive And Time Cost Result Of The SVM Before Using
Clustering
Classification False positive
(FP) (%)
Time-cost per second
Correctly Accuracy
(%)
Wrong (%)
SVM 0.06 169.42Sec 96.30 3.70
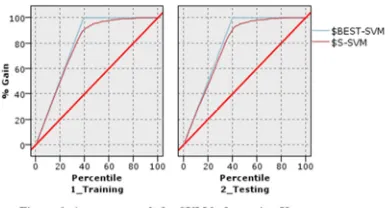
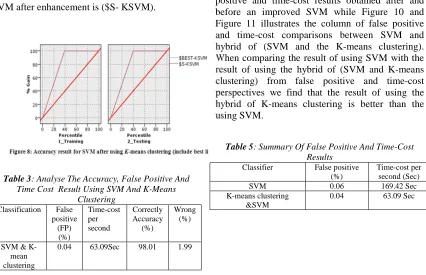
[image:7.612.92.522.551.608.2]575 Figure 8 and table3 illustrates the gain charts for the accuracy, false positive and time-cost results using hybrid between SVM and K-means clustering. To verify the best accuracy it must turn result equivalent to the blue line. The result after using hybrid of SVM and K-means clustering is verifying the best line that is equivalent to the blue line. Classification using hybrid between SVM and K-means clustering for testing is at its best 98.01% of accuracy, the wrong classification is 1.99%. for testing, false positive result is 0.04% and the time-cost is 63.09 Second CPU time while SVM for testing is 96.30% of accuracy, the wrong classification is 3.70%, the false positive result is 0.06% and the time-cost is 169.42 Second CPU time. The final results are after using K-Means clustering and SVM improved accuracy, reduce both false positive and time-cost and give the best result. Gains chart with baseline and the result of SVM after enhancement is ($S- KSVM).
Table 3: Analyse The Accuracy, False Positive And
Time Cost Result Using SVM And K-Means Clustering
Classification False positive
(FP) (%)
Time-cost per second
Correctly Accuracy
(%)
Wrong (%)
SVM & K-mean clustering
0.04 63.09Sec 98.01 1.99
[image:8.612.89.293.73.196.2]Table 4 below illustrates the summarized results obtained after and before an improved SVM while Fig.9 show the column of accuracy comparisons between SVM and hybrid of (SVM and K-means clustering). When comparing the result of using SVM with the result of using the hybrid of (SVM and the K-means clustering) from an accuracy perspective we find that the result of using the hybrid of K-means clustering is better than the using SVM.
Table 4: Summary Of Results Obtained
Classifier Accuracy
SVM 96.30
K-means clustering &SVM 98.01
Table 5 below illustrates the summary of false positive and time-cost results obtained after and before an improved SVM while Figure 10 and Figure 11 illustrates the column of false positive and time-cost comparisons between SVM and hybrid of (SVM and the K-means clustering). When comparing the result of using SVM with the result of using the hybrid of (SVM and K-means clustering) from false positive and time-cost perspectives we find that the result of using the hybrid of K-means clustering is better than the using SVM.
Table 5: Summary Of False Positive And Time-Cost
Results
Classifier False positive (%)
Time-cost per second (Sec)
SVM 0.06 169.42 Sec
K-means clustering &SVM
[image:8.612.317.520.223.393.2] [image:8.612.98.524.432.707.2]ISSN: 1992-8645 www.jatit.org E-ISSN: 1817-3195
576 5.2 Compression with others Methods
[image:9.612.94.295.235.344.2]
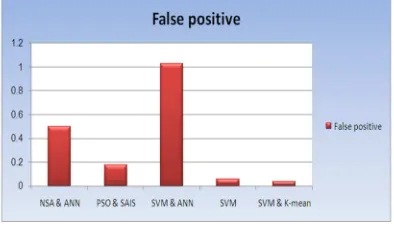
This section showed the results of comparison between several different methods using enhanced spam detection. When comparing the result of different approaches with our result we find our result is better than the different approaches. Table 6 illustrates the summarized results obtained after comparing the result with others method using different methods. Figure 12 and Figure13 present the accuracy and false positive comparisons between different methods using same dataset.
Table 6: Comparisons Between Different Methods Using Same Dataset
Paper authors
Method accuracy training%
accuracy testing%
False positive Idris
(2011)
NSA & ANN 94.30 94.01 0.50
Salehi (2011)
PSO & SAIS 88.33 88.33 0.18
Idris (2012)
SVM & ANN 97.78 97.26 1.03
Before enhanced
SVM 96.12 96.30 0.06
After enhanced
SVM & K-means clustering
98.01 98.01 0.04
[image:9.612.320.517.282.395.2]577 5.3The Contributions of this paper
The final results after using K-means clustering and SVM improved accuracy and reduced both false positive and time-cost and give a better result than others. The advantages and contributions of this paper can be summarized by these points:
• The new spam detection mechanism is based on the combination between the SVM and the K-means clustering techniques which none of the previous studies introduced in e-mail classification. • The combined method achieved better
results in terms of classification accuracy on the spambase standard dataset.
• Our proposed method obtained good results by reducing the spam misclassified compared with current spam detection methods such as Idris (2011) and Salehi (2011).
• Enhancement of accuracy score by combing the K-means clustering method to the SVM and proved that via T-test significance test algorithm.
6. STATISTICAL TESTING
In this study two statistical techniques were used: t-test and correlation coefficient for significance testing for accuracy prospective:
6.1 T-test for significant
T-test is the statistical technique used to select words that are more likely to be spam or non-spam. The formula of the T-test is shown as following:
Z
|X- X...|
/σ²
n σ
²
n
From the formula, X... is the mean of non-spam
mail, X... is the mean of spam mail, σ is the
variance of non-spam mail, σ is the variance of
spam mail,n is the number of non-spam mail and n is the number of spam mail.
From Figure 14, x-axis describes the frequency of each word in each email and y-axis describes the frequency of email that has this word. For example, if we have the frequencies of occurrence of the word “all” in spam and non-spam mail as 10 and 12 respectively, it is likely that the word “all” is not playing as a main feature in characterizing spam mail and non-spam mail. On the other hand, if we get the frequencies equal to 2 and 10 for the word “make” in spam mail and non-spam mail respectively, it is likely that the word “make” is significant in determining spam and non-spam mail. Thus, the word “make” should be selected as one of the features to classify spam mails. T-test statistical technique is the method that can be used to separate non-spam mail and spam mail when the difference between averages of spam and non-spam mail is high and the difference of variance is low. From Fig.14, the left-hand side shows the low that graph has overlap area, so we cannot separate between spam and non-spam emails. The right-hand side of the figure shows the high with high contrast between spam and non-spam mails.
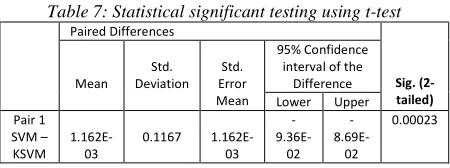
[image:10.612.326.530.43.195.2]In this paper, the Paired-Samples T-test is used to show the significant size of our proposed method before and after improvement. Table 7 shows that our proposed method is statistically significant.
Table 7: Statistical significant testing using t-test
Paired Differences
Sig. (2- tailed)
Mean Std. Deviation
Std. Error Mean
95% Confidence interval of the
Difference Lower Upper Pair 1
SVM – KSVM
1.162E-03
0.1167 1.162E-03
-
9.36E-02 -
8.69E-02
0.00023
[image:10.612.316.541.544.628.2]ISSN: 1992-8645 www.jatit.org E-ISSN: 1817-3195
578 average values for the two variables (SVM, KSVM) are shown in the Paired Samples Statistics in Table 8. Since the Paired Samples T-Test evaluate the means of the two variables, it is expedient to know what the mean values are. A low significance value for the T-test (typically less than 0.05) indicates that there is significance between the two variables. We can see in Table 8, the terms Sig is (0.00023), which shows that our proposed method obtained extremely significant results in SVM and KSVM. In addition, the significance value is high in SVM and KSVM values, and the confidence interval for the mean difference does not contain zero. We can therefore conclude that there is a significant difference between results before and after optimization.
6.2 Correlation Coefficient
Correlation coefficient (CC) is a statistical tool used to study correlations between the set of variables. For example, a CC is used to learn a relationship between two variables, and then the user can take decision on these relationships. Pearson’s, Kendall and Spearman’s correlation coefficients are well known CC types [48]. CC they are descriptive statistical measures that demonstrate the strength or degree of relationship between two or more variables
In this paper, we used the Pearson’s -CC in order to assess the significance of our proposed method. Karl Pearson [49] proposed Pearson’s correlation coefficient. It gauges the linear relationship between two variables, and the relationship is located between -1 and 1. The CC obtains the highest value i.e. +1 if the variable is growing in relationship and on other hand CC obtains -1 if variable is decreasing in relationship.
The Pearson’s correlation coefficient ranges from -1 to +-1 and can calculate using the below formula:
p N ∑ xy ∑ x ∑ y
/N ∑ x ∑ x
N ∑ y ∑ y
Where X is the column result before improvement and y is the column result after improvement In this paper, Pearson’s correlation coefficient is used to show the significance size of our proposed method. Table 8 shows that our proposed method is statistically significant.
Table 8 reflects comparison among original SVM and our improved SVM algorithm. According to table 8 result SVM is improved because the
correlation coefficient result is less than 0.01 values hence it is significant.
7. CONCLUSIONS AND FUTURE WORK
This paper proposed a new mechanism using a hybrid of the K-means clustering and SVM for spam detection. In general, the proposed mechanism offers the following advantages such as improved classification accuracy and reduces the false positive and time-cost. The classification accuracies are 98.01% , false positive is 0.04% and time-cost is 63.09 second .The result of a new mechanism using a hybrid of (K-means clustering and SVM) was compared with spam detection using SVM only, it gives better classification accuracy, false positive , requires much shorter training time and enhanced SVM algorithm. The adopted methods for ranking the 57 attributes to determine the most effective spam predictors, such as T-Test statistic measure of the significance of the difference between two means of each attribute for the spam and non-spam subsets of the data. Performance was compared with difference methods namely artificial neural networks and negative selection algorithm classifiers reported in the literature. The above comparison with different methods indicates that the new mechanism using hybrid of (K-means clustering and SVM) provides better classification accuracy, false positive and time-cost. For future work we try to implement differential evolution and opposition-based learning as feature selection.
ACKNOWLEDGEMENT
[image:11.612.307.528.113.278.2]This work was financially supported in part by IDF in Universiti Teknologi Malaysia. The authors would like to thank the Research Management Table 8: Statistical Significant Testing Using Correlation
Coefficient
Correlations Coefficient
SVM FSSVM
SVM Pearson Correlation
Sig. (2- tailed)
N
1.000 0 4600
0.118 0.00 4600
KSVM Pearson Correlation
Sig. (2- tailed)
N
0.118 0.00 4600
1.000 0 4600
579 Centre (RMC) Universiti Teknologi Malaysia and Algraf Technical College-Sudan for their supports. REFERENCES:-
[1]. Appavu, S., et al., Data mining based
intelligent analysis of threatening e-mail.
Knowledge-Based Systems, 2009. 22(5): p. 392-393.
[2]. Sadan, Z. and D.G. Schwartz, Social network
analysis of web links to eliminate false positives in collaborative anti-spam systems.
Journal of Network and Computer Applications, 2011. 34(5): p. 1717-1723. [3]. Chhabra, P., R. Wadhvani, and S. Shukla,
Spam Filtering using Support Vector Machine. 2010.
[4]. ZHANG, Q., et al., Fuzzy Clustering based on
Semantic Body and its Application in Chinese Spam Filtering. JDCTA: International Journal
of Digital Content Technology and its Applications, 2011. 5(4): p. 1-11.
[5]. Naksomboon, S., C. Charnsripinyo, and N. Wattanapongsakorn. Considering behavior of
sender in spam mail detection. in Networked Computing (INC), 2010 6th International Conference on. 2010.
[6]. Mohammad, A.H. and R.A. Zitar, Application
of genetic optimized artificial immune system and neural networks in spam detection.
Applied Soft Computing, 2011. 11(4): p. 3827-3845.
[7]. Youn, S. and D. McLeod, A comparative
study for email classification. Advances and
Innovations in Systems, Computing Sciences and Software Engineering, 2007: p. 387-391. [8]. Radicati, S. and M. Khmartseva, Email
statistics report, 2009-2013. May). Radicati
Group. www. radicati. com/wp/wp- content/uploads/2009/05/email-stats-report-exec-summary. pdf (accessed Mar. 5, 2010), 2009.
[9]. Yu, B. and Z. Xu, A comparative study for
content-based dynamic spam classification using four machine learning algorithms.
Knowledge-Based Systems, 2008. 21(4): p. 355-362.
[10]. Guzella, T.S. and W.M. Caminhas, A review
of machine learning approaches to Spam filtering. Expert Systems with Applications,
2009. 36(7): p. 10206-10222.
[11]. Lai, C.-C., An empirical study of three
machine learning methods for spam filtering.
Knowledge-Based Systems, 2007. 20(3): p. 249-254.
[12]. El-Alfy, E.-S.M. and R.E. Abdel-Aal, Using
GMDH-based networks for improved spam detection and email feature analysis. Applied
Soft Computing, 2011. 11(1): p. 477-488. [13]. Lai, C.C. and C.H. Wu. Particle swarm
optimization-aided feature selection for spam email classification. 2007: IEEE.
[14]. Yu, B. and Z.-b. Xu, A comparative study for
content-based dynamic spam classification using four machine learning algorithms.
Knowledge-Based Systems, 2008. 21(4): p. 355-362.
[15]. Saad, O., A. Darwish, and R. Faraj, A survey
of machine learning techniques for Spam filtering. IJCSNS, 2012. 12(2): p. 66.
[16]. Idris, I., Model and Algorithm in Artificial
Immune System for Spam Detection.
International Journal, 2012. 3.
[17]. Attri, U. and H. Kaur, Comparative Study of
Gaussian and Nearest Mean Classifiers for Filtering Spam E-mails. International Journal
of Computer Science & Applications (TIJCSA), 2012. 1(3).
[18]. ISMAILA IDRIS, A.S., Optimized spam
classification approach with negative selection algorithm Journal of Theoretical and
Applied Information Technology 2012. Vol. 39 (No.1 ): p. 22-31.
[19]. Fagbola Temitayo, O.S., digun Abimbola
Hybrid GA-SVM for Efficient Feature Selection in E-mail Classification Computer
Engineering and Intelligent Systems 2012. Vol 3, No.3, 2012(No.3,): p. 17-28.
[20]. Pérez-Díaz, N., et al., Rough sets for spam
filtering: Selecting appropriate decision rules for boundary e-mail classification. Applied
Soft Computing, 2012. 12(11): p. 3671-3682. [21]. Salehi, S. and A. Selamat. Hybrid simple
artificial immune system (SAIS) and particle swarm optimization (PSO) for spam detection.
2011: IEEE.
[22]. Unler, A. and A. Murat, A discrete particle
swarm optimization method for feature selection in binary classification problems.
European Journal of Operational Research, 2010. 206(3): p. 528-539.
[23]. Sun, J., et al., Analysis of the distance
between two classes for tuning SVM hyperparameters. Neural Networks, IEEE
Transactions on, 2010. 21(2): p. 305-318. [24]. Morariu, D., L. Vintan, and V. Tresp.
Evolutionary feature selection for text documents using the SVM. 2006.
[25]. Golovko, V., et al., Neural network and
ISSN: 1992-8645 www.jatit.org E-ISSN: 1817-3195
580
network intrusion detection. Advances in
Machine Learning II, 2010: p. 485-513. [26]. Ma, W., D. Tran, and D. Sharma. A novel
spam email detection system based on negative selection. 2009: IEEE.
[27]. Wu, X., et al., Top 10 algorithms in data
mining. Knowledge and Information Systems,
2008. 14(1): p. 1-37.
[28]. Salcedo-Campos, F., J. Díaz-Verdejo, and P. García-Teodoro, Segmental parameterisation
and statistical modelling of e-mail headers for spam detection. Information Sciences, 2012.
195(0): p. 45-61.
[29]. Vinther, M., Intelligent junk mail detection
using neural networks. URL: http://www.
logicnet. dk/reports/JunkDetection/Jun kDetection. pdf, 2002.
[30]. Lee, S.M., et al. Spam Detection Using
Feature Selection and Parameters Optimization. 2010: IEEE.
[31]. Idris, I., E-mail Spam Classification With
Artificial Neural Network and Negative Selection Algorithm. International Journal of
Computer Science, 2011. 1.
[32]. Ying, K.-C., et al., An ensemble approach
applied to classify spam e-mails. Expert
Systems with Applications, 2010. 37(3): p. 2197-2201.
[33]. Yin, H., F. Cheng, and D. Zhang. Using LDA
and Ant Colony Algorithm for Spam Mail Filtering. 2009: IEEE.
[34]. DeBarr, D. and H. Wechsler. Spam Detection
using Clustering, Random Forests, and Active Learning. 2009.
[35]. Long, X., W.L. Cleveland, and Y.L. Yao,
Methods and systems for identifying and localizing objects based on features of the objects that are mapped to a vector. 2011,
Google Patents.
[36]. Noble, W.S., What is a support vector
machine? Nature biotechnology, 2006. 24(12): p. 1565-1567.
[37]. Ji, Z. and D. Dasgupata. Augmented negative
selection algorithm with variable-coverage detectors. 2004: IEEE.
[38]. Wang, L., Support Vector Machines: theory
and applications. Vol. 177. 2005: Springer
Verlag.
[39]. Xiao-li, C., et al. A method of spam filtering
based on weighted support vector machines.
2009: IEEE.
[40]. Marsono, M.N., Towards Improving E-mail
Content Classification for Spam Control: Architecture, Abstraction, and Strategies.
PhD Thesis -University of Victoria, 2007.
[41]. Jin, Q. and M. Ming. A method to construct
self set for IDS based on negative selection algorithm. 2011: IEEE.
[42]. Rao, I.K.R. Data mining and clustering
techniques. 2003.
[43]. Raskar, S.S. and D. Thakore, Text Mining and
Clustering Analysis. IJCSNS, 2011. 11(6): p.
203.
[44]. Münz, G., S. Li, and G. Carle. Traffic
anomaly detection using k-means clustering.
2007.
[45]. MacQueen, J. Some methods for classification
and analysis of multivariate observations.
1967: California, USA.
[46]. Torres, G.J., et al., A Similarity Measure for
Clustering and its Applications. Int. J. of
Electrical, Computer, and Systems Engineering, 2009. 3(3).
[47]. Mark Hopkins , E.R., George Forman and Jaap Suermondt, Spambase Dataset.
ftp://ftp.ics.uci.edu/pub/machine-learningdatabases/spambase/.
[48]. MOHAMMED M MAZID, A.B.M.S.A., KEVIN S TICKLE Improved C4.5 Algorithm
for Rule Based Classification RECENT
ADVANCES in ARTIFICIAL INTELLIGENCE, KNOWLEDGE ENGINEERING and DATA BASES, 2010. [49]. Pearson, K., Notes on the history of
correlation. Biometrika, 1920. 13(1): p.