COMBINING THE METHODS OF FORECASTING AND
DECISION-MAKING TO OPTIMISE THE FINANCIAL
PERFORMANCE OF SMALL ENTERPRISES
JULIA IGOREVNA LARIONOVA 1
ANNA NIKOLAEVNA TIKHOMIROVA 2 1, 2
The National Nuclear Research University MEPHI (Moscow Engineering Physics Institute)
E-mail: [email protected], 2 [email protected]
ABSTRACT
Fluctuations in financial flows of small manufacturing enterprises often have a certain periodicity, which is associated with the specific production of a particular type of product. The need to take into account this fact determines whether a company has enough competent staff to make informed decisions about the goods production policy. In this regard, the promising areas for financial analysts within such enterprises are the processes of forecasting and decision-making. This article describes the existing prediction algorithms, suitable for use on a consolidated source of data. Particular attention is paid to the methods of decision-making, allowing for the existing knowledge of experts to form the solutions, based solely on the logic component. According to the considered methods agreed on the desirability of the use of joint forecasting techniques and methods of decision-making to optimise financial performance of a particular company as well as a group of companies close to it in terms of key financial and economic indicators.
Keywords: Financial Forecasting, Holt-Winters Method, Method Of Hierarchy Analysis, Small Manufacturing Business.
1. INTRODUCTION
The effectiveness of organisations in a market economy to a fairly large extent depends on prediction, namely on the ability of company analysts to foresee the future development of the company. The relevance of such predictions is high during periods of economic instability, since many companies who do not manage to react to changes in the environment experience a decline in the whole set of economic indicators. That is why the most relevant particular issues are mathematical forecasting models capable of taking into account the values of the preceding parameters and adapting quickly enough to the current situation in the market.
No less important is the problem of decision-making. Often a variety of economic, administrative and other problems have multiple solutions. Thus, choosing one alternative from the set, the leader bases his decision only on the intuitive idea, so the decision is often unfounded. To ensure the necessary accuracy of decisions there are different special formal models that allow the clustering and rating of data available through the involvement of
Thus, forecasting and decision-making procedures are of great practical importance in the life of the enterprise, allowing changes in the basic indicators of financial performance to be tracked and decisions formed based on this information with the help of formal models.
The study importance and urgency is explained by the lowering enterprise profits against the unfavorable economic situation in the country. Therefore, as one of the possible indirect ways to increase the loyalty and customers’ commitment it is justified to carry out the research on the application of mathematical models to specify the firm management on the changes dynamics to make appropriate decisions. The novelty of the research consists in combination and usage of forecasting and decision-making methods.
Journal of Theoretical and Applied Information Technology 20th March 2015. Vol.73 No.2
© 2005 - 2015 JATIT & LLS. All rights reserved.
ISSN: 1992-8645 www.jatit.org E-ISSN: 1817-3195
allowing optimisation of the company’s financial activities.
2. FORECASTING TIME SERIES
Forecasting methods allow a measure of the influence of individual patterns and causes of development to be defined, perceiving the object of the forecast as a dynamic measurement system with a certain degree of fairness of real phenomena, factors and forces of social activity interactions. Thereby the system allows simulation of the behavior of the system in the future with a certain degree of probability.
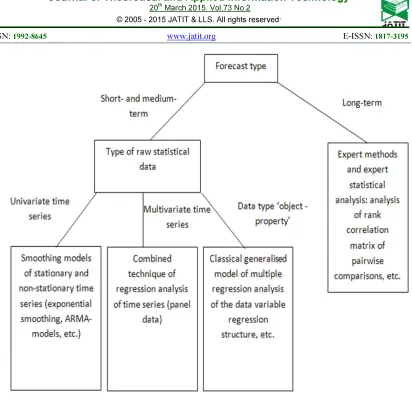
Currently, scientists estimate that there are more than 150 different forecasting methods. However, in practice only 15 - 20 basic techniques are used [1]. Existing sources present different classification principles of forecasting methods. General methods of prediction can be divided into groups presented in Figure 1 [2].
Given the variability of economic and political situations, as well as possible changes in the policy of the enterprise itself, the most suitable types of forecasts are based on the temporal characteristics and are short-term, covering a limited period.
In this case, under this period we consider the time of 1-2 years, because during this time the most detailed database has been accumulated allowing manipulating the data in the automatic mode.
In addition, the choice of model type affects the amount of data being analysed: to determine the predictive values of small businesses it is often sufficient to collect relatively small data samples.
As this study examines the predictive values of common indicators such as, for example, the volume of sales and profits of the enterprise, the time series are one-dimensional.
Thus, a method of time series prediction, capable of producing short-term forecasts on a relatively small sample of one-dimensional data must be chosen. Among all the others, the most suitable methods according to the criteria identified belong to the class of extrapolation forecasting methods. The existing methods and their variations will be examined in order to select the most appropriate method.
Moving average is a way to even out price fluctuations over time. In other words, the moving average calculates the average value of the
parameter for a certain period of time and is, in fact, a trend indicator. It is used to keep track of the start of a new trend and the completion of the current one, and the angle of inclination can point out the strength of the trend. Its construction is a simple calculation of the arithmetic mean (1.1):
S = ∑ܖܑసܑ
, (1.1)
where Pi – price, N –moving average period.
The main disadvantage of this method is that the calculation is based on data over a fixed period of time, and each value in the history of prices is given the same importance.
In this regard, the method of exponential smoothing (Brown method) was chosen for further consideration. Unlike the method of moving averages it is reasonably balanced and takes into account the history of smoothed current levels of the time series [3]. One of the main features of this method is that to calculate the smoothed values of the level St, one needs to know the previous smoothed value of St–1, and the actual value of the time series уt.
The exact formula of simple exponential smoothing has the form (1.2):
(1.2)
When this formula is applied recursively, each new smoothed value (which is also a forecast) is calculated as a weighted average of the current observation and the smoothed series. Obviously, the result depends on the smoothing parameter [alpha]. If [alpha] is 1, the previous observations are completely ignored. If [alpha] is 0, the current observations are ignored. The values of [alpha] between 0 and 1 give the intermediate results. This allows suppression of the vibrations and noise of the original series.
However, this method also has a disadvantage: the model does not consider trends and seasonal components.
An advanced simple exponential smoothing method is the method of Holt, which allows the trend component to be taken into account [4].
Figure 1: Classification of forecasting methods.
, (1.3)
, (1.4)
, (1.5)
where
Lt denotes the level of the time series and is used to simulate the trend and bt denotes the trend.
Here, the equation (1.3) describes the smoothed series overall, the equation (1.4) is used to assess the trend and the equation (1.5) determines the forecast for m samples in time to come.
The level of series is adjusted directly with the trend of the previous period bt–1 by adding it to the last level.
Then the trend itself is adjusted as the difference between the last two values of the time series. The forecast is generated by adding the trend to the last
However, this model still does not allow the seasonality inherent in a wide range of products, including products produced in the target company, to be taken into account.
An improved predictive method was created based on the method of Holt Winters [5]. It allows the seasonal component to be taken into account. Thus, an adaptive multiplicative Holt-Winters model [6], with extended limits of applicability allowing the trend and seasonal component to be taken into account, was used in this study. It has the following form:
,
(1.6)
where
Yp(t + k) – predictions made by k steps forward,
a(t) – level series factor,
Journal of Theoretical and Applied Information Technology 20th March 2015. Vol.73 No.2
© 2005 - 2015 JATIT & LLS. All rights reserved.
ISSN: 1992-8645 www.jatit.org E-ISSN: 1817-3195
F(t + k – L) – seasonal component with a lag of s + k steps,
L – seasonal period.
The coefficients a(t), b(t) and F(t) adapt as we move from series members with the number t – 1 to the number of members with the number t.
Thus, the method of Holt-Winters was reasonably chosen from existing extrapolation forecast methods that meet the requirements of the particular situation at the plant. The refinement of the model’s coefficients is carried out according to formulae (1.7) - (1.9):
⁄
, (1.7)
, (1.8)
⁄ , (1.9)
where [alpha1], [alpha2], [alpha3] are smoothing constants.
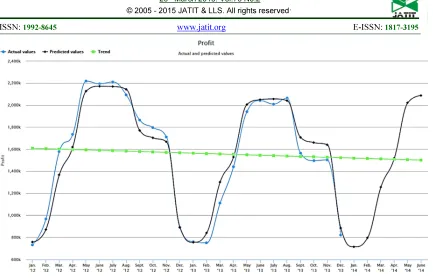
Figure 2: Graph of actual and predicted values of the company’s profit.
3. DECISION-MAKING METHODS BASED
ON EXPERT JUDGMENT
It is worth noting that for the period 2012-2013 the target company experienced a steady decline in sales volumes and, on the basis of the predicted values in the future, the situation may worsen. This can be caused by various factors, in particular, the emergence and development of competitive firms. One way to impact the demand, which the company is able to realise in a short time, is launching an advertising campaign, initiated and funded by the company’s management.
Globally, the choice of method to achieve the goal of increasing demand can be interpreted as a problem of decision-making under uncertainty. Conditions of uncertainty refer to the phenomenon where the original information is incomplete, inaccurate, non-quantitative, and the type of formal display is either too complex or not known. The investigated case can be defined as being under conditions of uncertainty, as an expert assessment of the impact of the advertising activities is intuitive and has no formal representation [7].
This class of decision-making theory is the most difficult one among other management tasks. Standard mathematical optimisation methods are widely used to solve these problems, but the heuristic prediction still has its significance, because in some areas it can be difficult, and
sometimes impossible, to construct a mathematical model of the phenomenon under study.
Decision-making problems are characterised by their variety and can be classified according to various criteria, like quantity and quality of information available. In general, the task of decision-making can be represented by the following set of information (2.1):
<Т, A, К, X, F, G, D> (2.1)
where
Т – statement of the problem (for example, to select the best alternative or streamline the entire set); А – the set of feasible alternatives;
К – set of criteria for selection;
Х – set of methods for measuring preferences (for example, use of different scales);
F – mapping of the reasonable alternatives to the set of criteria estimates (based on);
G – system of expert’s preferences;
D – decision rule, which reflects the system of preferences.
Any of the elements of this set can serve as a classification criterion for decision-making [8].
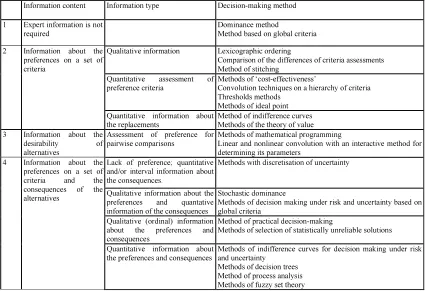
Traditionally, decision-making methods can be classified as shown in Table 1 [9].
Journal of Theoretical and Applied Information Technology
20th March 2015. Vol.73 No.2
© 2005 - 2015 JATIT & LLS. All rights reserved.
ISSN: 1992-8645 www.jatit.org E-ISSN: 1817-3195
under certainty, and the fourth refers to decision-making under conditions of uncertainty [10]. Those methods that allow multicriteriality and uncertainty to be taken into account are of the greatest interest among the variety of methods and approaches to decision-making, as well as methods allowing the selection of decisions pertaining to sets of alternatives in the presence of various types of criteria, with different types of measurement scales (these methods belong to the fourth group).
In turn, among the methods forming the fourth group, the most promising as a whole and within the framework of the current task in particular, are the methods of analytic hierarchy process and fuzzy set theory. This choice is based on the fact that
these methods meet the requirements of
universality, and allow multicriteria choices to be made in conditions of uncertainty concerning discrete or continuous set of alternatives, as well as ease of preparation and processing of expert information.
In general, the current problem of determining the best course of an advertising campaign can be formalised as a set of alternatives, decision criteria
and target selection function. In this case, the decision criteria are characterised by a certain degree of priority and, therefore, there is no need for the formation of sets of fuzzy numbers as the initial conditions. The basic method of decision-making in this study is the method of hierarchy analysis.
The basic idea of the method is to deconstruct the problem into simpler parts and components and the further processing of sequence judgment of the decision maker, based on pairwise comparisons. The main purpose of the study and all of the factors that in varying degrees influence the achievement of goals can be divided by levels depending on the extent and nature of the impact [11].
[image:6.595.87.512.432.723.2]The first level of the hierarchy always has one vertex which is the purpose of the study. The second level of the hierarchy are criteria that directly affect the achievement of the goal. In addition, each criterion is represented in the target hierarchy of vertices connected with the top of the first level. The third level consists of the criteria on which the top of the second level depends. And so on. The last level is usually taken by alternatives.
Table 1 – Classification of decision-making methods.
Information content Information type Decision-making method
1 Expert information is not required
Dominance method
Method based on global criteria 2 Information about the
preferences on a set of criteria
Qualitative information Lexicographic ordering
Comparison of the differences of criteria assessments Method of stitching
Quantitative assessment of preference criteria
Methods of ‘cost-effectiveness’
Convolution techniques on a hierarchy of criteria Thresholds methods
Methods of ideal point Quantitative information about
the replacements
Method of indifference curves Methods of the theory of value 3 Information about the
desirability of alternatives
Assessment of preference for pairwise comparisons
Methods of mathematical programming
Linear and nonlinear convolution with an interactive method for determining its parameters
4 Information about the preferences on a set of criteria and the consequences of the alternatives
Lack of preference; quantitative and/or interval information about the consequences.
Methods with discretisation of uncertainty
Qualitative information about the preferences and quantative information of the consequences
Stochastic dominance
Methods of decision making under risk and uncertainty based on global criteria
Qualitative (ordinal) information about the preferences and consequences
Method of practical decision-making
Methods of selection of statistically unreliable solutions Quantitative information about
the preferences and consequences
Methods of indifference curves for decision making under risk and uncertainty
Thus, the implementation of the method of hierarchy analysis results in the consistent implementation of the following stages:
− formulation of objectives, selection criteria
and alternatives;
− construction of a tree of the problem’s
hierarchy;
− identification of relative importance; − calculation of the vector of priorities; − identifying the consistency of priorities;
− correction of judgments;
− hierarchical synthesis.
The following tree hierarchy, shown in Figure 3, was built as a result of analysis of advertising policy options for enterprise
.
[image:7.595.94.502.262.398.2]
Omitting the details of the implementation of the method, it is worth noting that, based on the calculation of the vector of priorities, the most successful alternative was recognised to be the site development.
Figure 3: The tree of hierarchies.
4. CONCLUSIONS
According to the results of domain analysis and format of the original data, on the example of a single small industrial enterprise, it was proved that methods of extrapolation forecasting are the most suitable model for forecasting univariate time series in the short term, which are the basic financial indicators such as income, sales, and others. In the process of comparing the existing prediction methods of the specified class such methods as moving average, the method of Brown, Holt’s method, and finally, the method of Holt-Winters were each considered. In the study, it was demonstrated that of all these methods, in this particular case the method of Holt-Winters is most suitable, because it gives a relatively accurate prediction for a short period of time, based on the previous values of the time series, taking into account both the trend and seasonality. It also confirms the average error for these three months, which amounted to 5.07%; this also characterises the accuracy of the model as high.
A model from the class of decision-making was chosen as a second component from the overall subsystem forecasting. Given the expert opinion of
competent staff, it was decided to use the method of hierarchy analysis due to the nature of input data.
Its value in this case is the lack of need for special processing of the expert evaluations, which distinguishes it from other models of this designation.
Summing up, it is worth noting that in a modern market economy, the functioning of a small manufacturing company operating in a narrow professional field requires additional information and analytical support. In most cases the use of software already existing on the market to conduct a full-fledged financial analysis proves unprofitable because of its high cost and the complexity of adaptating such software to the specific needs of the company. The most cost-effective solution is the application of modified mathematical models in the development of unique software components that provide analytical support and decision support in the process of financial and production activity.
Journal of Theoretical and Applied Information Technology
20th March 2015. Vol.73 No.2
© 2005 - 2015 JATIT & LLS. All rights reserved.
ISSN: 1992-8645 www.jatit.org E-ISSN: 1817-3195
Based on the foregoing, it is worth noting that although the implementation of the investigated techniques now helps the company management to make informed and reasoned decisions, but the model still takes into account not all relevant parameters. This feature is due to the limitations of the subject area as a partial or complete absence of large amounts of digit data makes it difficult to use advanced techniques. However, considering the gradual automation and electronic tracking of many industrial and economic processes in the future it is planned to create very large amounts of detailed information and, as a consequence, the use of more sophisticated forecasting models. In particular, it will be reviewed and adapted to the task model using neural networks for time series prediction. In addition to forecasting, it will carry out analysis of other existing methods of decision-making that does not require time-consuming processing of raw data and are able to form more visible results.
REFRENCES:
[1] Mathematical Office [electronic resource] AM:
2009-2012. Mode of access:
http://www.mbureau.ru/blog/klassifikaciya-metodov-prognozirovaniya-po-gromovym, free. Caps. from the screen.
[2] The scientific journal KubGAU [electronic
resource] M.: 2003-2012. - Mode of access: http://ej.kubagro.ru/2005/06/14/, free. Caps. from the screen.
[3] Lukashin, Y. P., ‘Adaptive methods of short-term time series forecasting’. Finance and Statistics, 2003.
[4] Holt, C. C. ‘Forecasting trends and seasonals by exponentially weighted moving averages’.
ONR Memorandum, Carnegie Inst. of
Technology. 1957. № 2.
[5] 5. Time series analysis of financial indicators in the model of Holt-Winters [electronic resource] Semenenko M.G. Electronic data.
Moscow: 2006.Access:
http://mas.exponenta.ru/literature/Semenenko.p df, free. Caps. from the screen.
[6] Winters, P. R. ‘Forecasting sales by
exponentially weighted moving averages’. Management Science. 1960. Vol. 6. №3. [7] Blyumin, S. L., Shuykova, I. A. ‘Models and
methods of decision making under
uncertainty’. Lipetsk: LEGI, 2001 p. 138. [8] Saaty, T. L. (2008-06). ‘Relative Measurement
and its Generalization in Decision Making: Why Pairwise Comparisons are Central in
Mathematics for the Measurement of
Intangible Factors – The Analytic
Hierarchy/Network Process’. RACSAM
(Review of the Royal Spanish Academy of Sciences, Series A, Mathematics) 102 (2): pp. 251-318.
[9] Planning decisions in the economy [electronic resource] AM: 2009-2012. Mode of access:
http://www.ecosyn.ru/page0009.html, free.
Caps. from the screen.
[10] Decision-making under uncertainty [electronic
resource] M: 2014 Mode of access:
http://www.elitarium.ru/2010/06/29/prinjatie_r
eshenijj_neopredelennost.html, free. Caps.
from the screen.
[11]Tikhomirova, A. N., Sidorenko, E. V.