ORIGINAL RESEARCH
ADULT BRAIN
A Diffusion Tensor Imaging Study on White Matter
Abnormalities in Patients with Type 2 Diabetes Using
Tract-Based Spatial Statistics
X Y. Xiong, XY. Sui, XZ. Xu, XQ. Zhang, XM.M. Karaman, XK. Cai, XT.M. Anderson, XW. Zhu,X J. Wang, and XX.J. ZhouABSTRACT
BACKGROUND AND PURPOSE: Patients with type 2 diabetes mellitus have considerably higher risk of developing cognitive impairment and dementia. WM changes in these patients have been reported. Our aim was to demonstrate that gradual and continuous WM change and the associated cognitive decline in patients with type 2 diabetes mellitus can be captured by DTI parameters, which can be used to complement neuropsychological test scores in identifying patients with type 2 diabetes mellitus with and without mild cognitive impairment.
MATERIALS AND METHODS: Forty-two patients with type 2 diabetes mellitus, divided into a group with mild cognitive impairment (n⫽ 20) and a group with normal cognition (n⫽22), were enrolled with age-, sex-, and education-matched healthy controls (n⫽26). 3T DTI followed by Tract-Based Spatial Statistics analysis was used to investigate the differences in fractional anisotropy, mean diffusivity, axial diffusivity (1), and radial diffusivity (23) among the groups. A receiver operating characteristic analysis assessed the performance of DTI parameters for separating the 2 groups with type 2 diabetes mellitus.
RESULTS:The whole-brain Tract-Based Spatial Statistics analysis revealed that 7.3% and 24.9% of the WM exhibited decreased fractional anisotropy and increased mean diffusivity (P⬍.05), respectively, between the diabetes mellitus with mild cognitive impairment and the diabetes mellitus with normal cognition groups, while considerably larger WM regions showed fractional anisotropy (36.6%) and mean diffusivity (58.8%) changes between the diabetes mellitus with mild cognitive impairment and the healthy control groups. These changes were caused primarily by an elevated radial diffusivity observed in the patients with diabetes mellitus with mild cognitive impairment. Radial diffusivity also exhibited subtle but statistically significant changes between the diabetes mellitus with normal cognition and the healthy control groups. Analyses on individual fiber tracts showed pronounced fractional anisotropy reduction and mean diffusivity elevation in regions related to cognitive functions. The receiver operating characteristic analysis on the right cingulum (hippocampus) showed that fractional anisotropy produced a larger area under the curve (0.832) than mean diffusivity (0.753) for separating mild cognitive impairment from normal cognition among patients with type 2 diabetes mellitus. When fractional anisotropy was combined with mean diffusivity, the area under the curve was further improved to 0.857.
CONCLUSIONS: DTI parameters can show a substantial difference between patients with type 2 diabetes mellitus with and without mild cognitive impairment, suggesting their potential use as an imaging marker for detecting cognitive decline in patients with type 2 diabetes mellitus. More important, DTI parameters may capture gradual and continuous WM changes that can be associated with early stages of cognitive decline in patients with type 2 diabetes mellitus before they can be diagnosed clinically by using conventional neuropsychological tests.
ABBREVIATIONS:DM-MCI⫽diabetes mellitus with mild cognitive impairment; DM-NCⴝdiabetes mellitus with normal cognition; FA⫽fractional anisotropy; HC⫽healthy control; MCI⫽mild cognitive impairment; MD⫽mean diffusivity; TBSS⫽Tract-Based Spatial Statistics; T2DM⫽type 2 diabetes mellitus; ROC⫽receiver operating characteristic
T
ype 2 diabetes mellitus (T2DM) is a prevalent disease that affects⬎360 million people worldwide and is projected to rise to 552 million cases by 2030.1This metabolic disease can affect a number of
organs, including the brain, eye, kidney, heart, vasculature, and pe-ripheral nerves due to long-term sustained hyperglycemia. Brain damage caused by diabetes has attracted increased attention during
Received July 14, 2015; accepted after revision January 7, 2016.
From the Departments of Radiology (Y.X., W.Z.) and Neurology (Q.Z.), Tongji Hospital, and Department of Pathophysiology (Z.X., J.W.), Tongji Medical College, Huazhong University of Science and Technology, Wuhan, China; and Center for Magnetic Resonance Research (Y.X., Y.S., M.M.K., K.C., X.J.Z.) and Departments of Radiology (K.C., T.M.A., X.J.Z.), Bioengineering (Y.S., X.J.Z.), and Neurosurgery (X.J.Z.), University of Illinois Hospital and Health Sciences System, Chicago, Illinois. This work was supported, in part, by the National Natural Science Foundation of China (grant Nos. 81171308 and 81471230), the National Program of the Ministry of Science and Technology of China during the “12th Five-Year Plan” (grant No. 2011BAI08B10), and the US National Institutes of Health (grant No. 1S10RR028898).
Paper previously presented in part at: Annual Meeting of the International Society for Magnetic Resonance in Medicine, May 30 –June 5, 2015; Toronto, Ontario, Canada. Please address correspondence to X. Joe Zhou, PhD, Advanced Imaging Center, Ste 103, 2242 W Harrison St, Chicago, IL 60612; e-mail: [email protected]; Jianzhi Wang, PhD, Department of Pathophysiology, Tongji Medical College, Huazhong University of Sci-ence and Technology, 13 Hangkong Rd, 430030, Wuhan, P.R. China; e-mail: [email protected]
Indicates open access to non-subscribers at www.ajnr.org Indicates article with supplemental on-line table.
Indicates article with supplemental on-line photos.
recent years. Longitudinal population-based studies have revealed that the relative risk of dementia is 1.2–2.8 times higher in individuals with diabetes relative to those without.2,3
Although neuropsychological tests such as the Mini-Mental State Examination and the Montreal Cognitive Assessment re-main the prevailing methods for evaluating patients with T2DM with and without cognitive decline, a number of neuroimaging studies have emerged to investigate the compromised brain func-tions of patients with T2DM by measuring changes in perfusion,4 metabolism,5 spontaneous brain activity at resting state,6 and functional connectivity.7The observed functional changes have been associated with sustained hyperglycemia and the resulting alterations in cerebral vasculature, neurotrophic factors, and neu-rotransmitters.8To study the underlying brain structural changes associated with the functional and metabolic abnormalities, Zhang et al9compared the gray matter volume of patients with T2DM with and without mild cognitive impairment (MCI) and concluded that middle temporal gyrus atrophy was associated with an increased risk of MCI in patients with T2DM. Cerebral atrophy and WM hyperintensities were also reported in patients with T2DM10and were linked to compromised cognition.11 Ad-ditionally, recent studies focusing on type 1 diabetes mellitus re-vealed WM changes in the superior parietal lobule12and more pronounced WM hyperintensities in patients with slower infor-mation processing.13The observed changes in WM are of partic-ular interest, given its important role as a conduit to transmit neuronal signals to the functional units in the gray matter.
DTI is a powerful neuroimaging method to study WM struc-tural changes in many neurologic disorders, including MCI and Alzheimer disease.14In a study by Hsu et al,15decreased fractional anisotropy (FA) was found in the frontal lobe of patients with T2DM with both global and voxel-based analyses. Decreased FA in the cingulum bundle and uncinate fasciculus,16and increased mean diffusivity (MD) in the bilateral hemisphere tracts,17were also reported. Recently, Zhang et al18observed that patients with T2DM with various degrees of cognitive impairment exhibited widespread WM disruptions, which correlated well with execu-tive dysfunction.
Although the risk of developing cognitive impairment is con-siderably elevated among patients with T2DM, not all patients with T2DM develop cognitive impairment based on neuropsy-chological tests. This raises an interesting and important question of whether the observed WM change occurs only in patients with T2DM with cognitive impairment or in all patients with T2DM. We hypothesize that the WM change in patients with T2DM, in accordance with cognitive decline, is a gradual and continuous process that may not be adequately reflected by neuropsycholog-ical test scores but can be captured by DTI. The present study, therefore, aimed to test this hypothesis by subdividing the pa-tients with T2DM into 2 groups, those exhibiting MCI and those without, and investigating their DTI parameter changes against a third group of age-, sex-, and education-matched healthy sub-jects. Additionally, the study also intended to demonstrate that DTI parameters can be used quantitatively to complement neu-ropsychological test scores in characterizing patients with T2DM with and without MCI.
MATERIALS AND METHODS
SubjectsWith approval by the institutional review board, we used a pro-spective cross-sectional study design with a recruitment of 70 right-handed adult subjects who provided written informed con-sent. Among the subjects, 44 were patients with T2DM (between 51 and 72 years of age; 27 women) recruited from the endocrinol-ogy clinic of Tongji Hospital of China between May 2013 and May 2014. Detailed information about hypoglycemic agent applica-tion, family history, and clinical symptoms and complications was collected. Clinical examinations and laboratory tests, includ-ing blood biochemistry; lipids and cholesterol levels; plasma glu-cose and glycosylated hemoglobin A1c levels; and body mass in-dex, were performed.
Diagnosis of T2DM was based on established criteria (ie, dia-betes symptoms and a fasting plasma glucose level of ⬎7.0 mmol/L or a random plasma glucose level of⬎11.1 mmol/L or a 2-hour glucose level of⬎11.1 mmol/L after an oral glucose toler-ance test), according to the American Diabetes Association rec-ommendations.19A battery of neuropsychological tests was per-formed on the 44 patients with confirmed T2DM to assess their cognitive functions as detailed in the next subsection. On the basis of the results of the neuropsychological tests, the patients with T2DM were divided into 2 groups with and without cognitive impairment. Twenty-six subjects with euglycemia (between 50 and 73 years of age; 17 women; fasting glucose level of ⬍7.0 mmol/L, glycosylated hemoglobin A1c percentage of ⬍6.0%) with normal cognition (Montreal Cognitive Assessment score of
ⱖ28 and Mini-Mental State Examination score ofⱖ27) were also enrolled to serve as age-, sex-, and education-matched healthy controls (denoted as the healthy control [HC] group hereafter).
For all 3 groups, we used the following exclusion criteria: 1) organic lesions in the brain, such as brain tumors, cerebral infarction, hemorrhage, or vascular malformation; 2) a history of stroke, epilepsy, head trauma, or brain surgery; 3) systemic organic disease or a history of tumors; 4) moderate and severe hypertension (systolic pressure ofⱖ160 mm Hg or diastolic pressure ofⱖ100 mm Hg), or hyperlipidemia; 5) any contra-indication to MR imaging examination, such as the presence of metallic implants, fixed metal dentures, pacemaker, or claustro-phobia; or 6) other types of diabetes. In addition to the above criteria, 2 patients were excluded from data analysis because of excessive motion during the MR imaging (n⫽1) or scanner mal-function (n ⫽1), resulting in 42 patients with T2DM and 26 healthy controls (no exclusions) whose imaging data were used in the final analysis.
Cognitive Assessment
All patients underwent comprehensive physical, neurologic, and neuropsychological assessments, which included the Mini-Men-tal State Examination, Montreal Cognitive Assessment, Hachin-ski Ischemic Score, Activities of Daily Living Test, and Auditory Verbal Learning Test, performed by 2 neurologists (Z.X. and Q.Z.), to subdivide the patients with T2DM into 2 groups with and without MCI. The inclusion criteria for the MCI group were the following: 1) memory decline; 2) both Montreal Cognitive Assessment and Mini-Mental State Examination scores ofⱕ27;
and 3) absence of any other physical or mental disorders that can lead to cognitive impairment, resulting in 20 patients with T2DM in the MCI group (the DM-MCI group). The remaining 22 pa-tients formed the group with normal cognition (the DM-NC group). The Hachinski Ischemic Score and Activities of Daily Liv-ing tests were used to exclude vascular dementia and evaluate the daily life abilities. Consistency in age, sex, and education level among the DM-MCI, DM-NC, and HC groups was determined with a 1-way ANOVA and a2test.
Image Acquisition
MR images were acquired on a 3T MR imaging scanner (Discov-ery MR750; GE Healthcare, Milwaukee, Wisconsin) by using a commercial 32-channel head coil. The subjects were padded with flexible foam to limit head motion. Using axial T2 FLAIR (TR/TE/ TI⫽8400/160/2100 ms, section thickness⫽5 mm, section spac-ing⫽1.5 mm, matrix size⫽256⫻256, FOV⫽24.0⫻24.0 cm2,
and NEX⫽1) and a sagittal T1-weighted 3D brain volume imag-ing sequence (TR/TE/TI⫽8.2/3.2/450 ms, flip angle⫽12°, sec-tion thickness⫽1 mm, matrix size⫽256⫻256⫻160, FOV⫽ 25.6⫻25.6 cm2, and NEX⫽1), we obtained high-resolution
anatomic images to exclude possible lesions specified in the ex-clusion criteria. Following anatomic imaging, DTI data were ob-tained in the axial plane by using a single-shot diffusion-weighted echo-planar imaging sequence with the following parameters: TR/TE⫽8500/66.3 ms, FOV⫽25.6⫻25.6 cm2, matrix size⫽
128⫻128, section thickness⫽2 mm, number of sections⫽70, number of diffusion gradient directions⫽64, b-value⫽1000 s/mm2, number of images at a b-value of 0 s/mm2⫽5,
accelera-tion factor⫽2, and scan time⫽9 minutes 55 seconds.
fMRI of the Brain Software Library and Tract-Based Spatial Statistics
The diffusion tensor images were processed by using the fMRI of the Brain Software Library (http://www.fmrib.ox.ac.uk/fsl), or FSL.20Voxelwise statistical analysis of the images was performed by using Tract-Based Spatial Statistics (TBSS; http://fsl.fmrib. ox.ac.uk/fsl/fslwiki/TBSS)21with the following steps: First, brain was extracted by using the Brain Extraction Tool (http://fsl.fmrib. ox.ac.uk/fsl/fslwiki/BET). An FSL “eddy” tool (http://fsl.fmrib. ox.ac.uk/fsl/fslwiki/eddy) was applied as a preventive measure to reduce inconsistent image distortion. After generating the FA maps by using the FMRIB Diffusion Toolbox (http://fsl.fmrib.ox. ac.uk/fsl/fslwiki/FDT), we aligned the images from all subjects to an FA standard template through a nonlinear coregistration. The aligned FA maps were then averaged to produce a group mean image, which was used to generate an FA skeleton highlighting the tracts common to the entire group. For each subject, an FA threshold of 0.2 was used before projecting the aligned FA map onto this skeleton. The resulting skeletonized FA maps were then fed into a voxelwise group-level analysis.22In addition to FA, diffusivity maps based on MD, axial diffusivity (1, the principal
eigenvalue), and radial diffusivity (23, the average of the 2
re-maining eigenvalues) were generated by using the same steps outlined above. Using an FSL permutation test (FSL Randomise tool with 500 permutations; http://fsl.fmrib.ox.ac.uk/fsl/fslwiki/ Randomise), we tested FA, MD,1, and23for differences
be-tween the means of the DM-MCI, DM-NC, and HC groups. A significance level ofP⬍.05 was used for each of the 4 DTI param-eters (FA, MD,1, and23) to declare differences among the
patient groups.
ROI-Based Quantitative Analysis
The Johns Hopkins University WM tractography atlas23in FSL was used as a standard for WM parcellation. The entire WM was parceled into 48 ROIs by using the 1-mm Johns Hopkins Univer-sity–ICBM labels (http://fsl.fmrib.ox.ac.uk/fsl/fslwiki/Atlases). Specific fiber tracts reported to be relevant to MCI in previous studies24-26were selected in the telencephalon as well as 4 regions in the cerebellum and the brain stem (Fig 1). FA and MD were calculated by averaging the pixel values in each ROI and were reported as mean⫾SD. Using SPSS 17.0 software (IBM, Armonk, New York), we performed a receiver operating characteristic (ROC) analysis to determine the area under the ROC curve for assessing the performance of separating the DM-MCI and DM-NC groups when FA and MD of the right cingulum (hip-pocampus) were used individually or in combination via a logistic regression algorithm.
The ROC analysis for the combination of FA and MD was performed by using a binomial (bivariate) logistic regression with patient condition (DM-MCI or DM-NC) as the dichoto-mous criterion variable and FA and MD as the dichotodichoto-mous predictor variables. This method estimated the probability (P0) of being in the DM-MCI group by using the following
logistic function:
P0⫽exp(a0⫹a1FA⫹a2MD) / [1⫹exp (a0⫹a1FA⫹a2MD)],
wherea0is a constant anda1anda2are the regression coefficients
for FA and MD, respectively. The regression coefficients were de-termined by using a maximum likelihood method.27
RESULTS
Clinical DataThe clinical and neuropsychological characteristics of the 3 sub-ject groups are summarized in the On-line Table. No significant difference was observed among the 3 groups in age (P⫽.130), sex (P⫽.854), years of education (P⫽.216), and body mass index (P⫽.291). The DM-MCI group exhibited a higher level of glyco-sylated hemoglobin A1c (P⫽.008) and a trend toward a signifi-cant increase in disease duration (P⫽.066) compared with the DM-NC group.
Whole-Brain DTI Comparisons among Groups
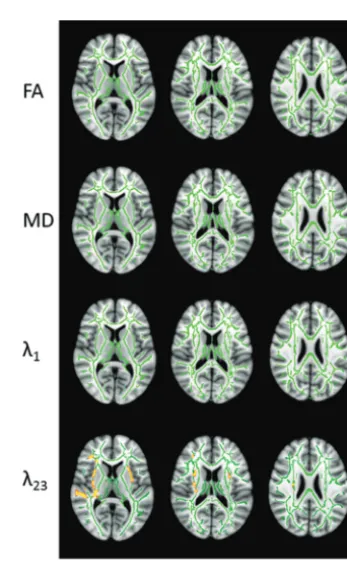
The whole-brain TBSS analysis revealed that 7.3% (10,102/137,832 voxels) and 24.9% (34,353/137,832 voxels) of the parcellated regions exhibited decreased FA and increased MD, respectively, in the DM-MCI group compared with the DM-NC group (Fig 2). Analysis of the individual eigenvalues illustrated that the reduced FA and increased MD in the DM-MCI group were caused primar-ily by an elevated radial diffusivity (23), rather than changes in
axial diffusivity (1) (Fig 2). Compared with the results inFig 2,
groups (Fig 3). In addition,1also showed noticeable changes in Fig 3. These observations indicate that DTI parameters of the DM-NC group differed from those of the HC group; this differ-ence suggests that gradual WM changes have already occurred in the patients with DM-NC, even when neuropsychological tests did not indicate MCI. These findings support our hypothesis. Additional evidence to reinforce our hypothesis can be found in
Fig 4, where a direct comparison between the DM-NC and the HC groups reveals moderate changes in radial diffusivity (23) in
sev-eral regions, including the bilatsev-eral external capsule and the tem-poral WM areas, as well as the right frontal WM areas and corona radiata.
Differences in FA and MD of Specific Fiber Tracts among the Groups
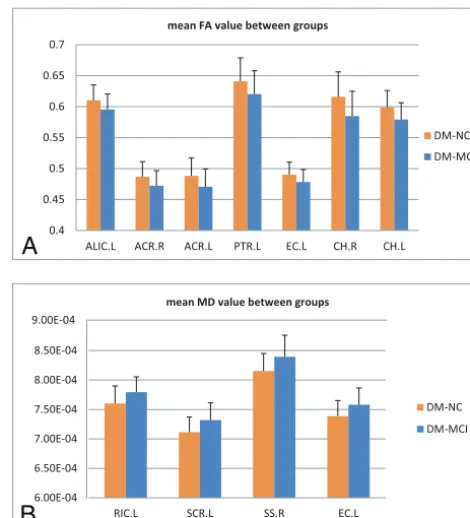
Tables 1and2summarize the FA and MD differences (P⬍.05 with false discovery rate correction), respectively, in the se-lected fibers across the 3 groups. Among the 15 fiber tracts analyzed by using the Johns Hopkins University atlas,23 signif-icantly decreased FA and increased MD were observed in the
left external capsule between the DM-MCI and DM-NC groups. Addition-ally, we also observed FA differences in the left anterior limb of the internal capsule, right and left anterior corona radiata, left posterior thalamic radia-tion, and right and left cingulum (hip-pocampus), and MD differences in the left retrolenticular part of internal capsule, left superior corona radiata, and right sagittal striatum. These dif-ferences, which suggest that FA and MD may serve as alternative surro-gates to the conventional neuropsy-chological test scores, are illustrated in
Fig 5A(for FA), -B (for MD). More important, when the DM-NC and the HC groups were compared, significant differences in FA were found in the right corticospinal tract and right ce-rebral peduncle, and differences in MD were found in the right retrolen-ticular part of internal capsule and right external capsule. Again, these observations support our hypothesis. Overall, the atlas-based analyses on individual fiber tracts suggested that pronounced FA reduction and/or MD elevation occurred mainly in the internal/external capsule, corona radi-ata, and cingulum (in the vicinity of the hippocampus) regions.
ROC Analysis
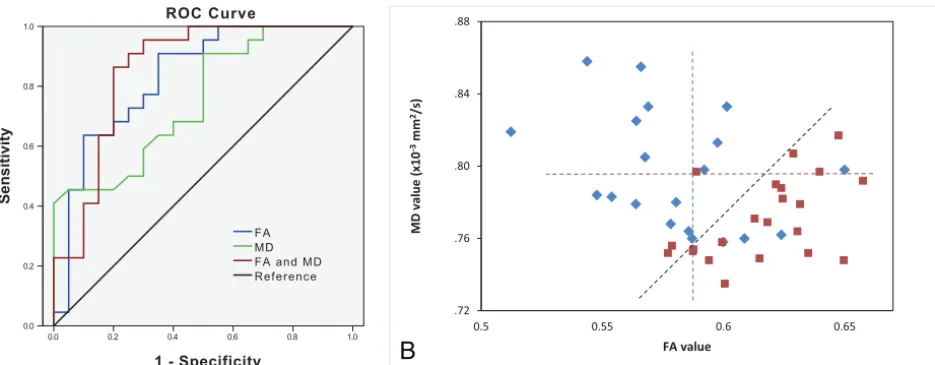
The feasibility of using FA and MD to separate the DM-MCI and DM-NC groups, as indicated byFig 5, is further demonstrated in an ROC analysis. Fig-ure 6Ashows the ROC curves in the right cingulum (hippocampus), using DTI parameters for distinguishing DM-MCI (positive) and DM-NC (negative). FA (area under the ROC curve⫽0.832; 95% CI, 0.705– 0.958) had a higher area under the ROC curve than MD (0.753; 95% CI, 0.608 – 0.899). When we combined FA and MD by using a logistic regression model, the area under the ROC curve was further improved to 0.857 (95% CI, 0.735– 0.979).Figure 6Bshows a scatterplot with all data of patients with T2DM. The best cutoff values of FA and MD, determined by using a Youden index, are indicated by the vertical and the horizontal dashed lines, respectively. The black dashed line corresponds to the cutoff probability of the best sensitivity (0.864) and specificity (0.800) when combining FA and MD.
DISCUSSION
The results of this study (Figs 2– 4andTables 1and2) provided evidence to support our hypothesis that the WM change in pa-tients with T2DM is a gradual and continuous process that may not be adequately reflected by neuropsychological test scores but can be captured in DTI parameters. The observations were made FIG 1. Selected ROIs in the individual fiber analysis according to a Johns Hopkins University–ICBM
labels 1-mm template. “.R and .L” in the text indicate right and left side, respectively. In the telencephalon, ALIC indicates anterior limb of internal capsule; ACR, anterior corona radiata; g/b/s CC, corpus callosum (genu/body/splenium); CCG, cingulum (cingulate gyrus); CH, cingulum (hippocampus); EC, external capsule; PCR, posterior corona radiata; PTR, posterior thalamic radi-ation (including optic radiradi-ation); RIC, retrolenticular part of internal capsule; SCR, superior corona radiata; SS, sagittal striatum (including the inferior longitudinal fasciculus and inferior fronto-occipital fasciculus). In the cerebellum and brain stem, CP, indicates cerebellar peduncle; CT, corticospinal tract; MCP, middle cerebellar peduncle; and PCT, pontine crossing tract (a part of MCP).
[image:4.594.58.374.48.381.2]possible by dividing the patients with T2DM into 2 groups ac-cording to their cognitive functions and examining changes in DTI metrics in each group against healthy controls. Using a prev-alent DTI analysis tool, FSL, we observed not only decreased FA and increased MD in the brains of the patients with T2DM with clinically confirmed MCI compared with those without (Figs 2
and5), but also subtle yet important changes in radial diffusivity (23) between the DM-NC and the HC groups (Fig 4). These
results have not been reported previously, to our knowledge. We also observed widespread FA and MD changes between the DM-MCI and the HC groups (Fig 3), which reinforced the findings in a recent study.18
The widespread WM differences inFig 2indicate that the ob-served changes in DTI metrics are strongly coupled with cognitive decline. Using individual eigenvalues, we were able to determine that the FA and MD changes were associated with elevated radial diffusivity, instead of decreased axial diffusivity. Previous studies have related elevated radial diffusivity to a compromised myelin sheath and reduced axial diffusivity to axonal damage.28,29Thus, the WM changes inFig 2are likely caused by changes in the myelin sheath or increased interstitial space between the myelin-covered axons in patients with DM-MCI. The exact mechanism explain-ing why long-term sustained hyperglycemia would compromise the myelin sheath remains unclear. Small-vessel alterations
asso-FIG 3. Group differences in FA, MD, axial diffusivity (1), and radial diffu-sivity (23) between the DM-MCI and the HC groups in 3 representative sections (see On-line Fig 2 for a complete set of images with whole-brain coverage). All other details are the same as in the legend forFig 2.
FIG 4. Group differences in FA, MD, axial diffusivity (1), and radial diffu-sivity (23) between the DM-NC and the HC groups in 3 representative sections (see On-line Fig 3 for a complete set of images with whole-brain coverage). All other details are the same as in the legend forFig 2. FIG 2.Differences in FA, MD, axial diffusivity (1), and radial diffusivity
[image:5.594.330.500.45.323.2] [image:5.594.83.253.46.322.2] [image:5.594.326.500.403.687.2]ciated with hypoperfusion and inflammatory factors can be pos-sible causes.30
Although bothFigs 2 and 3 compare the DM-MCI group against subjects without clinically confirmed cognitive impair-ment, the results are considerably different. In addition to changes in radial diffusivity,Fig 3also shows extensive changes in axial diffusivity (1), suggesting axonal damage in patients with
DM-MCI compared with HC. A number of studies have shown that T2DM and Alzheimer disease share several pathogeneses, including insulin deficit, glucose-mediated toxicity, and amy-loid-peptide accumulation.8,31One of the important pathologic bases of Alzheimer disease is neurofibrillary tangles,32caused by the phosphorylatedprotein. As a terminal axonal lesion, neuro-fibrillary tangles and subsequent synapse loss can lead to progres-sive loss of memory and compromised cognition. The similar mechanism may explain the observed1elevation inFig 3. More
important, the increase in radial diffusivity in the patients with DM-NC shown inFig 4can be a significant finding because it suggests minor-to-moderate damage to the myelin sheath in the early phase of cognitive decline (eg, amnesia) in patients with T2DM before they can be clinically diagnosed by using neuropsy-chological test scores.
Our investigation of regional WM alterations was focused on the telencephalon because of its pivotal role in cognition and de-mentia. Not surprising, DTI parameter changes were observed in the cingulum near the hippocampus, which is related to learning and memory,24as well as in the anterior limb and the retrolentic-ular area of the internal capsule. Furthermore, the FA or MD differences between the DM-NC and HC groups in the cortico-spinal tract and external capsule (Tables 1and2) provide more
specific evidence to support our hypothesis that early changes during the course of cognitive decline can be detected by DTI before the patients become symptomatic.
The present study has also demonstrated that FA and MD can become potential imaging markers (Fig 6) that are sensi-tive to cognisensi-tive declines in patients with T2DM. These mark-ers can be used individually or combined to complement the existing neuropsychological tests. Zhang et al18recently re-ported that FA changes in the external capsule were correlated with executive dysfunction. Reijmer et al17observed that in-creased MD was associated with slowing information process-ing and worsened memory performance. These studies, to-gether with our results, all indicate that FA and MD can quantitatively characterize the cognitive decline process, which would eventually lead to clinical symptoms to be re-flected in the neuropsychological scores.
Our study has several limitations. First, despite the attempt to exclude other causes of WM changes, it is still possible that an underlying process independent of diabetes mellitus is associated with the cognitive decline. Patients without diabetes with similar cognition need to be studied to control for the possibility that the cognitive decline rather than diabetes mellitus is associated with changes in DTI measures. Nonetheless, the present study suggests that DTI metrics have the potential to predict cognitive impair-ment in patients with T2DM (Fig 6). Second, although we ex-cluded subjects with severe and moderate hypertension or
hyper-0.4 0.45 0.5 0.55 0.6 0.65 0.7
ALIC.L ACR.R ACR.L PTR.L EC.L CH.R CH.L
mean FA value between groups
DM-NC DM-MCI
A
6.00E-04 6.50E-04 7.00E-04 7.50E-04 8.00E-04 8.50E-04 9.00E-04
RIC.L SCR.L SS.R EC.L
mean MD value between groups
DM-NC DM-MCI
B
[image:6.594.299.534.45.304.2]FIG 5. Differences in FA (A) and MD (B) values for specific fiber tracts in an atlas-based ROI analysis between the DM-MCI (blue) and the DM-NC (orange) groups. All fibers in the figure show a statistically significant difference (P⬍.05). The bar height indicates the mean, and theline on top of the barrepresents the SD. L indicates left; R, right; ALIC, anterior limb of internal capsule; ACR, anterior corona radiata; CH, cingulum (hippocampus); EC, external capsule; PTR, posterior tha-lamic radiation (including the optic radiation); RIC, retrolenticular part of internal capsule; SCR, superior corona radiata; SS, sagittal striatum (including the inferior longitudinal fasciculus and inferior fronto-oc-cipital fasciculus).
Table 1: FA values in specific fiber tracts with significant differences among groups (P<.05)
JHU WM
Atlas FA (DM-MCI) FA (DM-NC) FA (HC) PValue
ALIC.L 0.595⫾0.025 0.610⫾0.021 .044
ACR.R 0.472⫾0.024 0.487⫾0.019 .035
ACR.L 0.471⫾0.029 0.488⫾0.018 .022
PTR.L 0.620⫾0.038 0.641⫾0.027 .045
EC.L 0.478⫾0.020 0.490⫾0.017 .043
CH.R 0.585⫾0.040 0.616⫾0.024 .004
CH.L 0.579⫾0.027 0.599⫾0.026 .019
CT.R 0.548⫾0.030 0.569⫾0.017 .003
CP.R 0.590⫾0.021 0.608⫾0.019 .002
[image:6.594.53.286.68.180.2]Note:—R indicates right; L, left; ALIC, anterior limb of internal capsule; ACR, anterior corona radiata; CH, cingulum (hippocampus); EC, external capsule; PTR, posterior thalamic radiation (including the optic radiation); CP, cerebellar peduncle; CT, corti-cospinal tract; JHU, Johns Hopkins University.
Table 2: MD values (ⴛ10ⴚ3mm2/s) in specific fiber tracts with significant differences among groups (P<.05)
JHU WM
Atlas MD (DM-MCI) MD (DM-NC) MD (HC) PValue
RIC.L 0.780⫾0.026 0.760⫾0.029 .031
SCR.L 0.732⫾0.029 0.712⫾0.026 .021
SS.R 0.839⫾0.037 0.815⫾0.030 .024
EC.L 0.758⫾0.029 0.739⫾0.026 .030
RIC.R 0.773⫾0.030 0.755⫾0.021 .021
EC.R 0.784⫾0.044 0.756⫾0.027 .009
Note:—R indicates right; L, left; RIC, the retrolenticular part of internal capsule; SCR, superior corona radiata; SS, sagittal striatum (including the inferior longitudinal fas-ciculus and inferior fronto-occipital fasfas-ciculus); EC, external capsule; JHU, Johns Hop-kins University.
[image:6.594.54.285.245.329.2]lipidemia, a small number of subjects with mild hypertension or hyperlipidemia were included to increase the statistical power. We observed very similar results in separate analyses with and without the inclusion of subjects with mild hypertension (or hy-perlipidemia), indicating that the effect caused by mild hyperten-sion or hyperlipidemia was not substantial. Third, because rigor-ous clinical diagnosis of MCI remains a challenge, dividing the patients with T2DM into the DM-MCI and DM-NC groups can be subject to inaccuracy. Last, given the slow development of MCI, a longitudinal study would be needed to test whether DTI measures can predict the development of cognitive impairment in patients with T2DM.
CONCLUSIONS
Our study has demonstrated that DTI parameters can show a significant difference between patients with T2DM with and with-out MCI, suggesting their potential role as an imaging marker for detecting cognitive decline in patients with T2DM. More impor-tant, our study also indicates that the DTI parameters may capture gradual and continuous WM changes that can be associated with early stages of cognitive decline in patients with T2DM before they can be diagnosed clinically by using the conventional neuro-psychological test scores.
ACKNOWLEDGMENTS
The authors are grateful to Dr Keith R. Thulborn for helpful dis-cussions and to Dr Winnie Mar for proofreading the manuscript.
Disclosures: Yi Sui—UNRELATED: Consultancy: GE Healthcare. Xiaohong Joe Zhou—RELATED:Grant: National Institutes of Health*;UNRELATED:Consultancy: Horizon Medical Physics Services;Grants/Grants Pending: AbbVie Pharmaceuti-cals*;Royalties:Elsevier Publishing;Stock/Stock Options:Apple, Google. *Money paid to the institution.
REFERENCES
1. Whiting DR, Guariguata L, Weil C, et al.IDF Diabetes Atlas: global estimates of the prevalence of diabetes for 2011 and 2030.Diabetes Res Clin Pract2011;94:311–21CrossRef Medline
2. McCrimmon RJ, Ryan CM, Frier BM.Diabetes and cognitive dys-function.Lancet2012;379:2291–99CrossRef Medline
3. Biessels GJ, Staekenborg S, Brunner E, et al.Risk of dementia in diabetes mellitus: a systematic review.Lancet Neurol2006;5:64 –74
CrossRef Medline
4. Rusinek H, Ha J, Yau PL, et al.Cerebral perfusion in insulin resis-tance and type 2 diabetes.J Cereb Blood Flow Metab2015;35:95–102
CrossRef Medline
5. Sahin I, Alkan A, Keskin L, et al.Evaluation of in vivo cerebral me-tabolism on proton magnetic resonance spectroscopy in patients with impaired glucose tolerance and type 2 diabetes mellitus.J Di-abetes Complications2008;22:254 – 60CrossRef Medline
6. Cui Y, Jiao Y, Chen YC, et al.Altered spontaneous brain activity in type 2 diabetes: a resting-state functional MRI study.Diabetes2014; 63:749 – 60CrossRef Medline
7. Musen G, Jacobson AM, Bolo NR, et al.Resting-state brain func-tional connectivity is altered in type 2 diabetes.Diabetes2012;61: 2375–79CrossRef Medline
8. Umegaki H. Type 2 diabetes as a risk factor for cognitive impairment: current insights.Clin Interv Aging 2014;9:1011–19
CrossRef Medline
9. Zhang Y, Zhang X, Zhang J, et al.Gray matter volume abnormalities in type 2 diabetes mellitus with and without mild cognitive impair-ment.Neurosci Lett2014;562:1– 6CrossRef Medline
10. de Bresser J, Tiehuis AM, van den Berg E, et al; Utrecht Diabetic Encephalopathy Study Group.Progression of cerebral atrophy and white matter hyperintensities in patients with type 2 diabetes. Dia-betes Care2010;33:1309 –14CrossRef Medline
11. Moran C, Phan TG, Chen J, et al.Brain atrophy in type 2 diabetes: regional distribution and influence on cognition.Diabetes Care
2013;36:4036 – 42CrossRef Medline
12. Antenor-Dorsey JA, Meyer E, Rutlin J, et al.White matter micro-structural integrity in youth with type 1 diabetes.Diabetes2013;62: 581– 89CrossRef Medline
13. Nunley KA, Ryan CM, Orchard TJ, et al.White matter hyperinten-sities in middle-aged adults with childhood-onset type 1 diabetes.
Neurology2015;84:2062– 69CrossRef Medline
14. Stahl R, Dietrich O, Teipel SJ, et al.White matter damage in Alzhei-mer disease and mild cognitive impairment: assessment with diffu-sion-tensor MR imaging and parallel imaging techniques.Radiology
2007;243:483–92CrossRef Medline
15. Hsu JL, Chen YL, Leu JG, et al.Microstructural white matter
abnor-.72 .76 .80 .84 .88
0.5 0.55 0.6 0.65
MD value
(x10
-3mm 2/s)
FA value
A
B
[image:7.594.65.533.46.228.2]malities in type 2 diabetes mellitus: a diffusion tensor imaging study.Neuroimage2012;59:1098 –105CrossRef Medline
16. Hoogenboom WS, Marder TJ, Flores VL, et al.Cerebral white matter integrity and resting-state functional connectivity in middle-aged patients with type 2 diabetes.Diabetes2014;63:728 –38CrossRef Medline
17. Reijmer YD, Brundel M, de Bresser J, et al; Utrecht Vascular Cognitive Impairment Study Group.Microstructural white matter abnormal-ities and cognitive functioning in type 2 diabetes: a diffusion tensor imaging study.Diabetes Care2013;36:137– 44CrossRef Medline
18. Zhang J, Wang Y, Wang J, et al.White matter integrity disruptions associated with cognitive impairments in type 2 diabetic patients.
Diabetes2014;63:3596 – 605CrossRef Medline
19. American Diabetes Association.Diagnosis and classification of dia-betes mellitus. Diabetes Care 2013;36(suppl 1):S67–74 CrossRef Medline
20. Jenkinson M, Beckmann CF, Behrens TE, et al.FSL.Neuroimage
2012;62:782–90CrossRef Medline
21. Smith SM, Jenkinson M, Johansen-Berg H, et al.Tract-based spatial statistics: voxelwise analysis of multi-subject diffusion data. Neuro-image2006;31:1487–505CrossRef Medline
22. Smith SM, Johansen-Berg H, Jenkinson M, et al.Acquisition and voxelwise analysis of multi-subject diffusion data with tract-based spatial statistics.Nat Protoc2007;2:499 –503CrossRef Medline
23. Mori S, Oishi K, Jiang H, et al.Stereotaxic white matter atlas based on diffusion tensor imaging in an ICBM template.Neuroimage
2008;40:570 – 82CrossRef Medline
24. Seib DR, Martin-Villalba A.Neurogenesis in the normal ageing hippocampus: a mini-review.Gerontology2015;61:327–35CrossRef Medline
25. Chua TC, Wen W, Slavin MJ, et al.Diffusion tensor imaging in mild cognitive impairment and Alzheimer’s disease: a review.Curr Opin Neurol2008;21:83–92CrossRef Medline
26. Liu Y, Spulber G, Lehtima¨ki KK, et al.Diffusion tensor imaging and tract-based spatial statistics in Alzheimer’s disease and mild cogni-tive impairment. Neurobiol Aging 2011;32:1558 –71 CrossRef Medline
27. Menard SW.Applied Logistic Regression Analysis. Thousand Oaks, California: Sage; 2002:1–120
28. Neil JJ.Diffusion imaging concepts for clinicians.J Magn Reson Im-aging2008;27:1–7CrossRef Medline
29. Song SK, Sun SW, Ramsbottom MJ, et al.Dysmyelination revealed through MRI as increased radial (but unchanged axial) diffusion of water.Neuroimage2002;17:1429 –36CrossRef Medline
30. Peterson JW, Bo¨ L, Mo¨rk S, et al.Transected neurites, apoptotic neurons, and reduced inflammation in cortical multiple sclerosis lesions.Ann Neurol2001;50:389 – 400CrossRef Medline
31. Biessels GJ, Deary IJ, Ryan CM.Cognition and diabetes: a lifespan perspective.Lancet Neurol2008;7:184 –90CrossRef Medline
32. Butterfield DA, Di Domenico F, Barone E.Elevated risk of type 2 diabetes for development of Alzheimer disease: a key role for oxi-dative stress in brain. Biochim Biophys Acta2014;1842:1693–706
CrossRef Medline