KNOWLEDGE EXTRACTION METHOD USING
STOCHASTIC APPROACHES IN GOOGLE MAPS
1PARIVALLAL R, 2NAGARAJAN B
1Assistant Professor, Department of Computer Applications, Bannari Amman Institute of Technology, 2Director, Department of Computer Applications, Bannari Amman Institute of Technology,
Sathyamangalam, Tamil Nadu, India
E-mail: [email protected], [email protected]
ABSTRACT
Develop a system to extract knowledge from real images are challenging research work. To extract knowledge from the Google map first authors apply the image analysis technique to the Google maps. Authors develop a system to extract knowledge from Google map image, by using this system any user can locate the place and can identify number of objects in an image. By applying image segmentation technique, partitioning or subdividing an image into multiple meaningful regions or sets of pixels with respect to a particular application. In image analysis system, Image segmentation is an important component. There are many image segmentation techniques; one of the most important techniques is marking techniques. This method transform original image into mark segmented image. After marking the object find centroids points for the each identified object then in the result apply into the spatial data mining technique to extract knowledge. In this paper, define a stochastic approach for image analysis to object identification from Google map using Matlab.
Keywords: Image Analysis, Image Segmentation and Marking
1. INTRODUCTION
The world-wide web has containing information of a geographical or spatial nature, particularly location information such as addresses, postal codes, telephone numbers and so forth. Commercial web pages typically contain address and contact telephone numbers as well as descriptions of the products and services offered. It is natural to assume that associations exist between the general contents of a web page and the specific location information it may contain.
Spatial data mining or knowledge discovery in spatial database is the process of extracting of implicit knowledge, i.e., spatial relations, and finding interesting characteristics and patterns that are not explicitly represented in the database. This technique plays an important role in understanding spatial data and in capturing intrinsic relationships between spatial and non-spatial data. The main aim of this paper is to analyze the Google map images and identify the building object from the Google map images. Hence the authors develop a new system to identify the objects from the image and stored into the database.
Later we can get results for the spatial queries from the database by applying spatial data mining techniques. This system will provide knowledge to
the entrepreneur to extract details for a particular location.shed.
2. THE RESEARCH METHOD
An Image is an array or a matrix of square pixels arranged in columns and rows. Each pixel represents the color at a single point in the image. A digital image is a numeric representation of a two-dimensional image. Any image from a scanner, or from a digital camera, or in a computer capture from a Google map, is a digital image.
The task of partitioning an image into regions with homogeneous texture, commonly referred to as image segmentation, is widely accepted as a crucial function for high-level image understanding, significantly reducing the complexity of content analysis of images. Image segmentation is typically used to locate objects and boundaries (lines, curves, etc.) in images[12].
It is one of the most difficult tasks in image processing because it determines the quality of the final result of analysis.
region-based segmentation, data clustering, and edge-base segmentation[4].
Region-based methods mainly rely on the assumption that the neighboring pixels within one region have similar value. The common procedure is to compare one pixel with its neighbors. If a similarity criterion is satisfied, the pixel can be set belong to the cluster as one or more of its neighbors. The selection of the similarity criterion is significant and the results are influenced by noise in all instances[3].
Edge-base segmentation generally indicates the segmentation method based on the edge in an image. The simple methods apply some edge detection methods before segmentation. Some edge detection methods are gradient operators and Hilbert transform. Then the other methods only based on the concept of edge instead of using edge detection methods, for instance, watershed segmentation algorithm.
Watershed transform is a powerful tool that is based on the object’s boundary and finds local changes for image segmentation. The simplest description of watershed transform comes from geography as it is the ridge that divides areas drained by different river systems and catchment basins are areas draining into rivers or reservoirs. The image processing uses this concept for gray-scale image in a way to overcome a variety of the segmentation image problems. Knowledge of the watershed transform requires to take into account a gray-scale image as a topological surface, where the values of f(x, y) are interpreted as heights. It finds the catchment basins and ridge lines, where catchment basins are the objects or regions which we want to identify[10].
The distance transform is the appropriate and common tool that is associated with watershed transform for processing on a binary (white & black) image. To apply watershed transform with distance transform, it is necessary to convert the gray-scale image to binary image with calculating global image threshold by using Otsu’s algorithm. Euclidean distance is implemented as mathematical method based on the distance from each pixel to the nearest nonzero-valued pixel. Below, there is a 4×4 matrix of zeros and ones that is first described as the binary image and then follows its distance transform:
0 0 0 0 1.41 1.00 1.00 1.41
0 1 1 0 1.00 0.00 0.00 1.00
0 1 1 0 1.00 0.00 0.00 1.00
0 0 0 0 1.41 1.00 1.00 1.41
(a) Binary image (b) It′s distance transform
After calculation distance transform of complement binary image, the negative of distance transform is used in watershed transform to produce the label matrix. In the label matrix, the zero values correspond to watershed ridge pixels and the positive integer values imply catchment basins [3].
The gradient magnitude is another method for computing watershed transform [4]. It is used often to pre process a gray-scale image prior to using the watershed transform for segmentation. The gradient magnitude image has high pixel values along object edges, and low pixel values everywhere else [3]. Gradient magnitude is used as edge indicator in order to identify region boundaries [5]. The gradient magnitude and its direction of gray-scale image are computed in both of directions (x, y) of image. If F is known as a gray scale image then its gradient is defined by the vector [3] as follows:
The gradient of an image is given by the formula :
, where :
is the gradient in the x direction
is the gradient in the y direction.
The gradient direction can be calculated by the
formula :
.
The gradient magnitude is computed by linear filter methods [2]. Sobel is one of edge filters that emphasizes edge of image in both vertical and horizontal directions [3]. After computing gradient magnitude of image, watershed is used as a line separation which belongs to different minima of object. It means catchment basin moves to minima and edges of them become watershed segmentation. This method of segmentation describes that image contours are equal to ridge lines of the gradient magnitude image which can be identify via watershed [6]. If before watershed transform, directly the gradient magnitude of the original image is computed without pre-processing like smoothing, etc., it can cause the over segmentation [7].
processing. Overlapping is a major problem in image segmentation and its applications in engineering, object identification etc. The results of segmentation for overlapping objects are usually not satisfactory and the main problem is caused by the situation when two objects segment as one.
In this paper, the marking segmentation algorithm is applied to identify the objects, the improved method described below:
This method extracts the edge of an object in binary image by basic operation in mathematical morphology that is dilation. Dilation aims to expand objects in a binary image. Magnitude of enlargement of objects is controlled by different shapes and values as structuring elements.
The dilation of A by B is defined by (2):
The dilation is commutative, also given by:
.
If B has a center on the origin, then the dilation of A by B can be understood as the locus of the points covered by B when the center of B moves inside A. The dilation of a square of side 10, centered at the origin, by a disk of radius 2, also centered at the origin, is a square of side 14, with rounded corners, centered at the origin. The radius of the rounded corners is 2.
The dilation can also be obtained by: , where Ø is empty set and Bz is the translation of B by the vector z and Bs indicate to the symmetric of B Bs denotes the symmetric of B, that is,
.
The second step of this method is to identify the foreground object of the image. In binary image, the foreground pixels are labeled as one and background pixels are labeled as zero so that in the boundary tracing the pixels of foreground are detected. Now we get the images with background is black and the foreground objects are white color.
In binary morphology, an image is viewed as a subset of an Euclidean space or the integer grid , for some dimension d.
The basic idea in binary morphology is to probe an image with a simple, pre-defined shape, drawing conclusions on how this shape fits or misses the
shapes in the image. This simple "probe" is called structuring element, and is itself a binary image.
• Let ; B is an open disk of radius r,
centered at the origin.
The basic operations are shift-invariant operators strongly related to Minkowski addition:
• Let E be a Euclidean space or an integer grid,
and A a binary image in E.
The erosion of the binary image A by the structuring element B is defined by:
,
where Bz is the translation of B by the vector z, i.e.,
, .
When the structuring element B has a center, and this center is located on the origin of E, then the erosion of A by B can be understood as the locus of points reached by the center of B when B moves inside A.
The erosion of A by B is also given by :
The opening of A by B is obtained by the erosion of A by B, followed by dilation of the resulting
image by B: .
The opening is also given by
, which means that it is the locus of translations of the structuring element B inside the image A.
The closing of A by B is obtained by the dilation of A by B, followed by erosion of the resulting structure by B:
The closing can also be obtained by ,
where Xc denotes the complement of X relative to E (that is, ). The above means that the closing is the complement of the locus of translations of the symmetric of the structuring element outside the image A.
In the Euclidean plane, if p = (p1, p2) and q = (q1, q2) then the distance is given by
image, eliminate the background of the image and display only the foreground objects.
Now again complement of the binary image, in that binary image we can identify all foreground objects. From that objects, we can remove the unwanted objects based on the size of the pixel. The remaining objects are the expected objects from the original image.
Next step is labeling for the extracted objects by find the center point of each object. The centroid of a plane figure can be computed by dividing it into a finite number of simpler figures
computing the centroid and area of each part, and then computing
Holes in the figure , overlaps between the parts, or parts that extend outside the figure can all be handled using negative areas . Namely, the measures should be taken with positive and negative signs in such a way that the sum of the signs of for all parts that enclose a given point is 1 if belongs to , and 0 otherwise. Then draw the boundary of all objects. After boundary detection, give a structure to the finally extracted objects. Finally count the total number of objects based on the centroids points of the objects.
3.METHODOLOGY
The statement of the problem is to select the best location for starting a new business. The seeking result from this study is a map showing potential areas for a new business from the object identification. Break down the taken problem into a series of objectives to be solved. Once the problem is stated, break it down into smaller and smaller pieces, until we know what data and steps are required to solve it. The problem of finding the best location for an entrepreneur can be break down into the following objectives: Which location the entrepreneur wants to choose? How many objects are there? How many buildings are there? To create a map of good location, we need to define some characteristics of best location. Based on the survey data and a data set of locations and attributes, we can select the best location. To determine if there are enough buildings, we need to create a map of the number of objects within the selected object area. Find suitable areas, the identified objects we find the centroids and overlays it to get the latitude and longitude values
then the user can extract the knowledge by applying the spatial data mining technique.
To select the optimum location for starting a new business the following diagram explains about our new system.
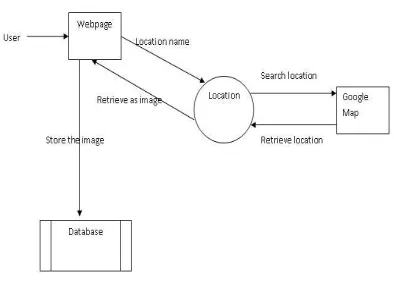
3.1. Dataflow Diagram:
[image:4.595.306.492.335.451.2]The dataflow diagram Fig-1 is describing the overall process of this system. The total activities of this system are controlled by the administrator. Any visitor can visit this system, if the visitor register then he will become an user. This system can able to search and retrieve the location information from Google map and results are stored into a database. The user only can use the knowledge extraction functionality.
Fig – 1 Overall System
[image:4.595.304.501.506.647.2]Google Image extraction through Web page:
Fig – 2 Image Extraction From Google Map
into MySQL database. In MySQL we have created a table and store spatial information about the image.
[image:5.595.89.285.188.336.2]Database design in MySQL:
Fig – 3 Database
In MySQL we have created the database with the above said fields the data can be stored from PHP website.In MatLab we extract data from the database and process it and the results are updated into that database.This table has totally fourteen fields like no, lo_name, image, cen_lat, cen_lon, ri_top_lat, ri_top_lon, ri_bot_lat, ri_bot_lon, le_top_lat, le_top_lon, le_bot_lat, le_bot_lon and cen_image.
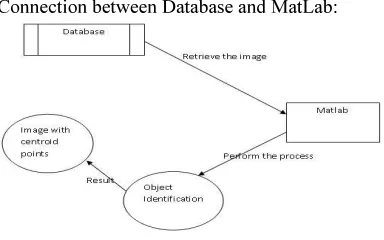
Connection between Database and MatLab:
Fig – 4 Database And Matlab Connection
The above diagram explains about the connection between Matlab with MySQL database. The Matlab retrieve the location image from the database. The various objects like buildings, roads, trees and empty lands are identified and labeled all objects by the Matlab and also the labeled images are stored into the database.
New method to identify Building object:
In MatLab, get image from the database, to identify the objects like buildings, labeled and
stored into the database. The users can extract the spatial knowledge of the given location through the labeled image by using the queries. The extraction process will be explained in the following algorithm.
Proposed Algorithm
Algorithm to identify the object and centroids points
1. BEGIN
2. Read location name as input from user and retrieve a specific location from Google map.
3. Marking the Object area
3.1 Convert RGB image into Grayscale image
3.2 Identify the foreground objects
3.3 Convert into Binary image
3.4 Find the Euclidean distance Transform
4. Object Identification
4.1 Remove unwanted objects from the marked objects
4.2 Labeling to the identified objects
5. Find Centroid points of the identified objects
6. Counting the Objects
6.1 Draw the boundaries of each identified objects
6.2 Counting the objects based on the centroid points
6.3 Display the chart for the identified objects
7. END.
4. ANALYSIS OF PROPOSED WORK
[image:5.595.89.281.470.590.2]100 200 300 400 500 600 50
100
150
200
250
300
350
400
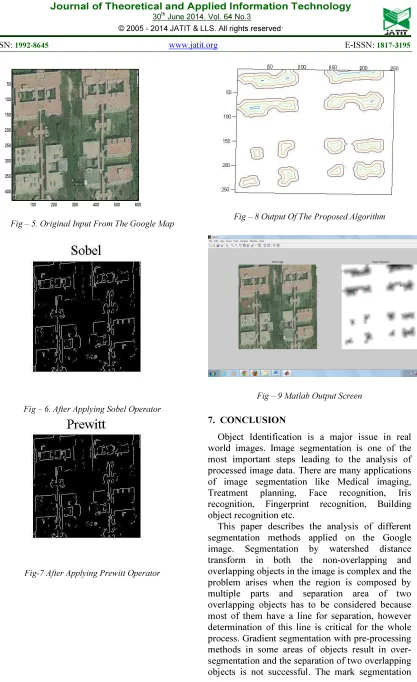
Fig – 5. Original Input From The Google Map
Fig – 6. After Applying Sobel Operator
Fig-7 After Applying Prewitt Operator
[image:6.595.97.514.70.752.2]Fig – 8 Output Of The Proposed Algorithm
Fig – 9 Matlab Output Screen
7. CONCLUSION
Object Identification is a major issue in real world images. Image segmentation is one of the most important steps leading to the analysis of processed image data. There are many applications of image segmentation like Medical imaging, Treatment planning, Face recognition, Iris recognition, Fingerprint recognition, Building object recognition etc.
method associated by technique separation of overlapping objects applied on the objects of image provides better results compared to the other previous methods. Finally authors created a system; using the system any one can extract knowledge to identify objects in the real world image for selecting best place.
ACKNOWLEDGEMENTS
The authors would like to thank Management for providing support and material related to educational research. Also, we are grateful to the Department of Science and Technology – Natural Resource Database Management System (DST – NRDMS) by providing fund (Ref: NRDMS/11 /1760 /2011(G) dated 11/12/2012).
REFRENCES:
[1] Wikipedia. Dilation Morphology. http: //en.wikipedia.org/wiki/Dilation_morphology, July2011.
[2] Jean Cousty, Gilles Bertrand, Laurent Najman, and Michel Couprie. Watershed Cuts: Minimum Spanning Forests and the Drop of Water Principle. IEEE Transactions on Pattern Analysis and Machine Intelligence. 31 (8). August 2009. pp. 1362–1374.
[3] N. Senthilkumaran and R. Rajesh, “A Study on Split and Merge for Region based Image Segmentation”, Proceedings of UGC Sponsored National Conference Network Security (NCNS-08) , 2008, pp.57-61.
[4] G. Bertrand. On topological watersheds. Journal of Mathematical Imaging and Vision, 22(2–3), pp 217–230, 2005.
[5] A K Santra, R Parivallal, “Spatial Pattern Analysis” , International Journal of Advanced Computer Engineering, Vol 1, No. 3. 2010. [6] Mantas Paulinas and AndriusUsinskas, “A
Survey of Genetic Algorithms Applications for Image Enhancement and Segmentation”, Information Technology and Control, Vol.36, No.3, 2007, pp.278-284.
[7] Beucher S and Lantuejoul C, “Use of Watersheds in Contour Detection”, International Workshop on Image Processing : Real-Time Edge and Motion detection/estimation, Rennes, France, 1979.
[8] S. Beucher. The Watershed Transformation Applied to Image Segmentation. Conferenceon Signal and Image Processing in Microscopy and Microanalysis, 16-19 September, 1991.
[9] Meyer F and Beucher S., “Morphological Segmentation”, Journal of Visual Communication and Image representation, Vol. 1, Academic Press, Sept 1990, pp 21 – 46. [10] Xian Bin Wen, Hua Zhang and Ze Tao
Jiang, ”Multiscale Unsupervised Segmentation of SAR Imagery Using the Genetic Algorithm”, Sensors, vol.8, 2008, pp.1704-1711.
[11] T. Cervinka, and I. Provazn´ık. Pre-processing for Segmentation of Computer Tomography Images. The Faculty of Electrical Engineering and Communication Brno University ofTechnology,Department of Biomedical Engineering, 2007.