ORIGINAL RESEARCH
Reduced Diffusion in a Subset of Acute MS
Lesions: A Serial Multiparametric MRI Study
P. Eisele K. Szabo M. Griebe C. Roßmanith A. Fo¨rster M. Hennerici A. Gass
BACKGROUND AND PURPOSE: MRI studies have focused on newly developing MS lesions to charac-terize the early pathology of the disease. DWI is highly sensitive to acute and chronic tissue changes in MS. We characterized the development of acute MS lesions by using DWI in a multiparametric MRI protocol.
MATERIALS AND METHODS: Seventy-two consecutive patients presenting with a new symptom with definite MS or a CIS suggestive of central nervous system demyelination were screened with MRI. Patients who showed an acute MRI lesion with a reduction of ADC were studied with serial MRI for up to 4 months after presentation.
RESULTS: Ten of 72 screened patients who showed a lesion with a reduced ADC were each examined 4 –7 times, resulting in 52 examinations in total. We identified a characteristic sequence of signal-intensity changes: 1) days 0 –7: slight T2 hypersignal-intensity and prominent ADC reduction (maximum, ⫺66%), faint or no enhancement on postcontrast T1-weighted images; 2) days 7–10: prominent T2 hyperintensity and contrast enhancement, ADC normalization/pseudonormalization; 3) up to 4 weeks: elevated ADC values, prominent enhancement on postcontrast images; 4) after 4 weeks: partial reversibility of T2 hyperintensity, ADC elevation, and resolution of contrast enhancement.
CONCLUSIONS:In a subgroup of patients with MS presenting soon after new symptom onset, a transient reduction of the ADC delineated a short and very early phase of MS lesion evolution. Subsequent pseudonormalization of the ADC occurred along with signs of the development of vasogenic edema.
ABBREVIATIONS:CIS⫽clinically isolated syndrome; EP⫽echo-planar; NAWM⫽ normal-appear-ing white matter; RRMS⫽relapsing-remitting MS
M
RI of newly developing MS lesions provides a window to the early pathology of MS. The development of new lesions has, therefore, been the focus of numerous MRI stud-ies. Increased permeability of the BBB on postcontrast T1-weighted MRI and new hyperintensities on T2-T1-weighted im-ages are usually the earliest clearly visible conventional MRI signs of new lesions.1,2DWI investigates water mobility, whichis increased in chronic lesions and in acute vasogenic edema in MS.3-5This increase is thought to reflect expanded
extracellu-lar space, even though the individual contributions from edema, demyelination, and axonal loss are yet unknown.6-8
DWI also may detect reductions of normal water mobility, which is typically but not exclusively demonstrated in acute ischemic stroke.9,10Reductions in water mobility are
identi-fied as hyperintense DWI signal intensity and corresponding low signal intensity on maps of the ADC. Most MRI studies report an increased ADC in acute MS lesions. However in a relatively small number of patients with MS and acute dissem-inated encephalomyelitis, a reduction of the ADC in the very early phase in acute MS lesions has also been documented.7,11 Several recent case studies have reported a reduced ADC in acute demyelinating lesions and have emphasized their
stroke-like ADC appearance.12-15The temporal evolution of the ADC
signal intensity has been well characterized in acute ischemic stroke showing typical phases of an initial reduction, followed by a pseudonormalization and an ADC elevation in the sub-acute-to-chronic phases.9,16
In this study, we report the development of multiparamet-ric MRI signal-intensity characteristics in hyperacute lesions of patients with MS with the main focus on the time course of the ADC signal intensity.
Materials and Methods
Patient Selection
A total of 72 patients who presented with an acute new symptom were investigated with MRI before steroid treatment. The patients had ei-ther definite MS or a CIS suggestive of central nervous system demy-elination. Patients who showed a lesion with a reduced ADC that appeared suitable (⬎1 cm) for a quantitative analysis were followed with serial MRI after the initial examination. The study was designed for frequent follow-up MRI examinations during 4 months after the initial presentation. The study was approved by the local ethics com-mittee, and informed consent was obtained in written form from all patients.
MRI
Initial and follow-up MRI studies were performed on a 1.5T MRI system (Magnetom Sonata; Siemens, Erlangen, Germany). A stan-dardized protocol was used in all patients: 1) transverse, coronal, and sagittal localizing sequences followed by transverse oblique contigu-ous 5-mm sections aligned with the inferior borders of the corpus callosum; 2) T2-weighted images; 3) T1-weighted images; 4) FLAIR
Received August 23, 2011; accepted after revision October 28.
From the Department of Neurology, Universita¨tsMedizin Mannheim, University of Heidel-berg, Mannheim, Germany.
Please address correspondence to Achim Gass, MD, Department of Neurology, Univer-sita¨tsMedizin Mannheim, University of Heidelberg, Theodor-Kutzer-Ufer 1–3, 68135 Mann-heim, Germany; e-mail: [email protected]
Indicates open access to non-subscribers at www.ajnr.org
http://dx.doi.org/10.3174/ajnr.A2975
BRAIN
ORIGINAL
images; 5) DWI EP spin-echo images (TR/TE, 4000/110 ms;b⫽
0/500/1000 s/mm2; FOV, 240 mm2; matrix size, 128⫻128; sequential
application of 3 separate diffusion-sensitizing gradients in perpendic-ular directions); and 6) T1-weighted images 10 minutes after manual injection of single-dose contrast agent (gadoterate dimeglumine [Dotarem; Guerbet, Aulnay-sous-Bois, France]).
Data Processing and Analysis
ADC maps were calculated on a pixel-by-pixel basis by a linear least-squares fit after averaging of the direction-dependent DWI. The ADC value was determined by manual ROI analysis. ADC values were com-pared with those in the corresponding NAWM of the contralateral hemisphere. Signal-intensity ratios in the respective ROIs were also recorded on conventional MRI.
Results
Of the 72 patients with new acute symptoms, 10 showed a lesion with a reduced ADC that appeared suitable (⬎1 cm) for a quantitative analysis. The lesion size ranged from 1.2 to 2.1 cm in the largest diameter in the transverse plane. Most pa-tients were in the early phase of RRMS and were not on im-munomodulatory treatment at the time of their relapse. The presenting new symptoms and further clinical information are given in Table 1. The mean delay between symptom onset and the first MRI examination was 47 hours. The patients were subsequently examined serially 4 –7 times (mean, 5) with an interval of 2 days to 5 months, resulting in 52 examinations in total. Most patients had recovered fully from their relapse symptoms at 4 months.
Time Course of the ADC in Acute MS Lesions
The acute lesions were hyperintense on DWI at the initial mea-surement with a corresponding reduction of the ADC value relative to the contralateral normal-appearing brain tissue in every case. The mean ADC of control regions in healthy-ap-pearing white matter correlated with previously obtained ADC values in healthy controls (for stroke studies).17 The
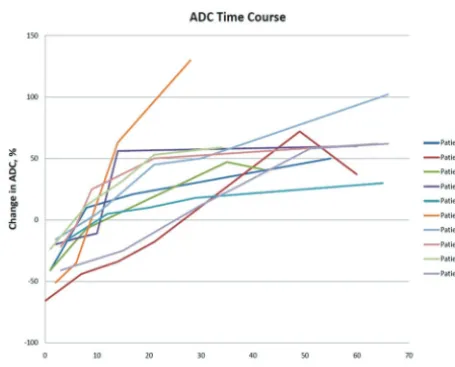
ADC was lowest on the initial MRI in all 10 patients and ranged between⫺66% and⫺17% (mean,⫺33.9%). Subse-quently, the ADC value was increased at the second time point, to reach a pseudonormalization between days 7 and 10. The longest duration of an ADC reduction was observed in patient 2 (10 days), who also showed the most pronounced ADC re-duction initially. At time points later than 4 weeks, in 6/10
cases there was only a slight further increase of the ADC ob-served (Fig 1).
MRI Signal-Intensity Changes on Conventional MRI On initial MRI, all lesions subject to analysis showed slight hyperintense signal intensity on T2-weighted images, which became more pronounced and increased in size (examples are shown in Figs 2 and 3) (Table 2). There was no enhancement on postcontrast T1-weighted images in 8/10 patients, while there was very slight contrast enhancement in 2/10 cases (pa-tients 3 and 4), and it became more prominent, parallel to the ADC increase, sometimes parallel to the T2 signal-intensity hyperintensity. Reduced diffusion delineated a short very early phase of the evolution of symptomatic lesions. While lesions progressed to the typical acute edematous appearance (in-crease of T2 hyperintensity and contrast enhancement), the ADC increased parallel to pseudonormal and elevated values.
Intrinsic Acute MS Lesion Patterns
[image:2.594.55.531.58.194.2]In 3 patients (patients 1, 2, and 4), a concentric arrangement of signal-intensity alterations and course was detected with a low ADC in the rim and an already increased ADC in the center of the lesion. This corresponded to a central enhancement, Fig 1.Time course of intralesional ADC values during the first 90 days in all 10 patients. Note that measurements outside the 90-day range are not shown for better visualization of early time points.
Table 1: Summary of clinical data
No.
Age (yr)/ Sex
Disease Duration/
Diagnosis New Clinical Symptoms
Symptom Onset to MRI (days)
Max.
ADC2
Treatment
Acute/Prophylaxis OCB
1 19/F 2 yr/RRMS Right internuclear ophthalmoplegia 1 ⫺41% IV cortisone/interferon ⫹
2 21/F 1 yr/RRMS Dysarthria 0 ⫺66% IV cortisone/– ⫹
3 20/F 1 yr/RRMS Vertigo, left-sided numbness 1.5 ⫺41% IV cortisone/– ⫹
4 45/F 1.5 yr/RRMS Right-sided weakness 2 ⫺20% IV cortisone/– ⫹
5 25/F 1 yr/RRMS Dysarthria, right-sided weakness 4 ⫺17% IV cortisone/– ⫺ 6 25/F Initial presentation/CIS Dysarthria, left-sided weakness
and numbness
2 ⫺51% IV cortisone/– ⫹
7 30/F 1.5 yr/RRMS Left-sided arm weakness 2 ⫺16% IV cortisone/– ⫹
8 33/F 0.5 yr/RRMS Hemianopia 3 ⫺22% IV cortisone/– ⫹
9 31/M 1 yr/RRMS N.V. numbness 1 ⫺24% IV cortisone/– ⫹
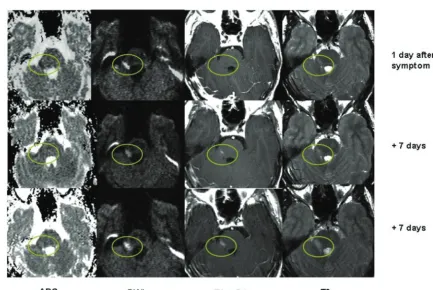
[image:2.594.303.531.227.411.2]Fig 2.Exemplary ADC, contrast-enhanced T1-weighted, DWI, and FLAIR images of the first 4 MRI time points of patient 4 during the first 14 days after new symptom onset. The initially low ADC is associated with only slight T2 hyperintensity. The increasing ADC signal intensity on follow-ups is paralleled by the development of prominent T2 hyperintensity. Contrast enhancement is minimal in the zone of reduced ADC initially and becomes very prominent at time points 3 and 4.
[image:3.594.67.504.44.349.2] [image:3.594.64.498.398.687.2]which regressed and was followed by an enhancement of the rim of the lesion at the time of ADC pseudonormalization. The intensity of the T2 signal intensity varied accordingly with high central signal intensity and an intermediate T2 hyperin-tensity in the periphery of the lesion.
Discussion
We searched for acute MS lesions with a reduced ADC and followed their evolution and signal-intensity changes serially. Our screening approach resulted in a highly selected lesion population that was identified in approximately 10/72 of the screened patients with acute MS. The subsequently detected time course of ADC change is interesting in several respects.
Several reports have demonstrated increased ADC values both in acute contrast-enhancing and chronic MS lesions as well as in the NAWM, confirming that diffusion measure-ments are sensitive for detecting pathologic changes associated with states of increased water mobility.3-5,8,18In chronic MS
lesions, the ADC increase is highly variable (most pronounced ADC increase in T1 hypointense lesions) and higher than that in NAWM; this finding confirms the concept that the severity of tissue matrix damage of MS lesions is heterogeneous.8It has
been suggested that inflammatory vasogenic edema, axonal loss, and demyelination are the most likely pathologic sub-strates of increased ADC.8Our results are in line with these
reports because we also observed an increase of the ADC in the subacute stages of lesion development.
However, the main finding of this study is that a significant
ADC reduction of up to 66% can be present as a transient (2–7 days) finding in the earliest/hyperacute phase of MRI lesion development in MS. The results of the time course of lesions with a reduced ADC demonstrate clearly that there is a very narrow time window to detect such lesions. We recruited pa-tients in this study with a particular focus on a very early MRI after the onset of a new symptom, and MRI was therefore performed as soon as possible after patients came to our atten-tion. Only patients presenting early after symptom onset showed lesions with a reduced ADC. Along with the gradual development of signs of prominent inflammatory edematous changes, the phase of ADC reduction is followed by transient brief pseudonormalization and a subsequent increase of the ADC (3–7 days after symptom onset). The rather faint con-trast enhancement and only mild T2 hyperintensity in the hy-peracute phase in our series indicate that the increased perme-ability of the BBB and edematous tissue change were not fully developed at this point. Contrast enhancement showed both a change with time in that it became more prominent and/or a change in the spatial distribution of enhancement starting in the center of the lesion and progressing sometimes in a cen-trifugal direction to the rim of the lesion. This is in accordance with serial studies of plaque evolution on MRI in patients with MS showing a centrifugal evolution of pathologic processes.1
Two longitudinal studies that also used longer intervals between MRI examinations (minimum of 4 weeks) have ob-served increased ADC signal intensity in the lesions already at the first MRI.5,6We think that both patient selection and the time from symptom onset to the first MRI are important in this regard and that it might well be that the hyperacute phase was missed in these studies. Another cross-sectional study ex-trapolated different phases of lesion acuity by using DWI find-ings; however, this was done without the opportunity to ascer-tain DWI findings on serial analysis.11
ADC reduction in the acute phase of MS lesions has been reported in several recent case studies, some stressing the strokelike appearance of their findings and resulting problems of differential diagnosis.12-15,19In contrast to MS, the
evolu-tion of the ADC has been analyzed in numerous studies in hyperacute ischemic stroke.9,16It may be for this reason that an ischemic mechanism has been suggested as involved in the ADC reduction. We would not share this view but favor an-other potential mechanism for the reduction of the ADC in MS. Lesion locations and clinical presentations of acute re-lapses in MS were very different from those in acute stroke. The location and extent of MS lesions did not match those in arterial vascular territories or lacunar stroke.
Comparing the ADC time course of MS lesions with that of acute ischemic lesions is also made difficult by the fact that the onset of symptoms in MS is not as acute as in stroke and can therefore not be identified with the same precision. This is reflected by our “symptom-to-MRI” times of days as opposed to a few hours in MRI studies of acute stroke. However, in contrast to a previous study of 2 patients with MS with a mild ADC reduction of 22%–33% in the acute lesions, we also found a pronounced ADC reduction in early lesions.10
It is known that ischemia is not a prerequisite for the de-velopment of lesions with a reduced ADC as studies in patients after prolonged epileptic seizures have clearly shown. In these patients, ADC reductions of 11%–37% have been demon-Table 2: Intralesional signal change on ADC and T2-weighted
imagesa
Patient Day
Patient 1 Day 1 Day 8 Day 17 Day 55
ADC ⫺41 10 21 50
T2 17 18 25 43
Patient 2 Day 0 Day 7 Day 14 Day 21 Day 49 Day 83 Day 207 ADC ⫺66 ⫺44 ⫺34 ⫺18 72 37 36
T2 19 20 32 46 64 48 42
Patient 3 Day 1 Day 8 Day 35 Day 42
ADC ⫺41 ⫺7 47 41
T2 15 80 86 35
Patient 4 Day 2 Day 6 Day 10 Day 14 Day 85 Day 175 ADC ⫺20 ⫺15 ⫺11 56 60 125
T2 32 50 54 87 105 43
Patient 5 Day 4 Day 12 Day 20 Day 29 Day 65
ADC ⫺17 5 10 18 30
T2 35 56 72 65 52
Patient 6 Day 2 Day 6 Day 14 Day 28 ADC ⫺51 ⫺35 63 130
T2 37 62 98 74
Patient 7 Day 2 Day 10 Day 21 Day 30 Day 66 Day 106
ADC ⫺16 5 45 50 102 105
T2 23 45 86 73 66 65
Patient 8 Day 3 Day 6 Day 9 Day 21 Day 64
ADC ⫺22 ⫺4 25 55 62
T2 25 45 57 63 66
Patient 9 Day 1 Day 8 Day 15 Day 21 Day 34
ADC ⫺24 12 32 53 59
T2 15 20 18 31 45
Patient 10 Day 3 Day 15 Day 30 Day 37 Day 51 Day 66
ADC ⫺41 ⫺25 12 27 58 62
T2 8 32 46 63 78 54
[image:4.594.51.284.70.388.2]strated, while signs of increased brain perfusion (due to the high energy demand) were noted in affected tissue.20A
reduc-tion of the ADC has been detected in different acute neuro-logic diseases (eg, stroke,21,22focal epilepsy,23toxic demyeli-nation24). We would favor an inflammatory mechanism that
could lead to disturbances of energy metabolism, namely mi-tochondrial dysfunction, and, in turn, lead to reduced diffu-sion. This would be in line with recent evidence that an aggres-sive inflammatory milieu including tumor necrosis factor-␣ and nitric oxide may lead to mitochondrial dysfunction and compromise of energy metabolism.25Furthermore, there is
experimental evidence that lesions may exhibit a reduced ADC and contrast enhancement in central nervous system in-flammation induced by intraparenchymal injection of interleukin-1.26
It is also interesting in this respect that lesions with a low ADC in our study correlated with clinical symptoms, which would be in line with mitochondrial dysfunction and subse-quent electrical compromise. Theoretically, these events might even take place in the absence of demyelination, which may be more prominent in slightly later stages of the lesion development. ADC reduction is present before MRI signs of tissue destruction become prominent and might be predomi-nantly related to parenchymal inflammation.
Most interesting, a new CSF marker of hypoxialike tissue damage in active MS lesions has recently been described, which may also point to a mechanism related to energy-me-tabolism compromise in MS lesions.27Further proposed hy-potheses have been contributions from the presence of cyto-toxic edema of oligodendroglia or hypercellularity in acute MS lesions.11These proposed mechanisms, disturbances of energy
metabolism, and cytotoxic cell swelling and hypercellularity might well contribute to reduced diffusion.
Conclusions
In a subgroup of patients with MS presenting early after new symptom onset, a transient reduction of the ADC delineated a short and very early phase of MS lesion evolution. Subsequent pseudonormalization of the ADC occurred along with signs of the development of vasogenic edema. Further studies in larger patient samples are necessary to confirm and elucidate whether the observed MRI findings indeed indicate a small subgroup of active lesions. Such studies may also clarify whether early MRI immediately after new symptoms will in-crease the detection rate of reduced diffusion in acute MS lesions.
Disclosures: Achim Gass—UNRELATED:Travel/Accommodations/Meeting Expenses Unre-lated to Activities Listed: honoraria for lecturing, travel expenses for attending meetings, and financial support for research from Bayer Schering, Biogen Idec, Merck Serono, Novartis, and Teva Neurosciences.
References
1. Guttmann CR, Ahn SS, Hsu L, et al.The evolution of multiple sclerosis lesions on serial MR.AJNR Am J Neuroradiol1995;16:1481–91
2. Kermode AG, Thompson AJ, Tofts P, et al. Breakdown of the blood-brain barrier precedes symptoms and other MRI signs of new lesions in
multiple sclerosis. Pathogenetic and clinical implications. Brain
1990;113(pt 5):1477– 89
3. Schaefer PW, Grant PE, Gonzalez RG.Diffusion-weighted MR imaging of the brain.Radiology2000;217:331– 45
4. Horsfield MA, Larsson HB, Jones DK, et al.Diffusion magnetic resonance imaging in multiple sclerosis.J Neurol Neurosurg Psychiatry1998;64(suppl 1):S80 – 84
5. Castriota-Scanderbeg A, Sabatini U, Fasano F, et al.Diffusion of water in large demyelinating lesions: a follow-up study.Neuroradiology2002;44:764 – 67 6. Werring DJ, Brassat D, Droogan AG, et al.The pathogenesis of lesions and
normal-appearing white matter changes in multiple sclerosis: a serial diffu-sion MRI study.Brain2000;123(pt 8):1667–76
7. Roychowdhury S, Maldjian JA, Grossman RI.Multiple sclerosis: comparison of trace apparent diffusion coefficients with MR enhancement pattern of le-sions.AJNR Am J Neuroradiol2000;21:869 –74
8. Cercignani M, Iannucci G, Rocca MA, et al.Pathologic damage in MS assessed by diffusion-weighted and magnetization transfer MRI. Neurology
2000;54:1139 – 44
9. Fiebach JB, Jansen O, Schellinger PD, et al.Serial analysis of the apparent diffusion coefficient time course in human stroke.Neuroradiology2002; 44:294 –98
10. Schlaug G, Siewert B, Benfield A, et al.Time course of the apparent diffusion coefficient (ADC) abnormality in human stroke.Neurology1997;49:113–19 11. Tievsky AL, Ptak T, Farkas J.Investigation of apparent diffusion coefficient
and diffusion tensor anisotropy in acute and chronic multiple sclerosis le-sions.AJNR Am J Neuroradiol1999;20:1491–99
12. Rosso C, Remy P, Creange A, et al.Diffusion-weighted MR imaging character-istics of an acute strokelike form of multiple sclerosis.AJNR Am J Neuroradiol
2006;27:1006 – 08
13. Przeklasa-Auth M, Ovbiagele B, Yim C, et al.Multiple sclerosis with initial stroke-like clinicoradiologic features: case report and literature review.
J Child Neurol2010;25:732–37
14. Balashov KE, Aung LL, Dhib-Jalbut S, et al.Acute multiple sclerosis lesion: conversion of restricted diffusion due to vasogenic edema.J Neuroimaging
2011;21:202– 04
15. Bugnicourt JM, Garcia PY, Monet P, et al.Teaching neuroimages: marked reduced apparent diffusion coefficient in acute multiple sclerosis lesion. Neu-rology2010;74:e87
16. Munoz Maniega S, Bastin ME, Armitage PA, et al.Temporal evolution of water diffusion parameters is different in grey and white matter in human isch-aemic stroke.J Neurol Neurosurg Psychiatry2004;75:1714 –18
17. Gass A, Gaa J, Sommer A, et al.Echo-planar diffusion-weighted MRI in the diagnosis of acute ischemic stroke: characterisation of tissue abnormalities and limitations in the interpretation of imaging findings[in German]. Radio-loge1999;39:695–702
18. Rocca MA, Cercignani M, Iannucci G, et al.Weekly diffusion-weighted imag-ing of normal-appearimag-ing white matter in MS.Neurology2000;55:882– 84 19. Rovira A, Pericot I, Alonso J, et al.Serial diffusion-weighted MR imaging and
proton MR spectroscopy of acute large demyelinating brain lesions: case re-port.AJNR Am J Neuroradiol2002;23:989 –94
20. Szabo K, Poepel A, Pohlmann-Eden B, et al.Diffusion-weighted and perfusion MRI demonstrates parenchymal changes in complex partial status epilepti-cus.Brain2005;128:1369 –76
21. Lovblad KO, Baird AE, Schlaug G, et al.Ischemic lesion volumes in acute stroke by diffusion-weighted magnetic resonance imaging correlate with clinical outcome.Ann Neurol1997;42:164 –70
22. Warach S, Dashe JF, Edelman RR.Clinical outcome in ischemic stroke pre-dicted by early diffusion-weighted and perfusion magnetic resonance imaging: a preliminary analysis.J Cereb Blood Flow Metab1996;16:53–59 23. Wieshmann UC, Symms MR, Shorvon SD.Diffusion changes in status
epilep-ticus.Lancet1997;350:493–94
24. McKinney AM, Kieffer SA, Paylor RT, et al.Acute toxic leukoencephalopathy: potential for reversibility clinically and on MRI with diffusion-weighted and FLAIR imaging.AJR Am J Roentgenol2009;193:192–206
25. Su KG, Banker G, Bourdette D, et al.Axonal degeneration in multiple sclerosis: the mitochondrial hypothesis.Curr Neurol Neurosci Rep2009;9:411–17 26. Blamire AM, Anthony DC, Rajagopalan B, et al.Interleukin-1beta -induced
changes in blood-brain barrier permeability, apparent diffusion coefficient, and cerebral blood volume in the rat brain: a magnetic resonance study.J Neu-rosci2000;20:8153–59