Validation of molecular dynamics simulation
Wilfred F. van Gunsteren
Oxford Centre for Molecular Sciences and New Chemistry Laboratory, University of Oxford, South Parks Road, Oxford OX1 3QR, England and Laboratory of Physical Chemistry, Swiss Federal Institute of Technology Zurich, ETH Zentrum, CH-8092 Zurich, Switzerland
Alan E. Mark
Laboratory of Physical Chemistry, Swiss Federal Institute of Technology Zurich, ETH Zentrum, CH-8092 Zurich, Switzerland
~Received 21 October 1997; accepted 14 January 1998!
How the results obtained by computer simulation of molecular systems can be validated is considered. The overall quality of the simulated properties of a molecular system will depend on~i! the quality of the theory or model,~ii!the accuracy of the interatomic interaction function or force field, ~iii! the degree of sampling, statistics and convergence reached in the simulation, ~iv! the quality of the simulation software, and~v!how competently the simulation software is used. These five validation issues are discussed and illustrated with examples. Guidelines for different members of the scientific community are formulated which are aimed at enabling and improving the validation of simulation results in the literature. © 1998 American Institute of Physics.
@S0021-9606~98!50915-4#
I. INTRODUCTION
Computer simulation of molecular systems is playing an ever growing role in academic and industrial research. In areas ranging from materials science and chemistry to phar-macy and molecular biology, computer simulation is already a part of daily practice. Using the molecular dynamics~MD! simulation method the behavior of a variety of molecular systems can be studied. These include liquids, solutions, electrolytes, polymers such as proteins, DNA, and polysac-charides, as well as membranes, liquid crystals, crystals, and zeolites.1–5 Processes such as melting, adsorption, segrega-tion, formation of molecular complexes, and protein denatur-ation can be analyzed, and phenomena such as protein sta-bility, enzyme reactivity and membrane permeability can be investigated. Such studies may lead not only to improved understanding and insight, but also to practical results such as engineered proteins or materials with properties optimized for particular applications.
Computer simulation of molecular systems requires soft-ware to calculate the interatomic interactions and to integrate the equations of motion. Developing MD simulation soft-ware for simple atomic or molecular liquids is a relatively easy task. However, when simulating biomolecular systems with many different types of atoms and interactions, using a variety of boundary conditions, very complex software is required. The software must often manipulate, simulate and analyze thousands or even tens of thousands of atoms. This situation has led to the development of simulation software packages both in academia @AMBER,6 BRUGEL,7 CEDAR,8 CHARMM,9EGO,10ENCAD,11FOCUS,12GROMACS,13GROMOS,14 MOIL,15 NAMD,16 POLARIS,17 UHBD,18 X-PLOR,19 YASP ~Ref. 20!#and by software houses@CHARMm,DISCOVER~Ref. 21!, SYBYL ~Ref. 22!#. The developers of these molecular simu-lation software packages are far outnumbered by the users of
these packages. The users are generally much less knowl-edgeable regarding the implemented algorithms and interac-tion funcinterac-tions than the developers. When using any of these software packages a scientist is inevitably confronted with the question of validation.
A basic task of all scientists is to ensure that the results they obtain can be validated. If the result of a simulation is novel or unexpected or strange, either or both of the follow-ing situations may have occurred:
~i! A new phenomenon has been found.
~ii! The results are wrong, because
~1! the model that was used is inappropriate for the applica-tion,
~2! the force field is inadequate,
~3! the results have not converged due to insufficient sam-pling,
~4! the software contains bugs,
~5! the software has been used incorrectly.
Before concluding an exciting new phenomenon has been found, situation ~ii! must be ruled out. The reply to each of these five validation questions must be no. However, it is only possible to answer these questions if,
~1! a full description of the model and algorithms is readily available,
~2! a full description of the interaction function or force field is readily available,
~3! simulation results are shown as a function of simulation length,
~4! the source code of the software can be checked,
~5! the set-up of the simulations is described in detail.
Unfortunately, these conditions are often far from being ful-filled. Software manuals tend to describe input parameters
6109
rather than algorithms. In many cases source code is not accessible, and force fields are generally not completely de-scribed in the literature. In regard to force fields, note that it is not sufficient to quote the functional form of the interac-tion funcinterac-tion and to give lists of parameters.11,24,25 The as-signment of dihedral angle types to actual proper and im-proper torsional angles in molecules, the treatment of first, second, and third covalently bound neighbors and the use of particular combination rules when calculating nonbonded in-teractions, factors rarely mentioned in the literature, should be also specified, for example.14,26
A validation of molecular models and force fields gen-erally involves a comparison of simulated with experimental data. A proper interpretation of the latter is therefore essen-tial to validation. This is briefly discussed in the next section. Every scientist who uses simulation software will be re-peatedly confronted with the five mentioned validation ques-tions. In the next section, we will elaborate on and illustrate these five issues using examples taken from our own work and the literature. The examples are only briefly described, the details being left to the referenced literature. Literature on how to perform computer simulations can be found in Refs. 1–5. In the last section of this paper we discuss what might be done by members of the scientific community to enable better validation of simulation results and reports by users of simulation software and readers of the literature.
II. FIVE VALIDATION ISSUES
When attempting to validate the results of a molecular simulation, the following issues should be considered:
~1! The quality of the theory or model. The choice of mo-lecular, atomic or electronic degrees of freedom that are explicitly simulated, the type of equations of motion used and the treatment of the boundary of the system will determine the results that can be obtained. The qual-ity of the assumptions and approximations inherent to the molecular model used will determine the accuracy of the simulated results.
~2! The accuracy of the interatomic interaction function or force field. The choice of functional form, the parameter values, the theoretical or experimental data used to cali-brate the interaction function and the calibration proce-dure will determine the accuracy of a force field. The accuracy of a force field may vary with the type of mol-ecule, the phase~gas vs liquid!and type of property that is considered.
~3! The degree of sampling, statistics, and convergence reached in the simulation. The simulation period should be much longer than the relaxation time of the property considered. The relaxation time of a property will de-pend on the type of property, the thermodynamic state
~temperature, pressure!, and the type of molecule.
~4! The quality of the simulation software. The more com-plex software becomes, the more difficult it is for soft-ware developers to ensure its correctness.
~5! How competently the simulation software is used. When using complex software with a multitude of input
param-eters, a parameter combination that induces erroneous results is easily selected.
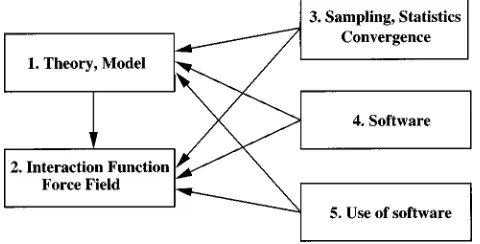
When performing tests with respect to the five men-tioned validation issues it should be kept in mind that the issues depend on each other as is illustrated by the arrows in Fig. 1. For example, a force field test makes only sense when involving converged properties simulated using bug-free software with appropriate input parameters and an adequate molecular model. Or, convergence characteristics of a given molecular property will generally not depend on the details of the interaction function.
Simulation studies are normally verified by a compari-son of simulated and experimentally measured properties of the system considered. The results of such a comparison be-tween simulation and experiment can be classified as fol-lows:
~A! Agreement between simulation and experiment is ob-tained.
This may be due to one or more of the following rea-sons:
~1! The simulation adequately reflects the experimental sys-tem.
~2! The property examined is insensitive to the details of the simulation.
~3! A compensation of errors has occurred.
~B!No agreement between simulation and experiment is ob-tained.
This may be due to one or both of the following reasons:
~1! The simulation does not reflect the experimental system. Either, the theory or model is incorrect, the force field used is inadequate, the simulation is not converged, the software is at fault, or the software is incorrectly used.
~2! The experimental data are incorrect.
[image:2.612.319.559.53.175.2]rather insensitive to the particular fold of the heptapeptide.27 Examples of observed compensation of errors~case A3!have been collected in the literature.28 When testing simulation results by comparison with experimental data it should be remembered that good agreement between simulated and ex-perimentally measured properties does not necessarily imply that the simulation is correct. The good agreement may sim-ply result from the compensation of errors.
A. First validation issue: Quality of theory or model
In this section we give a few examples of inadequate theory or modelling influencing the results of a molecular simulation.
Electrostatic interactions are extremely long range in na-ture and approximations in their treatment are therefore nec-essary. For nonpolar or nonionic systems neglect of non-bonded interactions beyond a long cutoff distance, e.g., 1.5 nm, may be a reasonably accurate approximation. For simu-lating ionic systems this model is totally inadequate, as is
demonstrated in Fig. 3, which shows the radial distribution function for chloride–chloride ion pairs obtained from a MD simulation of 40 Na1and 40 Cl2ions solvated in a periodic box with 2127 water molecules, a 1.0 M NaCl solution.29 The box was quite large, with an edge length of 4.05 nm, and so was the cutoff radius of 1.5 nm. The effect of direct trun-cation is to preferentially arrange the ions just outside the cutoff spheres ~solid line!. When a nonbonded interaction model including a reaction field force due to the dielectric medium out side the cutoff sphere is used,30 the artefacts at the cutoff distance have disappeared within 50 ps of simula-tion ~dashed line!. But, the short-range structure has also changed considerably. So, a ~truncation! model that is of reasonable quality for simulations of nonionic systems, can be totally inadequate for ionic ones.
The second example of incorrect theory or modelling concerns the decomposition of the free energy change
DF[F~B!2F~A! ~1!
corresponding to a change of the Hamiltonian of the system
DH[H~B!2H~A! ~2!
from a state A to a state B into two or more components, e.g.,DF1andDF2, that are defined spatially or with respect to individual terms of the interaction function.31,32 We as-sume that the Hamiltonian H(X), with X5A or B, can be expressed as a sum of two terms,
H~X!5H1~X!1H2~X!, ~3!
where the indices 1 and 2 refer, e.g., to spatially different parts of the molecular system X ~amino acid residues in pro-teins, solvent!or to different types of interaction terms in the force field ~covalent, van der Waals, electrostatic interac-tions!. Using statistical mechanics one can write
DF52b21 ln@
^
exp~2bDH!&
A#, ~4!where
^
¯&
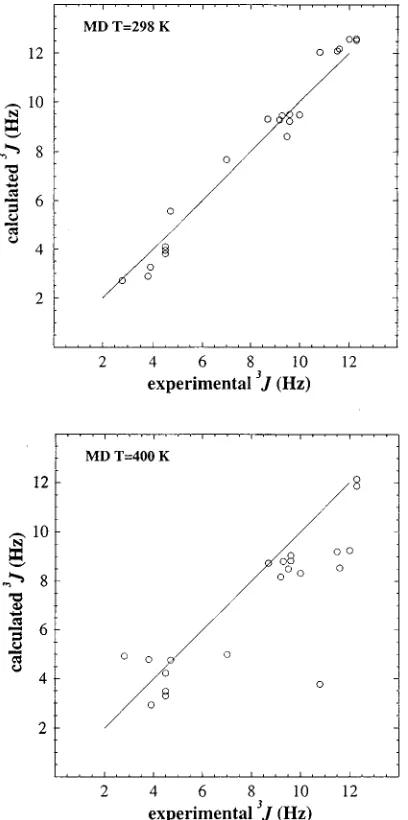
A denotes averaging over a canonical ensemblegenerated using the Hamiltonian H(A) andb21 is the prod-FIG. 2. Simulated vs experimental 3J-coupling constants for a b
[image:3.612.319.556.48.232.2]-heptapeptide in methanol. The simulated values are averages over 2 ns MD simulations at room temperature~298 K!and at elevated temperature~400 K!. Data taken from Ref. 27.
[image:3.612.73.277.50.460.2]uct of the Boltzmann constant kB and the temperature T.
Using the decomposition~3!in~4!, expanding the two expo-nential functions in Taylor series in DH1 and DH2 and the
function ln(12x) in a Taylor series in x, and keeping terms up to first order inb, one finds
DF5
^
DH1&
A2~b/2!@^
~DH1!2&
A2^
DH1&
A 2#1O~b2!
1
^
DH2&
A2~b/2!@^
~DH2!2&
A2^
DH2&
A 2#1O~b2!
2b@
^
DH1DH2&
A2^
DH1&
A^
DH2&
A#1O~b2! 5DF11DF22b@^
DH1DH2&
A2^
DH1&
A^
DH2&
A#1O~b2!, ~5! which shows that the decomposition ofDF into components
DF1 andDF2 is incorrect,
DFÞDF11DF2, ~6!
unless DH1 and DH2 are uncorrelated. The
cross-correlations betweenDH1andDH2 have been calculated for
a variety of decompositions~3!with respect to the change of solvation free energy of a set of para-substituted phenols in water.32 Correlations up to 50% were obtained, indicating that the cross-correlations between parts of a molecular sys-tem or between force field terms are generally not negligible for realistic simulations. This implies that the theory of de-composition of free energy differences into components ap-pears to be invalid for many systems of interest.31,32
A third, rather subtle example has to do with an incorrect formulation of Hamiltonian mechanics.33 The Hamiltonian of a system must be expressed as a function of the general-ized coordinates q and their conjugate momenta p, e.g.,
H~p,q!5 p
2
2m1V~q!. ~7!
The first term represents the kinetic energy of a particle with mass m. Using thermodynamic integration the free energy change as a function of the mass m is
DF[F~mB!2F~mA!5
E
mAmB
K
]H]m
L
mdm ~8!or using expression~7!
DF52
E
mA mB
K
p22m2
L
m
dm. ~9!
If the Hamiltonian is expressed as function of the generalized coordinates q and the associated velocities v5p/m, one has
H~mv,q!51 2mv
21V~q! ~10!
which leads, using Eq.~8!, to
DF51
E
mA mB
K
v22
L
mdm51E
mA mBK
p22m2
L
mdm. ~11! This expression has the wrong sign due to the use of the velocity v as variable in the Hamiltonian, which is not allowed.33A fourth example of inadequate theory or modeling is in regard to procedures to determine biomolecular structure based on nuclear magnetic resonance ~NMR! spectroscopic
or x-ray diffraction data. The standard procedure is to vary the structure of a single molecule with the aim of obtaining a molecular structure that reproduces as good as possible the experimental data ~NOE intensities or distances, J-coupling constants, crystallographic structure factor amplitudes!.34 However, the experimental data represent an average over time and space~molecules!. Fitting a single molecular ture to averaged data can lead to very wrong molecular struc-tures, as has been amply demonstrated in the literature.34–36
B. Second validation issue: Accuracy of interatomic interaction function or force field
The validation of a force field should involve as many different properties for different types of molecules and en-vironments as possible. For molecular systems three general types of properties can be distinguished.
~1! Structural properties~including first or second moments of distributions of properties that depend on molecular configuration!such as
~a! average atom positions or atom-atom distances,
~b! radius of gyration,
~c! solvent accessible surface area,
~d! NMR order parameters (S2), ~e! crystallographic temperature factors,
~f! dipole moment fluctuations (M2) leading to an esti-mate of the dielectric permittivitye,
~g! radial distribution functions (g(r)),
~h! density.
~2!Energetic properties such as
~a! heat of vaporization,
~b! free energy of solvation,
~c! heat capacity,
~d! isothermal compressibility,
~e! thermal expansion coefficient,
~f! surface tension.
~3!Dynamical properties such as
~a! diffusion constants,
~b! rotational correlation times,
~c! dielectric correlation times,
~d! viscosity.
We note that the different properties possess very differ-ent relaxation times, which means that MD simulations of very different lengths are required to obtain converged simu-lated values suitable for comparison to test or calibration data.37For example, the radial distribution functions and mo-lecular translational and rotational diffusion coefficients of liquid dimethyl sulfoxide ~DMSO!can be obtained from 50 ps simulation of 432 DMSO in a periodic box, whereas the determination of collective properties such as the dielectric permittivity or shear viscosity requires a simulation length of over 1000 ps for this system.38
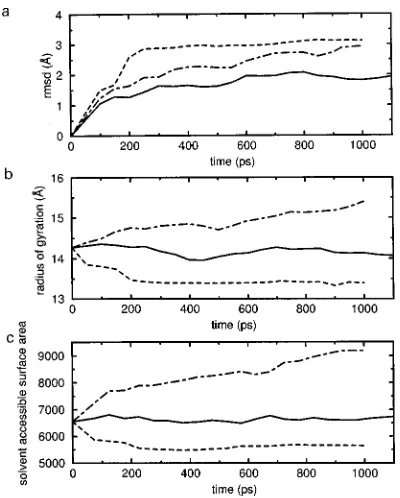
field ~dashed line! the structure becomes too compact and deviates rapidly from the starting crystal structure. The simu-lation in a periodic box with a few thousand water molecules using theGROMOS87force field40~dot–dashed line!shows a slow gradual expansion of the molecule on a time scale of hundreds of picoseconds. This implies that the ~artefactual! driving forces for this expansion are very small. In fact they were not observed in another equally long simulation of the protein BPTI.41 The simulation involving the GROMOS96 force field14 ~solid line! produces significantly better struc-tural properties. Figure 4 also illustrates that the relaxation time of structural properties of proteins lies in the range up-wards from 100 ps.
An example of a comparison of energetic properties is given in Table I.42 The relative energy and free energy of binding of para-substituted phenols as guest molecules to
a-cyclodextrin as host molecule were calculated from MD simulations of the guest molecules and of the complexes in aqueous solution. Entropic contributions to the binding seem to play an important role for these flexible molecules. From thermodynamic cycle closure the lower error bound for the
DGcalc values was estimated to be about kBT 52.5 kJ mol21. The root-mean-square deviation with the ex-perimental values is of the same order of magnitude, which implies that simulation and experiment agree within the error bound set by the extent of sampling in the simulations.
Finally, we must stress that force field validation can only be carried out using equilibrated systems and compar-ing converged average values of properties.
C. Third validation issue: Degree of sampling, statistics, and convergence
The central question regarding the third validation issue is whether the length of a MD simulation is sufficiently long to yield reliable trajectory averages of the different molecular or system properties of interest. Trajectory averages will generally only be representative when the equilibration time of the simulation, tequil, is longer than the relaxation time
trelax(Q) of the property Q,
tequil.trelax~Q!, ~12!
and when the sampling time, tsample, is much longer than
trelax(Q),
tsample@trelax~Q!. ~13!
If conditions ~12! and ~13! are not fulfilled, the trajectory average
^
Q(t)&
of the property Q will display a drift as a function of time or erratic behaviour due to the occurrence of rare events affecting the value of Q(t).The relaxation timetrelax(Q) may be long for different
reasons.
~1! The system may jump rapidly but rarely between rela-tively stable states. An example is the 180° flipping of phenylalanine side chains in a protein which is a fast, picosecond time-scale process occurring comparatively infrequently, only on a microsecond time scale. In such a case the trajectory averages will be sensitive to the num-ber of rare events that are simulated.
~2! The system may change intrinsically slow, in which case trajectory averages will display a continuous change as a function of time.
The relaxation and dynamics of the different properties occurring in a MD simulation can be analyzed by different means.
[image:5.612.75.275.48.297.2]~1! For equilibration simulations one may monitor the time series of a property Q(t), or of its average
^
Q(t)&
or fluctuations^
@Q(t)2^
Q(t)&
#2&
1/2, or calculate its auto-correlation function^
Q(t8
)Q(t8
1t)&
. The decay time of the autocorrelation function or the build-up rates of the trajectory averages give an indication oftrelax(Q). FIG. 4. Structural properties of hen egg white lysozyme ~HEWL! as afunction of MD simulation time using different force fields; vacuum simu-lation and corresponding GROMOS force field~dashed line!, simulation in water using theGROMOS87force field~dot–dashed line!and using the GRO-MOS96force field~solid line!;~a!root-mean-square positional difference for the Caatoms from the crystal starting structure~Å!,~b!radius of gyration ~Å!,~c!solvent accessible surface area~Å!. Data taken from Ref. 39.
TABLE I. Relative energy (DEcalc) and free energy (DGcalc) of binding of para-substituted phenols toa-cyclodextrin in aqueous solution. TheDEcalc values are the averaged host–guest interaction energies, whereas theDGcalc values are obtained from free energy perturbation simulations in which the guest molecules were mutated when bound to the host molecule~in a peri-odic box with 508 water molecules!and when unbound~in a periodic box with 544 water molecules!. Data taken from Ref. 42.
DEcalc DGcalc kJ mol21
DGexp
p-methylphenol 0.0 0.0 0.0
p-chlorophenol 211.2 28.1 23.9 p-cyanophenol 223.6 25.9 22.9 p-methoxyphenol 213.7 24.2 20.1 root mean square
deviation fromDGexp
[image:5.612.316.561.120.220.2]~2! When starting a simulation from a non-equilibrium ini-tial state, the rate of relaxation towards equilibrium for different properties Q(t) will give an indication of
trelax(Q).
~3! If different MD simulations starting from different initial states do not converge to the same trajectory average for property Q, it can be concluded that trelax(Q) is longer
than the simulation time.
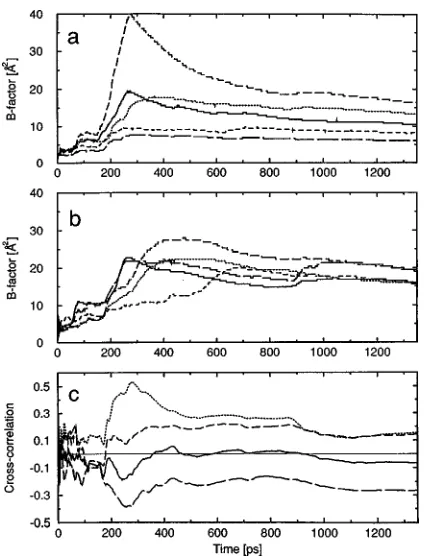
An overview of the relaxation behavior and convergence characteristics of trajectory averages for a variety of proper-ties of proteins in aqueous solution has been presented in Ref. 37. Energetic and structural quantities, NMR relaxation parameters, dielectric relaxation, free energy of complation, solvent, and ion dynamics were considered. The ex-amples shown in Ref. 37 will not be repeated here. Only the slow convergence of the atomic positional fluctuations for a protein in aqueous solution is illustrated in Fig. 5. It shows the so-called B-factor,
Bi5~8p2/3!~
^
r i 2&
2^
ri
&
2!, ~14!which is proportional to the mean square positional fluctua-tion, for a number of atoms i in the protein BPTI as a func-tion of averaging time.43Even for atoms in relatively stable helical parts of the protein the positional fluctuations are only beginning to converge after hundreds of picoseconds. The
cross-correlations between neighbouring atoms display very erratic behavior when the sampling is less than about 200 ps. These results and the cases presented in Ref. 37 illustrate that trajectory averages obtained from simulations should be ana-lyzed and interpreted with a clear eye to the limitations of sampling on the simulation time scale.
D. Fourth validation issue: Quality of the simulation software
The quality of simulation software depends primarily on the care with which it was constructed and tested by the software developers. Testing of simulation software can be done on various levels.
~1! Elementary algorithmic tests for MD simulation codes involve elementary classical mechanical laws.
~a! It can be numerically tested for each term of the force field that the force on each atom is equal to the nega-tive numerical gradient of the energy.
~b! The total energy of a system without external forces or coupling to temperature or pressure baths should re-main constant during a simulation. In other words, the root mean square fluctuation of the total energy, Etot 5Ekin1Epot, of the system,
DEtot5
^
@Etot2^
Etot&
#2&
1/2 ~15!should be small compared to the root mean square fluc-tuation of the kinetic energy,DEkin, or of the potential
energy,DEpot,44
DEtot!DEkin or DEpot. ~16!
We note that the relative fluctuation of the total energy,
DEtot/
^
Etot&
~17! is not a useful criterion for energy conservation, be-cause Etotis only defined up to a constant, whichim-plies that~17!will be arbitrarily large or small depend-ing on the choice of the origin of the energy scale.
~c! The total momentum of the system should remain con-stant in the absence of external forces or coupling to temperature or pressure baths.
~2!The simulation software is used to reproduce well-known standard results for benchmark systems from the litera-ture.
~3! The simulation software is used in practical research projects.
~4!By making the software including the source code avail-able to the scientific community, the extent of de facto testing is greatly enhanced.
[image:6.612.69.282.47.326.2]Users of standard simulation software packages could test the quality of the obtained software themselves by ex-ecuting the types of tests mentioned above. Another possi-bility is to compare results obtained using different simula-tion software packages. This opsimula-tion is not easily executed in practice, since it requires the same algorithms and force fields to be present in both simulation software packages. FIG. 5. Time development of the mean square positional fluctuation or
B-factor~14!for a number of Caatoms in the protein BPTI as calculated from a 1.4 ns MD simulation of BPTI in a periodic box with 2371 water molecules. ~a! For a-helix residues 50 ~short dash!, 51 ~long dash!, 53 ~solid!, 54~medium dash!, and 55 ~dotted!, ~b! for 310-helix residues 3
E. Fifth validation issue: How competently the simulation software is used
Any software can be used such that nonsensical results are produced. Incompatible values for input parameters can be chosen or parameter values may violate the range of ap-plicability of the molecular model or algorithm. A multifunc-tional simulation code for biomolecular systems will contain, apart from the many force field parameters, many input pa-rameters to be set by the user. For example, the simulation code of theGROMOS96simulation package has more than 100 input variables which may adopt two or more values. This situation makes it impossible to bar a determined user from using nonsensical input parameter values.
Most errors can, however, be avoided by a careful con-sideration of the physical laws involved and the physical and chemical characteristics of the molecular system of interest. For example, if the pressure of the system, P(t), is calcu-lated using the virial formula,14
P~t!52
3@Ekin~t!2W~t!#/V~t!, ~18!
the pressure will depend on the kinetic energy, Ekin(t), the
virial W(t), and the volume V(t) of the periodic box. When coupling the system to a temperature bath and to a pressure bath, the coupling to the former should be tighter than to the latter in order to avoid resonance of P(t) and Ekin(t) induced
by Eq.~18!. The MD integration time step should be chosen much smaller than the shortest oscillation period present in the system.
When reporting simulation results in the literature simu-lation parameters should be reported in order to enable read-ers to judge the setup of a simulation.
III. ENABLING AND IMPROVING VALIDATION OF SIMULATION RESULTS
Having reviewed various aspects of validation of results of MD simulations of molecular systems, the question that remains is what can be done by the various members of the
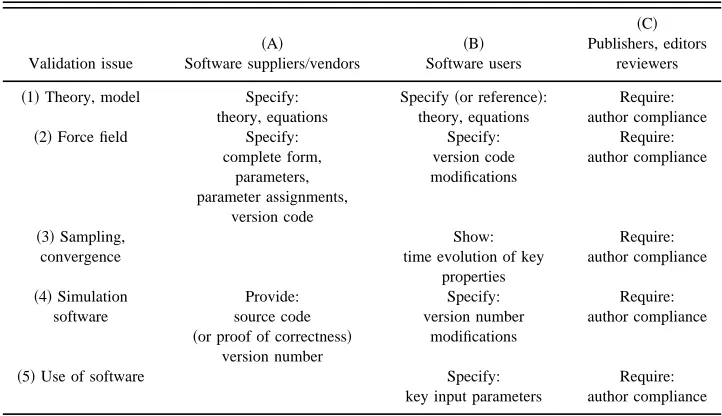
scientific community to enable and improve validation of MD simulation. Answering this question different categories of actors should be distinguished, see Table II.
~A!Software suppliers and vendors.
~B!Software users.
~C!Publishers, editors, reviewers of scientific papers. What can these different actors do with respect to the vali-dation issues~1!–~5!mentioned in the Introduction? The an-swers are summarized in Table II.
~A!Software suppliers and vendors should allow for proper validation of the software by the following actions:
~i! specify the implemented models and algorithms~issue 1!,
~ii! specify completely the force fields provided, includ-ing functional form, parameters, assignments, con-stants, and give different force field versions different version codes for identification~issue 2!,
~iii! provide source code and version number for checking and identification, or if this is impossible, provide standard results for checking ~issue 4!.
~B!Software users should allow for proper validation of their simulation results by the following actions:
~i! refer to the theory or model that was used in the simu-lation~issue 1!,
~ii! refer to the force field used giving the version code and add information on modifications that were made
~issue 2!,
~iii! present the time evolution of key properties of the molecular system for judging the degree of sampling and convergence ~issue 3!,
~iv! refer to the version number of the software that was used and specify the modifications made ~issue 4!,
~v! specify the chosen input parameters of the simulation
[image:7.612.125.486.72.280.2]~issue 5!.
TABLE II. Guidelines for different members of the scientific community aimed at enabling and improvement of validation of simulation results.
Validation issue
~A!
Software suppliers/vendors
~B! Software users
~C! Publishers, editors
reviewers
~1!Theory, model Specify: theory, equations
Specify~or reference!: theory, equations
Require: author compliance ~2!Force field Specify:
complete form, parameters, parameter assignments,
version code
Specify: version code modifications
Require: author compliance
~3!Sampling, convergence
Show: time evolution of key
properties
Require: author compliance
~4!Simulation software
Provide: source code ~or proof of correctness!
version number
Specify: version number
modifications
Require: author compliance
~5!Use of software Specify:
key input parameters
~C! Publishers, editors, and reviewers of scientific papers should enforce these guidelines for simulation software suppliers and users.
If the simulation community adheres to such guidelines, it will become much easier for a scientist applying simula-tion methods to validate the obtained simulasimula-tion results and to convince him or herself that the novel or unexpected or strange results are not due to a flawed model, an inadequate force field, insufficient sampling, software bugs or input er-rors, but instead are indicative of a new phenomenon.
ACKNOWLEDGMENT
W. F. van Gunsteren gratefully acknowledges financial support given by the Underwood Fund.
1
M. P. Allen and D. J. Tildesley, Computer Simulation of Liquids~ Claren-don, Oxford, 1987!.
2Computer Modeling of Fluids, Polymers and Solids, NATO ASI Series C293, edited by C. R. A. Catlow, S. C. Parker, and M. P. Allen~Kluwer, Dordrecht, 1990!.
3Computer Simulation in Material Science, NATO ASI Series E205, edited by M. Meyer and V. Pontikis~Kluwer, Dordrecht, 1991!.
4Computer Simulation of Biomolecular Systems, Theoretical and Experi-mental Applications, edited by W. F. van Gunsteren, P. K. Weiner, and A. J. Wilkinson~ESCOM, Leiden, 1993!, Vol. 2.
5Quantum Mechanical Simulation Methods for Studying Biological Sys-tems, edited by D. Bicout and M. Field~Springer, Berlin, 1996!. 6D. A. Pearlman, D. A. Case, J. W. Caldwell, W. S. Ross, T. E. Cheatham
III, S. DeBolt, D. Ferguson, G. Seibel, and P. Kollman, Comput. Phys. Commun. 91, 1~1995!.
7P. Delhaise, D. van Belle, M. Bardiaux, A. Alard, P. Hamers, E. van Cutsem, and S. J. Wodak, J. Mol. Graphics 3, 116~1985!.
8
M. Carson and J. Hermans, in Molecular Dynamics and Protein Structure, edited by J. Hermans~University of North Carolina, Chapel Hill, 1985!, pp. 165–166.
9B. R. Brooks, R. E. Bruccoleri, B. D. Olafson, D. J. States, S. Swami-nathan, and M. Karplus, J. Comput. Chem. 4, 187~1983!.
10
M. Eichinger, H. Grubmu¨ller, and H. Heller, User Manual for EGO-VIII, Release 1.0~Universita¨t Mu¨nchen, Mu¨nchen, 1995!.
11M. Levitt, M. Hirshberg, R. Sharon, and V. Daggett, Comput. Phys. Com-mun. 91, 215~1995!.
12A. P. Lemon, P. Dauber-Osguthorpe, and D. J. Osguthorpe, Comput. Phys. Commun. 91, 97~1995!.
13H. J. C. Berendsen, D. van der Spoel, and R. van Drunen, Comput. Phys. Commun. 91, 43~1995!.
14W. F. van Gunsteren, S. R. Billeter, A. A. Eising, P. H. Hu¨nenberger, P. Kru¨ger, A. E. Mark, W. R. P. Scott, and I. G. Tironi, Biomolecular Simu-lation: TheGROMOS96Manual and User Guide~Hochschulverlag an der ETH Zu¨rich, Zu¨rich, 1996!.
15R. Elber, A. Roitberg, C. Simmerling, R. Goldstein, H. Li, G. Verkhivker, C. Keasar, J. Zhang, and A. Ulitsky, Comput. Phys. Commun. 91, 159 ~1995!.
16M. Nelson, W. Humphrey, R. Kufrin, A. Gursoy, A. Dalke, L. Kale, R.
Skeel, and K. Schulten, Comput. Phys. Commun. 91, 111~1995!. 17F. S. Lee, Z. T. Chu, and A. Warshel, J. Comput. Chem. 14, 161~1993!. 18
J. D. Madura, J. M. Briggs, R. C. Wade, M. E. Davis, B. A. Luty, A. Ilin, J. Antosiewicz, M. K. Gilson, B. Bagheri, L. R. Scott, and J. A. McCam-mon, Comput. Phys. Commun. 91, 57~1995!.
19
A. T. Bru¨nger, X-PLOR: A System for X-ray Crystallography and NMR ~Howard Hughes Medical Institute and Yale University, New Haven, 1996!.
20F. Mu¨ller-Plathe, Comput. Phys. Commun. 78, 77~1993!. 21Molecular Simulations Inc., Waltham, MA 02154, 1997. 22
Tripos Inc., St. Louis, MO 63144, 1997.
23W. D. Cornell, P. Cieplak, C. I. Bayly, I. R. Gould, K. M. Merz, Jr., D. M. Ferguson, D. Spellmayer, T. Fox, J. W. Caldwell, and P. A. Kollman, J. Am. Chem. Soc. 117, 5179~1995!.
24A. D. MacKerrel, Jr., D. Bashford, M. Bellott, R. L. Dunbrack, Jr., M. J. Field, S. Fischer, J. Gao, H. Guo, S. Ha, D. Joseph, L. Kuchnir, K. Kuc-zera, F. T. K. Lau, C. Mattos, S. Michnick, D. T. Nguyen, T. Ngo, B. Prodham, B. Roux, B. Schlenkrich, J. Smith, R. Stote, J. Straub, J. Wiorkiewicz-Kuczera, and M. Karplus, Biophys. J. 61, A143~1992!. 25M. J. Hwang, T. P. Stockfish, and A. T. Hagler, J. Am. Chem. Soc. 116,
2515~1994!. 26
W. F. van Gunsteren and M. Karplus, Macromolecules 15, 1528~1982!. 27X. Daura, W. F. van Gunsteren, D. Rigo, B. Jaun, and D. Seebach, Chem.
Eur. J. 3, 1410~1997!. 28
W. F. van Gunsteren, in Studies in Physical and Theoretical Chemistry, edited by J.-L. Rivail~Elsevier, Amsterdam, 1990!, Vol. 71, pp. 463–478. 29P. E. Smith and W. F. van Gunsteren, in Computer Simulation of Biomo-lecular Systems, Theoretical and Experimental Applications ~ESCOM, Leiden, 1993!, Vol. 2, pp. 182–212.
30
I. G. Tironi, R. Sperb, P. E. Smith, and W. F. van Gunsteren, J. Chem. Phys. 102, 5451~1995!.
31A. E. Mark and W. F. van Gunsteren, J. Mol. Biol. 240, 167~1994!. 32
P. E. Smith and W. F. van Gunsteren, J. Phys. Chem. 98, 13735~1994!. 33W. F. van Gunsteren, in Computer Simulation of Biomolecular Systems, Theoretical and Experimental Applications~ESCOM, Leiden, 1989!, pp. 27–59.
34W. F. van Gunsteren, R. M. Brunne, P. Gros, R. C. van Schaik, C. A. Schiffer, and A. E. Torda, Meth. Enzym. 239, 619~1994!.
35C. A. Schiffer, P. Gros, and W. F. van Gunsteren, Acta Crystallogr., Sect. D: Biol. Crystallogr. 51, 85~1995!.
36
A. E. Torda, R. M. Scheek, and W. F. van Gunsteren, J. Mol. Biol. 214, 223~1990!.
37W. F. van Gunsteren, P. H. Hu¨nenberger, A. E. Mark, P. E. Smith, and I. G. Tironi, Comput. Phys. Commun. 91, 305~1995!.
38H. Liu, F. Mu¨ller-Plathe, and W. F. van Gunsteren, J. Am. Chem. Soc.
117, 4363~1995!.
39L. J. Smith, A. E. Mark, C. M. Dobson, and W. F. van Gunsteren, Bio-chemistry 34, 10918~1995!.
40
W. F. van Gunsteren and H. J. C. Berendsen, Groningen Molecular Simu-lation ~GROMOS! Library Manual ~Biomos, University of Groningen, Groningen, 1987!.
41
R. M. Brunne, K. D. Berndt, P. Gu¨ntert, K. Wu¨thrich, and W. F. van Gunsteren, Proteins 23, 49~1995!.
42A. E. Mark, S. P. van Helden, P. E. Smith, L. H. M. Janssen, and W. F. van Gunsteren, J. Am. Chem. Soc. 116, 6293~1994!.
43P. H. Hu¨nenberger, A. E. Mark, and W. F. van Gunsteren, J. Mol. Biol.
252, 492~1995!.