54
Findings of the WMT 2019 Shared Task
on Parallel Corpus Filtering for Low-Resource Conditions
Philipp Koehn Johns Hopkins University
Francisco Guzm´an Facebook AI [email protected]
Vishrav Chaudhary Facebook AI [email protected]
Juan Pino Facebook AI [email protected]
Abstract
Following the WMT 2018 Shared Task on
Par-allel Corpus Filtering (Koehn et al., 2018),
we posed the challenge of assigning sentence-level quality scores for very noisy corpora of sentence pairs crawled from the web, with the goal of sub-selecting 2% and 10% of the highest-quality data to be used to train ma-chine translation systems. This year, the task tackled the low resource condition of Nepali– English and Sinhala–English. Eleven partici-pants from companies, national research labs, and universities participated in this task.
1 Introduction
Machine Translation (MT) has experienced signif-icant advances in recent years thanks to improve-ments in modeling, and in particular neural mod-els (Bahdanau et al., 2015;Gehring et al., 2016; Vaswani et al.,2017). Unfortunately, today’s neu-ral machine translation models, perform poorly on low-resourcelanguage pairs, for which clean, par-allel training data is high-quality training data is lacking, by definition (Koehn and Knowles,2017). Improving performance on low resource lan-guage pairs is very impactful considering that these languages are spoken by a large fraction of the world population. This is a particular chal-lenge for industrial machine translation systems that need to support hundreds of languages in or-der to provide adequate services to their multilin-gual user base.
In face of the scarcity of clean parallel data, learning to translate from any multilingual noisy data such as web-crawls (e.g. from Wikipedia, Paracrawl1) is an important option.
1http://www.paracrawl.eu/
Recently, there is an increased interest in the filtering of noisy parallel corpora to increase the amount of data that can be used to train trans-lation systems (Koehn et al., 2018). While the state-of-the-art methods that use NMT models have proven effective in mining parallel sentences (Junczys-Dowmunt,2018) for high-resource lan-guages, their effectiveness has not been tested in low-resource languages. The implications of low availability of training data for parallel-scoring methods is not known yet.
The Shared Task on Parallel Corpus Filtering at the Conference for Machine Translation (WMT 2019) was organized to promote research to learn-ing from noisy data more viable for low-resource languages. Compared to last year’s edition (Koehn et al.,2018), we only provide about 50-60 million word noisy parallel data, as opposed to 1 billion words. We also provide only a few million words of clean parallel data of varying quality, instead of over 100 million words of high-quality paral-lel data. Participants developed methods to filter web-crawled Nepali–English and Sinhala–English parallel corpora by assigning a quality score for each sentence pair. These scores are used to fil-ter the web crawled corpora down to fixed sizes (1 million and 5 million English words), trained statistical and neural machine translation systems on these subsets, and measured their quality with the BLEU score on a test set of multi-domain Wikipedia content (Guzm´an et al.,2019).
2 Related Work
Although the idea of crawling the web indiscrimi-nately for parallel data goes back to the 20th cen-tury (Resnik, 1999), work in the academic com-munity on extraction of parallel corpora from the web has so far mostly focused on large stashes of multilingual content in homogeneous form, such as the Canadian Hansards, Europarl (Koehn, 2005), the United Nations (Rafalovitch and Dale, 2009;Ziemski et al., 2015), or European Patents (T¨ager,2011). A nice collection of the products of these efforts is the OPUS web site2 (Tiedemann, 2012).
2.1 Parallel Corpus Acquisition
The Paracrawl project is currently engaged in a large-scale effort to crawl text from the web. That work is funded by the European Union via the Connecting Europe Facility. The Paracrawl in-frastructure was used to generate the noisy paral-lel data for this shared task. In previous years, as part of the Paracrawl effort, a shared task on doc-ument alignment (Buck and Koehn, 2016) and a shared task on parallel corpus filtering was orga-nized (Koehn et al.,2018).
Acquiring parallel corpora from the web typi-cally goes through the stages of identifying web sites with parallel text, downloading the pages of the web site, aligning document pairs, and align-ing sentence pairs. A final stage of the process-ing pipeline filters out non parallel sentence pairs. These exist either because the original web site did not have any actual parallel data (garbage in, garbage out), only partial parallel data, or due to failures of earlier processing steps.
2.2 Filtering Noisy Parallel Corpora
In 2016, a shared task on sentence pair filtering3 was organized, albeit in the context of cleaning translation memories which tend to be cleaner than the data at the end of a pipeline that starts with web crawls.
There is a robust body of work on filtering out noise in parallel data. For example: Taghipour et al. (2011) use an outlier detection algorithm to filter a parallel corpus; Xu and Koehn (2017) generate synthetic noisy data (inadequate and non-fluent translations) and use this data to train a
clas-2http://opus.nlpl.eu 3NLP4TM 2016: Shared task
http://rgcl.wlv.ac.uk/nlp4tm2016/shared-task/
sifier to identify good sentence pairs from a noisy corpus; and Cui et al. (2013) use a graph-based random walk algorithm and extract phrase pair scores to weight the phrase translation probabili-ties to bias towards more trustworthy ones.
Most of this work was done in the context of sta-tistical machine translation, but more recent work targets neural models. Carpuat et al. (2017) fo-cus on identifying semantic differences in trans-lation pairs using cross-lingual textual entailment and additional length-based features, and demon-strate that removing such sentences improves neu-ral machine translation performance.
As Rarrick et al. (2011) point out, one type of noise in parallel corpora extracted from the web are translations that have been created by machine translation. Venugopal et al. (2011) propose a method to watermark the output of machine trans-lation systems to aid this distinction, with a neg-ligible loss of quality. Antonova and Misyurev (2011) report that rule-based machine translation output can be detected due to certain word choices, and statistical machine translation output can be detected due to lack of reordering. It is notable that none of the participants in our shared task have tried to detect machine translation.
There is a rich literature on data selection which aims at sub-sampling parallel data relevant for a task-specific machine translation system (Axelrod et al.,2011). van der Wees et al.(2017) find that the existing data selection methods developed for statistical machine translation are less effective for neural machine translation. This is different from our goals of handling noise since those methods tend to discard perfectly fine sentence pairs that are just not relevant for the targeted domain. Our task is focused on data quality that is relevant for all domains.
2.3 Impact of Noise on Neural Machine
Translation
Neural machine translation model training may combine data selection and model training, taking advantage of the increasing quality of the model to better detect noisy data or to increasingly focus on cleaner parts of the data (Wang et al.,2018;Kumar et al.,2019).
2.4 Sentence Embeddings
Bouamor and Sajjad(2018) learned sentence em-beddings for the source and target languages and selected the nearest translation from a list of can-didate sentences for a given source sentence using a classifier. Guo et al.(2018) leveraged hard neg-atives to correctly identify translation pairs.
Artetxe and Schwenk (2018) use multilingual sentence embeddings to compute cosine similarity between the source and the target sentence. They further normalize the score by the average cosine similarity of the nearest neighbors for the given sentence pair. Their method has shown promis-ing results in filterpromis-ing WMT Paracrawl data and has achieved state-of-the-art performance on the BUCC corpus mining task.
2.5 Findings of the 2018 Shared Task
The WMT 2018 Shared Task on Parallel Corpus Filtering (Koehn et al.,2018) attracted 18 submis-sions in a high resource setup. Not surprisingly, due to the large number of submissions, many different approaches were explored for this task. However, most participants used a system using three components: (1) pre-filtering rules, (2) scor-ing functions for sentence pairs, and (3) a classifier that learned weights for feature functions.
Pre-filtering rules. Some of the training data
can be discarded based on simple deterministic fil-tering rules. These may include rules may con-sider sentence length, number of real words vs. other tokens, matching names, numbers, dates, email addresses, or URLs, too similar sentences (copied content), and language identification ( Pin-nis,2018;Lu et al.,2018;Ash et al.,2018).
Scoring functions. Sentence pairs that pass the
pre-filtering stage are assessed with scoring func-tions which provide scores that hopefully corre-late with quality of sentence pairs. Participants used a variety of such scoring functions, including language models, neural translation models and lexical translation probabilities, e.g., IBM Model 1 scores. (Junczys-Dowmunt, 2018;Rossenbach et al.,2018;Lo et al.,2018).
Learning weights for scoring functions. Given
a large number of scoring functions, simply av-eraging their resulting scores may be inadequate. Learning weights to optimize machine translation system quality is computationally intractable due to the high cost of training these systems to eval-uate different weight settings. A few participants used instead a classifier that learns how to distin-guish between high-quality and low-quality sen-tence pairs. High-quality sensen-tence pairs are se-lected from existing high-quality parallel corpora, while low-quality sentence pairs are either synthe-sized by scrambling high-quality sentence pairs or by using the raw crawled data (S´anchez-Cartagena et al.,2018).
Use of embeddings. While the participant’s
methods were dominated by non-neural compo-nents, sometimes using neural machine transla-tion outputs and scores, some participants used word and sentence embeddings. Given cross-lingual word embeddings, sentence match scores based on the difference between the average of the word embeddings (Paetzold, 2018), or, for each word in the sentence, the closest match in the corresponding sentence (Hangya and Fraser, 2018). Matching of word embeddings may also be done monolingually, after machine translat-ing the foreign sentence into English (Lo et al., 2018). Cross-lingual word embeddings were ob-tained using uses monolingual word embedding spaces which were aligned with an unsupervised method, or using pre-trained cross-lingual word embeddings. Littell et al. (2018) used monolin-gual sentence embedding spaces to discount out-liers. Pham et al. (2018) use a neural model that takes a sentence pair and predicts a matching score.
Some participants made a distinction between unsupervised methods that did not use existing parallel corpora to train parts of the system, and supervise methods that did. Unsupervised meth-ods have the advantage that they can be readily deployed for language pairs for which no seed par-allel corpora exist.
3 Low-Resource Corpus Filtering Task
Specifically, we provided a very noisy 50-60 million word (English token count) Nepali– English and Sinhala–English corpora crawled from the web using the Paracrawl processing pipeline (see Section 4.4 for details). We asked participants to generate sentence-level quality scores that allow selecting subsets of sentence pairs that amount to (a) 1 million words, and (b) 5 million words, counted on the English side. These values were chosen as an approximation to the conditions on the WMT 2018 task. The result-ing subsets were scored by buildresult-ing a statistical phrase-based machine translation system (Koehn et al.,2007) and a neural machine translation sys-tem (Ott et al., 2019) trained on this data, and then measuring their BLEU score on theflores
Wikipedia test sets (Guzm´an et al.,2019).
Participants in the shared task submitted a file with quality scores, one per line, corresponding to the sentence pairs. Scores are only required to have the property that higher scores indicate bet-ter quality. The scores were uploaded to a Google Drive folder which remains publicly accessible.4
For development purposes, we released config-uration files and scripts that mirror the official test-ing procedure with a development test set. The de-velopment pack consists of:
• A script to subsample corpora based on qual-ity scores.
• A Moses configuration file to train and test a statistical machine translation system. • fairseqscripts to train and test a neural
ma-chine translation system.
• The flores-dev set of Wikipedia transla-tions as development set.
• The flores-devtest set of Wikipedia translations as development test set.
The web site for the shared task5 provided de-tailed instructions on how to use these tools to replicate the official testing environment.
4 Data
We provided three types of data for this shared task: (1) clean parallel and monolingual data, in-cluding related language data in Hindi, to train models that aid with the filtering task, (2) the noisy
4https://bit.ly/2IoOXOr 5http://www.statmt.org/wmt19/
parallel-corpus-filtering.html
Corpus Sentence English
Pairs Words
Bible (two translations) 61,645 1,507,905
Global Voices 2,892 75,197
Penn Tree Bank 4,199 88,758
GNOME/KDE/Ubuntu 494,994 2,018,631
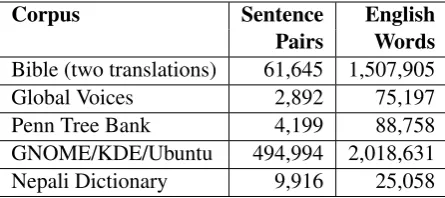
[image:4.595.308.531.63.162.2]Nepali Dictionary 9,916 25,058
Table 1: Provided clean parallel data for Nepali.
parallel data crawled from the web which partici-pants have to score for filtering, and (3) develop-ment and test sets that are used to evaluate transla-tion systems trained on filtered data.
4.1 Clean Parallel Data
The main distinction between this year’s version of the parallel corpus filtering task and last year’s version is the amount of provided clean paral-lel data. For both Nepali–English and Sinhala– English, only few parallel corpora are available and these are of questionable relevance due to their peculiar domains.
For Nepali (see Table 1 for detailed statis-tics), the largest data sets are the Bible which we provided with two English translations and the GNOME/KDE/Ubuntu localization data collected by OPUS6 (Tiedemann, 2012). The type of text found in these corpora are quite different from language found on the Internet. The data sets with more conventional language, a partial trans-lation of the Penn Tree Bank by the Language Re-source Association (GSK) of Japan and Interna-tional Development Research Center (IDRC) of Canada, through PAN Localization project7 and the citizen journalist news sites Global Voices8, are much smaller (less than 100,000 words each). We also provide a Nepali–English bilingual dictio-nary with 9,916 entries (Pavlick et al.,2014).
For Sinhala (see Table2for detailed statistics), we only provide two data sources: a fairly large corpus of volunteer translation of subtitles and the GNOME/KDE/Ubuntu localization data collected by OPUS. The Open Subtitles corpus is of mixed quality and most of the language is casual.
Corpus Sentence English
Pairs Words
Open Subtitles 601,164 3,594,769
[image:5.595.76.294.65.120.2]GNOME/KDE/Ubuntu 45,617 150,513
Table 2: Provided clean parallel data for Sinhala.
Corpus Sentences Words
Wikipedia
Sinhala 155,946 4,695,602
Nepali 92,296 2,804,439
English 67,796,935 1,985,175,324 CommonCrawl
Sinhala 5,178,491 110,270,445
Nepali 3,562,373 102,988,609
English 380,409,891 8,894,266,960
Table 3: Provided clean monolingual data.
4.2 Clean Monolingual Data
Monolingual data is always available in much larger quantities, and we provided data from two sources: Wikipedia and CommonCrawl. Both contain language that is similar to what is expected in the noisy web data to be filtered.
We filtered the data to eliminate overlap with the development and test sets. See Table3for de-tailed statistics.
4.3 Related Language Data
Nepali uses the same Devanagari script as Hindi and the languages are closely related. Neural machine translation models for low-resource lan-guage pairs have particularly benefited from train-ing data in other language pairs, so parallel Hindi– English data and monolingual Hindi data may be beneficial to train models for our shared task.
As shown in Table 4, we provide a relatively large 20 million word parallel corpus and almost 2 billion words of monolingual Hindi. This data was created from a variety of public domain sources and corpora developed at the Center for Indian Language Technology, IIT Bombay ( Kunchukut-tan et al.,2018).
4.4 Noisy Parallel Data
The noisy parallel corpora from Paracrawl are the outcome of a processing pipeline that aimed at high recall at the cost of precision, so they are very noisy. They exhibit noise of all kinds: wrong lan-guage in source and target, sentence pairs that are
Corpus Sentences Words
Hindi–English 1,492,827 20,667,240
[image:5.595.87.279.157.285.2]Hindi 67,796,935 1,985,175,324
Table 4: Hindi corpora released as related language data from the IIT Bombay English-Hindi Corpus.
Sentence English
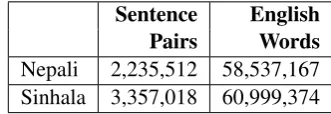
Pairs Words
Nepali 2,235,512 58,537,167
Sinhala 3,357,018 60,999,374
Table 5: Noisy parallel data to be filtered
(de-duplicated raw output Paracrawl pipeline).
not translations of each other, bad language (inco-herent mix of words and non-words), incomplete or bad translations, etc.
We used the processing pipeline of the Paracrawl project to create the data, using the clean parallel data to train underlying models such as the dictionary used by Hunalign (Varga et al., 2007) and a statistical translation model used by the document aligner. One modification was nec-essary to run the pipeline for Nepali due to the end-of-sentence symbol of the script that was pre-viously not recognized by the sentence splitter.
The provided parallel corpus is the raw output of the crawling pipeline, with sentence pairs de-duplicated but otherwise no further filtering per-formed. See Table 5 for statistics of the corpus and Table6for some example sentences.
4.5 Development and Test Sets
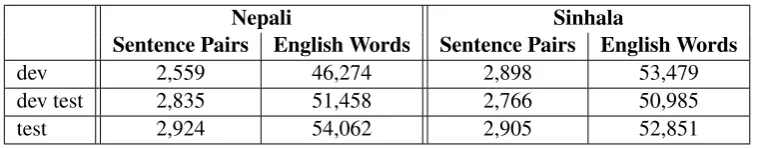
For test and development purposes, we use the flores Wikipedia data-sets for Nepali– English and Sinhala–English (Guzm´an et al., 2019). These sets are multi-domain, that is they were sampled from Wikipedia documents with a diverse set of topics. In Table 7 we present the statistics of these sets.
The official scoring of machine translation sys-tems generated from the subsampled data sources is done on thetestset.
5 Evaluation Protocol
[image:5.595.331.497.160.217.2]Nepali→English
Source previous आधारभूतकुराहरूतपाईंलेहाउससुधारगनर्केगनर्सकेन
Target previous Basic Things You Could Do To Improve Your House
Source योिभिडयो Batesville माएकचेलाअबसम्मेलनहो, सुश्री. कृपयािभिडयोरअिडयोगुणस्तरक्षमा
Target This video is from a Disciple Now conference in Batesville, MS. Please forgive the video and audio quality
Sinhala→English
Source Paintballing, හාතව%ෙබාෙහ(!
Target Paintballing, and many more!
Source ස*ප%මu./ටuව » ස*ප% » ගැස3ප%රඅංක 2061/10 – 2018 මා89 05 වැ:ස;දා – 2018.03.05
[image:6.595.110.493.331.405.2]Target Home » Resources » Gazette NO. 2061/10 – MONDAY, MARCH 05, 2018
Table 6:Examples of good sentence pairs from the noisy corpus for Nepali–English and Sinhala–English.
Nepali Sinhala
Sentence Pairs English Words Sentence Pairs English Words
dev 2,559 46,274 2,898 53,479
dev test 2,835 51,458 2,766 50,985
test 2,924 54,062 2,905 52,851
Table 7: Statistics for theflorestest sets used to evaluate the machine translation systems trained on the
subsam-pled data sets. Word counts are obtained withwcon tokenized text.
5.1 Participants
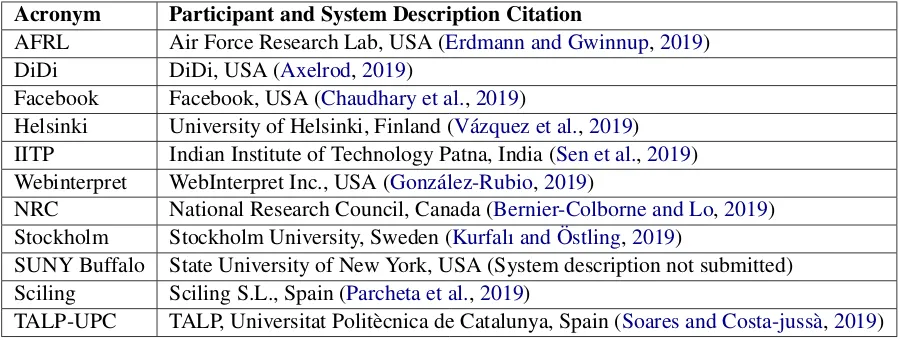
We received submissions from 11 different orga-nizations. See Table8for the complete list of par-ticipants. The participant’s organizations are quite diverse, with 4 participants from the United States, 2 participants from Spain, and 1 participant each from Canada, Sweden, India, and Finland. 5 of the participants are universities, 4 are companies, and 2 are national research organizations. There was little overlap between this year’s shared task and last year’s high-resource shared task. Only AFRL, NRC, and Webinterpret participated also last year. Each participant submitted up to 4 different sets of scores, typically a primary and contrastive sub-mission, resulting in a total of 21 different submis-sions for Nepali and 23 different submissubmis-sions for Sinhala that we scored.
5.2 Methods used by Participants
Almost all submissions used basic filtering rules as a first filtering step. These rules typically in-volve language identification and length
consid-erations to remove too long or length-wise mis-matched sentence pairs. Some also remove sen-tence pairs where a specific number occurred on one side but not the other. For some submissions this removed over 80% of the data (Kurfalı and
¨
Ostling,2019;Soares and Costa-juss`a,2019).
A novel method that was central to the best-performing submission was the use of cross-lingual sentence embeddings that were directly trained from parallel sentence pairs (Chaudhary et al., 2019). Other submissions used
monolin-gualword embeddings. These were first trained
monolingually for each language from monolin-gual data. The resulting embedding spaces were mapped either in an unsupervised fashion (Soares and Costa-juss`a, 2019) or based on a dictionary learned from the parallel data (Kurfalı and ¨Ostling, 2019). Bernier-Colborne and Lo (2019) use both monolingually trained word embeddings aligned in an unsupervised fashion and bilingually trained word embeddings.
Acronym Participant and System Description Citation
AFRL Air Force Research Lab, USA (Erdmann and Gwinnup,2019)
DiDi DiDi, USA (Axelrod,2019)
Facebook Facebook, USA (Chaudhary et al.,2019)
Helsinki University of Helsinki, Finland (V´azquez et al.,2019) IITP Indian Institute of Technology Patna, India (Sen et al.,2019) Webinterpret WebInterpret Inc., USA (Gonz´alez-Rubio,2019)
NRC National Research Council, Canada (Bernier-Colborne and Lo,2019) Stockholm Stockholm University, Sweden (Kurfalı and ¨Ostling,2019)
SUNY Buffalo State University of New York, USA (System description not submitted) Sciling Sciling S.L., Spain (Parcheta et al.,2019)
[image:7.595.74.526.62.232.2]TALP-UPC TALP, Universitat Polit`ecnica de Catalunya, Spain (Soares and Costa-juss`a,2019)
Table 8: Participants in the shared task.
system on the clean data, then use it totranslate
the non-English sideinto English and use
mono-lingual matching methods to compare it against the English side of the parallel corpus. Different matching metrics were used: METEOR (Erdmann and Gwinnup, 2019), Levenshtein distance (Sen et al.,2019), or BLEU (Parcheta et al.,2019),
Several submissions considered vocabulary
coveragein their methods, preferring to add
sen-tence pairs to the limited set that increase the num-ber of words and n-grams covered (Erdmann and Gwinnup,2019;Bernier-Colborne and Lo,2019; Gonz´alez-Rubio,2019).
One of the best-performing methods under last year’s high resource setting wasdual conditional cross-entropy, i.e. building neural machine trans-lation models on the clean data and considering the translation scores from forced translation of the parallel corpus. One submission used this method Chaudhary et al. (2019), while others applied the same idea to monolingual language model scores (Axelrod, 2019; Parcheta et al., 2019).
Several other scoring functions were used, to name a few: cross-lingual language models (Bernier-Colborne and Lo, 2019), monolingual language models (V´azquez et al., 2019), IBM Model 1 word translation scores (Gonz´alez-Rubio, 2019), and the existing off-the-shelf tools like Zip-porah and Bicleaner (Chaudhary et al.,2019).
Some submissions combined multiple scoring functions withensemblemethods which may be optimize to distinguish between clean parallel data and synthetic noise data (Chaudhary et al.,2019; Bernier-Colborne and Lo, 2019; V´azquez et al., 2019).
AFRL Erdmann and Gwinnup(2019) use a cov-erage metric and quality metric. The cover-age metric discourcover-ages the addition of sen-tence pairs that have vocabulary already in-cluded in the selected set. The quality metric is based on comparing the machine transla-tion of the foreign sentence with the English sentence using the METEOR machine trans-lation metric.
DiDi Axelrod (2019) uses dual cross-entropy based on monolingual language models to find sentence pairs where each side has sim-ilar probability. They also employ so-called cynical data selection that prefers to select a representative subset. Additional simple fea-tures are length ratio and using character set-based language identification.
Facebook Chaudhary et al.(2019) use an
ensem-ble of methods: matching of cross-lingual sentence embeddings (their best feature), dual cross entropy based on neural translation model scores, and the open source tools Zip-porah and Bicleaner.
NRC Bernier-Colborne and Lo (2019) first em-ploy filtering rules based on language ID, length ratio, mismatched numbers, and near-duplicates. They use the cross-lingual se-mantic evaluation metric Yisi-2 that relies on cross-lingual word embeddings and a Trans-former model based on cross-lingual lan-guage model pre-training (XLM) that is op-timized to distinguish between clean parallel data and synthetic noisy parallel data. Final scores are re-ranked to increase coverage.
Sciling Parcheta et al.(2019) build machine trans-lation models on the clean data , including the use of the Hindi–English corpus (removing some sentence pairs based on cross-entropy language model scores), translate the non-English side of the noisy data and measure the similarity of the machine translation and the given English sentence with the BLEU score. They also use filtering rules for sen-tence length, or much overlap between source and target sentence, and language identifica-tion.
Stockholm Kurfalı and ¨Ostling (2019) first use filtering rules based on excessive amount of numbers or too few actual words (vs. non-word tokens), sentence length, wrong script, and too long words. This removes over 80% of the data. They build monolingual word embeddings using FastText and learn a pro-jection between the spaces based on word translations distilled from word alignments of the parallel data. Sentence similarity is com-puted based on the cosine between each En-glish word’s word vector and the best match-ing projected word vectors in the other lan-guage.
TALP-UPC Soares and Costa-juss`a (2019)
em-ploy an unsupervised approach (ignoring the clean parallel data). They train monolin-gual word embeddings using FastText and align them in unsupervised fashion. Sen-tence pairs are scored based on Word Mover’s Distance. They also use basic filtering rules based on sentence length, language identifi-cation, and number mismatches which alto-gether removes over 80% of the data.
Helsinki V´azquez et al. (2019) first clean the
provided clean parallel data by employing a
number of filtering rules based on sentence length, sentences with long words (over 40 characters), sentences with XML or HTML tags, and sentences in the wrong script (Latin, Devanagari, or Sinhala). This removes about 20% of the data which is then word aligned to obtain bilingual dictionaries. In addition to a word alignment score, the noisy training data is filtered with several scoring functions: lan-guage models, lanlan-guage identification, ratio of characters in the correct script, punctua-tion, number matching, and length mismatch.
Webinterpret Gonz´alez-Rubio(2019) first apply
filtering rules based on language identifica-tion and sentence length. Coverage ranking incrementally adds sentence pairs to increase vocabulary and n-gram coverage. Adequacy ranking considers IBM Model 1 word trans-lation scores.
5.3 Subset Selection
We provided to the participants a file containing one sentence pair per line (see Section 4.4) each for the two languages. A submission to the shared task consists of a file with the same number of lines, with one score per line corresponding to the quality of the corresponding sentence pair.
To evaluate a submitted score file, we selected subsets of a predefined size, defined by the number of English words (1M or 5M).
Selecting a subset of sentence pairs is done by finding a threshold score, so that the sentence pairs that will be included in the subset have a quality score at and above this threshold. In some cases, a submission assigned this threshold score to a large number of sentence pairs. Including all of them would yield too large a subset, excluding them yields too small a subset. Hence, we randomly included some of the sentence pairs with the exact threshold score to get the desired size in this case.
5.4 Evaluation System Training
Given a selected subset of a given size for a system submission, we built statistical (SMT) and neu-ral machine translation (NMT) systems to evaluate the quality of the selected sentence pairs.
--arch transformer --share-all-embeddings --encoder-layers 5 --decoder-layers 5 --encoder-embed-dim 512 --decoder-embed-dim 512 --encoder-ffn-embed-dim 2048 --decoder-ffn-embed-dim 2048 --encoder-attention-heads 2 --decoder-attention-heads 2 --encoder-normalize-before --decoder-normalize-before --dropout 0.4
--attention-dropout 0.2 --relu-dropout 0.2 --weight-decay 0.0001 --label-smoothing 0.2
--criterion label smoothed cross entropy --optimizer adam
--adam-betas ’(0.9, 0.98)’ --clip-norm 0
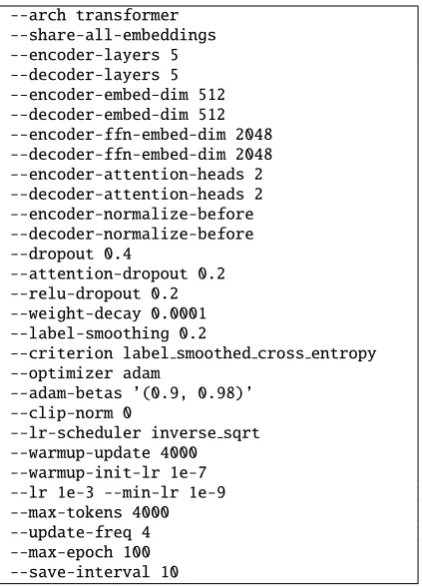
[image:9.595.77.289.60.354.2]--lr-scheduler inverse sqrt --warmup-update 4000 --warmup-init-lr 1e-7 --lr 1e-3 --min-lr 1e-9 --max-tokens 4000 --update-freq 4 --max-epoch 100 --save-interval 10
Figure 1: The baselinefloresmodel settings9 for the
NMT training withfairseq
of 5, maximum sentence length of 80, lexical-ized reordering (hier-mslr-bidirectional-fe), fast-align for word fast-alignment withgrow-diag-final-and symmetrization, tuning with batch-MIRA, no op-eration sequence model, 5-gram language model trained on the English side of the subset with no additional data, and decoder beam size of 5,000 hypotheses.
NMT For neural machine translation, we used
fairseq(Ott et al.,2019) transformer model with the parameter settings shown in Figure1. Prepro-cessing was done with sentence piece for a 5000 subword vocabulary on tokenized text using the Moses tokenizer (but no truecasing was used). De-coding was done with beam size 5 and length nor-malization 1.2. Training a system for the 1 million, and 5 million subsets took about 3, and 13 hours, respectively, on a single GTX 1080ti GPU. Scores on the test sets were computed with Sacrebleu (Post,2018). We report case-insensitive scores.
9https://github.com/facebookresearch/
flores#train-a-baseline-transformer-model
6 Results
In this section we present the final results of the shared task evaluation. We added an additional condition at 2 million English words, to better ob-serve tendencies.
6.1 Core Results
The official results are reported in Table9(Nepali) and Table 10 (Sinhala). The tables contains the BLEU scores for
• development test set and final test set • statistical and neural machine translation • 1, 2, and 5 million word subsets.
The official scoring is for the 1 million and 5 million word data settings on the final test set. In the table, we highlight cells for the best scores for each of these settings, as well as scores that are close to it. Results for the unofficial 2 million word baseline are shown without highlighting.
For both language pairs, the best scores are achieved for the 1 million word data condition for the neural machine translation model (6.9 for Nepali and 6.4 for Sinhala). This is not the case for all submissions. The better performance for neural systems than for statistical systems with this lit-tle data is contrary to earlier findings (Koehn and Knowles, 2017), indicating that recent progress, such as the Transformer model (Vaswani et al., 2017), have addressed this challenge to some de-gree. However, for some submissions, such as AFRL 50k, SMT scores are higher than NMT scores (4.0 vs. 2.7 for Nepali, 3.8 vs. 3.0 for Sin-hala for AFRL 50k).
Scores between the submissions differ more for neural machine translation systems than for statis-tical machine translation systems. For instance, for the Nepali 1 million word data condition, the difference between the best and the second best participant’s submission is 0.2 for SMT but 1.4 for NMT. For the Nepali 5 million word data condi-tion, almost all systems have BLEU scores around 4 for SMT, but NMT scores range from 0.2 to 3.4. This confirms earlier findings (cite noise) that sta-tistical machine translation is more robust towards noise. So better quality for neural machine trans-lation under low resource conditions requires good noise filtering methods.
Nepali 1 million 2 million 5 million
SMT NMT SMT NMT SMT NMT
Submission test devt test devt test devt test devt test devt test devt
AFRL 50k 4.0 3.8 2.7 2.5 4.2 3.8 3.6 3.6 4.5 4.4 3.4 3.2
AFRL 150k 1.5 3.6 2.3 2.4 4.1 4.0 2.0 2.0 4.7 4.4 2.7 2.5
Facebook main 4.2 4.0 6.8 6.9 4.6 4.3 5.9 6.3 4.6 4.1 2.8 2.9 Facebook contrastive 4.2 4.0 6.9 6.6 4.6 4.3 5.9 6.1 4.6 4.0 2.5 2.4
Helsinki 3.2 3.1 0.9 0.9 3.9 3.5 1.4 1.5 4.3 4.0 1.1 1.1
Helsinki contrastive 1.3 1.2 0.1 0.1 2.0 1.6 0.1 0.1 3.8 3.8 0.9 0.8
IITP 3.8 3.6 5.5 5.9 4.4 4.0 3.3 3.6 4.3 4.0 1.3 1.2
IITP geom 3.9 3.6 5.3 5.6 4.3 4.1 3.6 3.9 4.3 4.0 1.3 1.2
NRC ensemble 4.1 3.7 4.6 4.5 4.5 4.2 3.3 3.4 4.3 4.2 1.1 1.2
NRC xlm 3.9 3.5 4.0 3.8 4.3 3.9 3.2 3.1 4.5 4.2 1.4 1.4
NRC yisi-2-sup 3.5 3.3 3.1 3.1 3.9 3.9 1.5 1.4 4.1 4.0 1.3 1.4 NRC yisi-2-unsup 4.0 3.5 3.7 3.8 4.2 4.2 2.4 2.3 4.1 4.4 1.0 1.0
Stockholm 4.0 3.4 4.2 4.2 4.0 3.6 3.2 3.1 3.8 3.5 1.2 1.2
Stockholm ngram 2.8 2.7 0.3 0.3 3.1 2.7 0.6 0.6 3.6 3.5 0.6 0.6 SUNY Buffalo 1.8 1.4 0.1 0.1 3.0 2.7 0.1 0.1 4.1 4.0 0.8 0.8
Sciling 2.9 2.5 3.5 3.6 3.4 3.2 5.1 5.5 4.1 3.9 3.3 3.2
[image:10.595.92.508.89.334.2]TALP-UPC primary 0.5 0.5 0.0 0.0 1.2 1.1 0.1 0.1 3.1 3.0 0.2 0.2 TALP-UPC secondary 0.1 0.1 0.1 0.1 0.2 0.1 0.2 0.1 0.4 0.5 0.2 0.1 Webinterpret primary 3.4 3.2 3.1 2.8 3.9 3.8 2.4 2.5 3.3 3.0 2.6 2.5 Webinterpret cov 2.9 2.9 0.5 0.3 3.7 3.5 1.6 1.7 4.2 4.1 2.4 2.3 Webinterpret prob 3.5 3.4 3.6 3.0 4.0 3.7 2.2 2.2 4.2 4.1 2.4 2.3
Table 9: Results for Nepali: BLEU scores are reported for systems trained on 1, 2, and 5 million word subsets of the data, subsampled based on the quality scores provided by the participants.
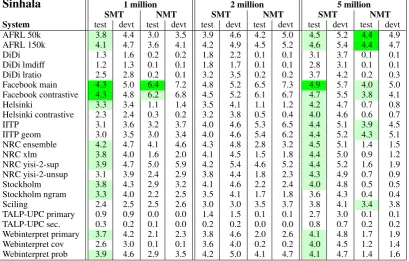
Sinhala 1 million 2 million 5 million
SMT NMT SMT NMT SMT NMT
System test devt test devt test devt test devt test devt test devt
AFRL 50k 3.8 4.4 3.0 3.5 3.9 4.6 4.2 5.0 4.5 5.2 4.4 4.9
AFRL 150k 4.1 4.7 3.6 4.1 4.2 4.9 4.5 5.2 4.6 5.4 4.4 4.7
DiDi 1.3 1.6 0.2 0.2 1.8 2.2 0.1 0.1 3.1 3.7 0.1 0.1
DiDi lmdiff 1.2 1.3 0.1 0.1 1.8 1.7 0.1 0.1 2.8 3.1 0.1 0.1 DiDi lratio 2.5 2.8 0.2 0.1 3.2 3.5 0.2 0.2 3.7 4.2 0.2 0.3 Facebook main 4.3 5.0 6.4 7.2 4.8 5.2 6.5 7.3 4.9 5.7 4.0 5.0 Facebook contrastive 4.3 4.8 6.2 6.8 4.5 5.2 6.1 6.7 4.7 5.5 3.8 4.1
Helsinki 3.3 3.4 1.1 1.4 3.5 4.1 1.1 1.2 4.2 4.7 0.7 0.8
Helsinki contrastive 2.3 2.4 0.3 0.2 3.2 3.8 0.5 0.4 4.0 4.6 0.6 0.7
IITP 3.1 3.6 3.2 3.7 4.0 4.6 5.3 6.5 4.4 5.1 3.9 4.5
IITP geom 3.0 3.5 3.0 3.4 4.0 4.6 5.4 6.2 4.4 5.2 4.3 5.1
NRC ensemble 4.2 4.7 4.1 4.6 4.3 4.8 2.8 3.2 4.5 5.1 1.4 1.5
NRC xlm 3.8 4.0 1.6 2.0 4.1 4.5 1.5 1.8 4.4 5.0 0.9 1.2
NRC yisi-2-sup 3.9 4.7 5.0 5.9 4.2 5.4 4.6 5.2 4.4 5.2 1.6 1.9 NRC yisi-2-unsup 3.1 3.9 2.4 2.9 3.8 4.4 1.8 2.3 4.3 4.9 0.7 0.9
Stockholm 3.8 4.3 2.9 3.2 4.1 4.6 2.2 2.4 4.0 4.8 0.5 0.5
Stockholm ngram 3.3 4.0 2.2 2.5 3.5 4.1 1.7 1.8 3.6 4.3 0.4 0.4
Sciling 2.4 2.5 2.5 2.6 3.0 3.0 3.5 3.7 3.8 4.1 3.4 3.8
TALP-UPC primary 0.9 0.9 0.0 0.0 1.4 1.5 0.1 0.1 2.7 3.0 0.1 0.1 TALP-UPC sec. 0.3 0.2 0.1 0.0 0.2 0.2 0.0 0.0 0.8 0.7 0.2 0.2 Webinterpret primary 3.7 4.2 2.1 2.3 3.8 4.6 2.0 2.6 4.1 4.8 1.7 1.9 Webinterpret cov 2.6 3.0 0.1 0.1 3.6 4.0 0.2 0.2 4.0 4.5 1.2 1.4 Webinterpret prob 3.9 4.6 2.9 3.5 4.2 5.0 4.1 4.7 4.1 4.7 1.4 1.6
[image:10.595.97.507.436.697.2]scores than the smaller and cleaner 1 million sub-sets, for almost all submissions. However, for neu-ral machine translation the opposite is true.
This is a pretty striking piece of evidence that the adage of more data is better data of the sta-tistical world of yesteryears is no longer true in todays neural age. The best submission’s NMT score drops from 6.9 to 2.5 BLEU for Nepali and from 6.4 to 4.0 BLEU for Sinhala between the 1 million and the 5 million conditions. More data may be quite harmful, if it is of lesser quality. Al-ternatively, more research is needed into making neural machine translation models robust to noise in training.
6.2 Additional Subset Sizes
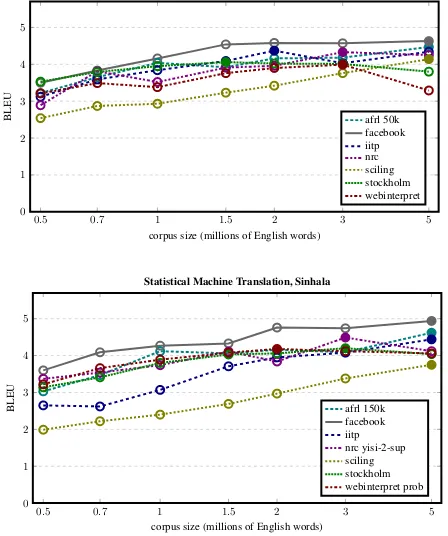
Since we were interested in the shape of the curve of how different corpus sizes impact ma-chine translation performance, we selected addi-tional subset sizes. Specifically, in addition to the 1, 2 and 5 million word corpora, we also selected subset 0.5, 0.7, 1.5, and 3 million words.
See Figure 2 for results for neural machine translation systems (also broken down by each in-dividual test set) and Figure 3 for statistical ma-chine translation systems. We only computed re-sults for 7 systems due to the computational cost involved.
The additional data points refine the observation for the three original subset sizes. For neural ma-chine translation, submissions have different op-timal subset sizes, ranging from 0.7 million to 3 million words.
For Nepali, most of the submissions show peak translation quality with 1 million words, although Stockholm’s submission peaks at 700,000, Scil-ing’s and AFRL’s submission at 3 million. For most submission translation quality deteriorates several BLEU points off their peak.
For Sinhala, the picture is similar. Most of the submission show peaks at 2 million words, indi-cating that there is more useful data for this data condition. Peaks range from 1 million for Stock-holm’s submission to 3 million for Sciling’s sub-mission. The curves are somewhat shallower than for Nepali.
The curves for statistical machine translation look very different. All submissions tend to im-prove with additional data, outperforming neural machine translation at 5 million, and showing no sign of stopping there. This demonstrates that
sta-Nepali 1 million 5 million
Submission Sent. W/S Sent. W/S
AFRL 50k 51932 19.3 241513 20.7 AFRL 150k 50422 19.8 236966 21.1 Facebook main 36331 27.5 115673 43.2 Facebook contr. 36397 27.5 115771 43.2 Helsinki 48020 20.8 253834 19.7 Helsinki contr. 50801 19.7 251983 19.8
IITP 56868 17.6 200725 24.9
[image:11.595.309.525.61.293.2]IITP geom 53821 18.6 185978 26.9 NRC ensemble 31675 31.6 154622 32.3 NRC xlm 28348 35.3 191203 26.2 NRC yisi-2-sup 42922 23.3 161022 31.1 NRC yisi-2-unsup 40951 24.4 148072 33.8 Sciling 85253 11.7 314196 15.9 Stockholm 46529 21.5 272605 18.3 Stockholm ngram 141732 7.1 419335 11.9 SUNY Buffalo 93063 10.7 300627 16.6 TALP-UPC 75423 13.3 246875 20.3 TALP-UPC sec. 84978 11.8 375387 13.3 Webinterpret 34873 28.7 400441 12.5 Webinterpret cov 29575 33.8 400441 12.5 Webinterpret prob 52271 19.1 400441 12.5
Table 11: Number of sentences and the corresponding average sentence length (counting English words) for Nepali.
tistical machine translation is more robust to noise. Compared to last year’s high resource version of the shared task, the peak data selection sizes are smaller. Best translation quality is achieved with about 2–6% of the full set, compared to 10% or more for German–English. This is likely due to the fact that the raw data is noisier, but may be also attributed to the difficulty of devising good quality metrics with little evidence of good translations.
6.3 Average Sentence Length
Given the quality scores, subsets are selected by including the highest ranked sentence pairs until the total number of English words in these sen-tences reaches the specified size. So, if a quality scores prefers shorter sentences, more sentences are selected. It is not clear in general, all things be-ing otherwise equal, if shorter or longer sentences are better for training machine translation systems. What choices did the participants make in their quality scores? Table 11 and Table 12 show the number of sentences and the corresponding aver-age number of words per sentence for the official subsets for all submissions.
0.5 0.7 1 1.5 2 3 5 0
1 2 3 4 5 6 7
corpus size (millions of English words)
BLEU
Neural Machine Translation, Nepali
afrl 50k facebook
iitp nrc sciling stockholm webinterpret
0.5 0.7 1 1.5 2 3 5
0 1 2 3 4 5 6 7
corpus size (millions of English words)
BLEU
Neural Machine Translation, Sinhala
afrl 150k facebook iitp
[image:12.595.78.523.63.734.2]nrc yisi-2-sup sciling stockholm webinterpret prob
Figure 2:Additional subsets, neural machine translation. The charts plot BLEU scores against the size of the
0.5 0.7 1 1.5 2 3 5 0
1 2 3 4 5
corpus size (millions of English words)
BLEU
Statistical Machine Translation, Nepali
afrl 50k facebook iitp nrc sciling stockholm webinterpret
0.5 0.7 1 1.5 2 3 5
0 1 2 3 4 5
corpus size (millions of English words)
BLEU
Statistical Machine Translation, Sinhala
afrl 150k facebook iitp
[image:13.595.76.524.122.658.2]nrc yisi-2-sup sciling stockholm webinterpret prob
Figure 3: Additional subsets, statistical machine translation. The charts plot BLEU scores against the size
Sinhala 1 million 5 million
Submission Sent. W/S Sent. W/S
AFRL 50k 61,605 16.2 292,912 17.1 AFRL 150k 59,593 16.8 276,633 18.1
DiDi 24,324 41.1 134,769 37.1
DiDi lratio 26,191 38.2 143,744 34.8 DiDi lmdiff 25,974 38.5 170,848 29.3 Facebook main 55,829 17.9 159,924 31.3 Facebook contr. 43,895 22.8 159,723 31.3 Helsinki 87,547 11.4 341,489 14.6 Helsinki contr. 78,579 12.7 345,108 14.5
IITP 70,114 14.3 264,271 18.9
[image:14.595.74.291.60.315.2]IITP geom 67,888 14.7 249,275 20.1 NRC ensemble 30,533 32.8 172,643 29.0 NRC xlm 24,961 40.1 195,332 25.6 NRC yisi-2-sup 55,757 17.9 192,017 26.0 NRC yisi-2-unsup 60,594 16.5 215,421 23.2 Sciling 120,399 8.3 332,120 15.1 Stockholm 55,293 18.1 250,767 19.9 Stockholm ngram 46,529 21.5 444,106 11.3 TALP-UPC 89,785 11.1 2896,74 17.3 TALP-UPC sec. 114,990 8.7 437,636 11.4 Webinterpret 35,684 28.0 328,620 15.2 Webinterpret cov 29,678 33.7 318,360 15.7 Webinterpret prob 64,115 15.6 345,536 14.5
Table 12: Number of sentences and the corresponding average sentence length (counting English words) for Sinhala.
sentences with an average number of 43.2 words per sentence, while AFRL’s 50k submission aver-ages at just 20.7.
For other data conditions, differences are not that extreme but do spread out mainly in the range of under 20 to over 30 words per sentence. There is no clear pattern in the preference for shorter and longer sentence lengths for the 1 million and 5 mil-lion word subset — for most submissions these two numbers are quite similar. There are outliers, however, such as Facebook’s Nepali submission (average length 27.5 vs. 43.2) and Webinterpret’s Nepali submission (28.7 vs. 12.5).
6.4 Diversity of Submissions
The different submissions subselect different sen-tences, but how different are they?
Table 13–16 give detailed statistics about how many sentence pairs the subsets of any two sub-missions for the two languages and two data con-ditions have in common.
There is no clear trend. For Nepali, there is more overlap in the 1 million word data condi-tion than the 5 million word data condicondi-tion. For Sinhala, the opposite is the case. Among the best-performing submissions, roughly half of the sub-selected sentence pairs are the same. But what submissions are similar may change drastically
between the data conditions.
7 Conclusion
We report on the findings of the WMT 2019 Shared Task on Parallel Corpus Filtering. Eleven participants used a variety of methods that gave quite different results, as measured by translation quality, optimal subset sizes, suitability for SMT and NMT, sentence length, etc. We hope that this task provides a benchmark for future research and improvements on this task.
References
Alexandra Antonova and Alexey Misyurev. 2011.
Building a web-based parallel corpus and filtering out machine-translated text. InProceedings of the 4th Workshop on Building and Using Comparable Corpora: Comparable Corpora and the Web, pages 136–144, Portland, Oregon. Association for Compu-tational Linguistics.
Mikel Artetxe and Holger Schwenk. 2018.
Margin-based Parallel Corpus Mining with Multilin-gual Sentence Embeddings. arXiv preprint arXiv:1912.10464.
Tom Ash, Remi Francis, and Will Williams. 2018.
The speechmatics parallel corpus filtering system for wmt18. InProceedings of the Third Conference on Machine Translation, Volume 2: Shared Task
Pa-pers, pages 866–872, Belgium, Brussels.
Associa-tion for ComputaAssocia-tional Linguistics.
Amittai Axelrod. 2019. Dual monolingual
cross-entropy delta filtering of noisy parallel data. In
Proceedings of the Fourth Conference on Machine Translation (WMT).
Amittai Axelrod, Xiaodong He, and Jianfeng Gao.
2011.Domain adaptation via pseudo in-domain data
selection. InProceedings of the 2011 Conference on Empirical Methods in Natural Language
Process-ing, pages 355–362, Edinburgh, Scotland, UK.
As-sociation for Computational Linguistics.
D. Bahdanau, K. Cho, and Y. Bengio. 2015. Neural machine translation by jointly learning to align and
translate. InInternational Conference on Learning
Representations (ICLR).
Yonatan Belinkov and Yonatan Bisk. 2017. Synthetic
and natural noise both break neural machine
transla-tion.CoRR, abs/1711.02173.
Submission Total Unique AFRL 50k AFRL 150k F acebook main F acebook contr . Helsinki Helsinki contr . IITP IITP geom NRC ensemble NRC xlm NRC yisi-2-sup NRC yisi-2-unsup
Sciling Stockholm Stockholm
ngram SUNY Buffalo T ALP-UPC T ALP-UPC sec. W ebinter pr et W ebinter pr et co v W ebinter pr et pr ob
[image:15.595.78.524.102.301.2]AFRL 50k 51932 2.4% 92.0% 34.0% 34.0% 12.6% 2.5% 36.8% 36.5% 27.5% 23.0% 34.8% 34.4% 36.2% 26.5% 19.0% 4.7% 3.2% 0.5% 20.1% 6.1% 27.8% AFRL 150k 50422 2.8% 94.8% 34.3% 34.3% 12.4% 2.3% 36.6% 36.3% 27.9% 23.6% 34.9% 34.6% 35.4% 26.2% 18.3% 4.6% 3.0% 0.5% 20.3% 6.3% 27.6% Facebook main 36331 0.0% 48.6% 47.6% 99.9% 21.5% 3.9% 63.8% 63.6% 59.2% 52.3% 64.7% 62.5% 29.5% 56.0% 31.5% 3.6% 2.9% 0.3% 45.0% 14.8% 53.4% Facebook contr. 36397 0.0% 48.5% 47.5% 99.7% 21.5% 3.9% 63.8% 63.5% 59.1% 52.2% 64.6% 62.4% 29.5% 55.9% 31.6% 3.6% 2.9% 0.3% 44.9% 14.8% 53.4% Helsinki 48020 15.0% 13.7% 13.0% 16.3% 16.3% 27.2% 17.6% 17.0% 16.6% 14.5% 13.9% 12.5% 11.3% 23.8% 26.7% 26.5% 19.5% 0.7% 17.5% 13.4% 19.8% Helsinki contr. 50801 40.4% 2.6% 2.3% 2.8% 2.8% 25.7% 3.2% 2.9% 1.6% 1.7% 1.5% 1.5% 2.3% 9.1% 10.0% 13.6% 30.8% 0.6% 2.7% 4.5% 3.2% IITP 56868 2.5% 33.6% 32.5% 40.8% 40.8% 14.9% 2.9% 93.7% 35.8% 30.3% 45.6% 44.8% 27.2% 35.1% 22.7% 4.5% 3.5% 0.4% 32.4% 10.7% 53.2% IITP geom 53821 0.2% 35.2% 34.0% 42.9% 43.0% 15.2% 2.7% 99.0% 37.5% 31.9% 47.9% 46.8% 27.8% 36.4% 23.1% 4.3% 3.2% 0.4% 33.9% 11.0% 54.7% NRC ensemble 31675 3.7% 45.1% 44.5% 67.9% 67.9% 25.1% 2.6% 64.2% 63.8% 73.8% 74.8% 71.2% 21.2% 56.7% 29.8% 7.5% 1.3% 0.1% 54.4% 22.0% 58.9% NRC xlm 28348 7.0% 42.1% 41.9% 67.0% 67.0% 24.5% 3.1% 60.9% 60.6% 82.4% 69.3% 67.8% 15.9% 55.7% 27.8% 8.0% 0.7% 0.0% 56.0% 25.5% 55.8% NRC yisi-2-sup 42922 9.1% 42.1% 41.0% 54.8% 54.8% 15.5% 1.8% 60.5% 60.1% 55.2% 45.8% 73.6% 24.2% 42.9% 26.8% 3.2% 2.9% 0.1% 39.1% 13.0% 49.2% NRC yisi-2-unsup 40951 7.2% 43.6% 42.7% 55.4% 55.5% 14.7% 1.8% 62.2% 61.5% 55.0% 47.0% 77.1% 24.2% 41.5% 22.9% 2.8% 2.7% 0.1% 39.6% 13.6% 49.5% Sciling 85253 52.4% 22.1% 20.9% 12.6% 12.6% 6.4% 1.4% 18.1% 17.5% 7.9% 5.3% 12.2% 11.6% 11.0% 15.2% 4.3% 3.9% 1.1% 5.4% 1.1% 12.7% Stockholm 46529 16.4% 29.6% 28.4% 43.7% 43.7% 24.6% 9.9% 42.9% 42.1% 38.6% 34.0% 39.6% 36.5% 20.1% 38.2% 10.0% 6.9% 0.2% 32.7% 13.1% 38.8% Stockholm ngram 141732 55.5% 7.0% 6.5% 8.1% 8.1% 9.1% 3.6% 9.1% 8.8% 6.7% 5.6% 8.1% 6.6% 9.2% 12.6% 19.2% 6.7% 1.1% 5.2% 1.2% 8.7% SUNY Buffalo 93063 44.9% 2.6% 2.5% 1.4% 1.4% 13.7% 7.4% 2.8% 2.5% 2.6% 2.4% 1.5% 1.2% 3.9% 5.0% 29.3% 9.0% 2.1% 4.9% 7.2% 5.0% TALP-UPC 75423 52.9% 2.2% 2.0% 1.4% 1.4% 12.4% 20.8% 2.6% 2.3% 0.6% 0.2% 1.6% 1.5% 4.4% 4.2% 12.6% 11.1% 1.9% 0.4% 0.5% 2.0% TALP-UPC sec. 84978 93.9% 0.3% 0.3% 0.1% 0.1% 0.4% 0.4% 0.3% 0.3% 0.0% 0.0% 0.1% 0.1% 1.1% 0.1% 1.8% 2.3% 1.7% 0.0% 0.0% 0.1% Webinterpret 34873 0.0% 29.9% 29.3% 46.8% 46.8% 24.1% 4.0% 52.9% 52.3% 49.5% 45.5% 48.2% 46.4% 13.2% 43.6% 21.2% 13.2% 0.9% 0.0% 54.0% 82.0% Webinterpret cov 29575 18.0% 10.8% 10.8% 18.2% 18.2% 21.7% 7.7% 20.5% 20.1% 23.6% 24.5% 18.8% 18.8% 3.2% 20.6% 5.5% 22.5% 1.3% 0.0% 63.7% 42.6% Webinterpret prob 52271 11.1% 27.6% 26.6% 37.1% 37.2% 18.2% 3.1% 57.9% 56.3% 35.7% 30.2% 40.4% 38.8% 20.7% 34.5% 23.6% 9.0% 3.0% 0.2% 54.7% 24.1%
Table 13: Overlap for Nepali, 1 million word data condition. For each submission, a row in the table lists the
total number of sentence pairs, the ratio of unique sentence pairs that are in included in no other submission, and the ratio of sentence pairs shared with each of the other submissions.
Submissions from different participants share up to 67.9% of sentence pairs (NRC ensemble and Facebook main).
Submission Total Unique AFRL
50k AFRL 150k F acebook main F acebook contr . Helsinki Helsinki contr . IITP IITP geom NRC ensemble NRC xlm NRC yisi-2-sup NRC yisi-2-unsup
Sciling Stockholm Stockholm
ngram SUNY Buffalo T ALP-UPC T ALP-UPC sec. W ebinter pr et W ebinter pr et co v W ebinter pr et pr ob
AFRL 50k 241513 1.7% - 86.4% 32.6% 32.6% 34.5% 30.4% 39.4% 38.8% 30.6% 30.9% 31.0% 31.9% 61.5% 25.7% 26.0% 29.6% 26.7% 12.8% 38.9% 38.9% 38.9% AFRL 150k 236966 1.9% 88.0% - 31.1% 31.2% 36.1% 32.4% 38.8% 37.7% 30.8% 31.2% 31.4% 32.4% 60.8% 25.2% 25.9% 29.5% 25.7% 11.7% 38.5% 38.5% 38.5% Facebook main 115673 0.0% 68.0% 63.8% - 99.9% 42.5% 34.4% 44.6% 44.8% 43.9% 43.8% 40.0% 44.1% 54.3% 32.5% 28.9% 34.5% 30.0% 9.0% 40.5% 40.5% 40.5% Facebook contr. 115771 0.0% 68.0% 63.8% 99.9% - 42.5% 34.4% 44.6% 44.8% 43.9% 43.8% 40.0% 44.1% 54.3% 32.5% 28.9% 34.5% 30.0% 9.0% 40.5% 40.5% 40.5% Helsinki 253834 0.1% 32.8% 33.7% 19.4% 19.4% - 86.6% 34.5% 32.5% 32.4% 39.1% 28.5% 26.9% 36.7% 52.2% 64.4% 50.6% 50.0% 27.6% 36.5% 36.5% 36.5% Helsinki contr. 251983 0.5% 29.2% 30.5% 15.8% 15.8% 87.3% - 32.1% 30.1% 28.5% 35.1% 26.3% 24.4% 33.3% 50.6% 62.7% 45.8% 51.0% 27.8% 31.0% 31.0% 31.0% IITP 200725 0.6% 47.4% 45.8% 25.7% 25.7% 43.6% 40.4% - 89.5% 44.9% 45.7% 44.2% 42.6% 41.5% 45.9% 41.0% 46.6% 35.1% 10.6% 52.1% 52.1% 52.1% IITP geom 185978 0.1% 50.4% 48.1% 27.9% 27.9% 44.4% 40.8% 96.6% - 47.0% 47.4% 46.9% 45.5% 42.4% 45.1% 39.3% 45.0% 33.9% 9.5% 51.8% 51.8% 51.8% NRC ensemble 154622 0.3% 47.8% 47.3% 32.9% 32.9% 53.2% 46.4% 58.3% 56.6% - 85.1% 64.9% 62.8% 40.7% 47.6% 43.2% 55.6% 37.5% 8.5% 44.9% 44.9% 44.9% NRC xlm 191203 1.6% 39.1% 38.7% 26.5% 26.5% 51.9% 46.2% 48.0% 46.1% 68.8% - 48.5% 47.7% 36.4% 46.1% 53.0% 51.2% 36.4% 12.1% 42.2% 42.2% 42.2% NRC yisi-2-sup 161022 4.6% 46.5% 46.1% 28.7% 28.8% 44.9% 41.1% 55.1% 54.2% 62.4% 57.6% - 69.4% 37.4% 38.9% 36.0% 40.2% 30.0% 5.9% 36.8% 36.8% 36.8% NRC yisi-2-unsup 148072 2.7% 52.0% 51.9% 34.5% 34.5% 46.0% 41.6% 57.7% 57.1% 65.5% 61.6% 75.5% - 40.0% 36.3% 30.4% 43.1% 30.1% 5.6% 38.7% 38.7% 38.7% Sciling 314196 21.1% 47.2% 45.9% 20.0% 20.0% 29.6% 26.7% 26.5% 25.1% 20.0% 22.1% 19.2% 18.9% - 28.2% 30.8% 25.3% 25.5% 15.3% 34.2% 34.2% 34.2% Stockholm 272605 1.0% 22.8% 21.9% 13.8% 13.8% 48.6% 46.7% 33.8% 30.8% 27.0% 32.4% 23.0% 19.7% 32.5% - 87.1% 49.5% 43.3% 23.4% 35.4% 35.4% 35.4% Stockholm ngram 419335 17.3% 15.0% 14.6% 8.0% 8.0% 39.0% 37.7% 19.6% 17.4% 15.9% 24.2% 13.8% 10.7% 23.0% 56.6% - 41.0% 29.3% 19.4% 26.0% 26.0% 26.0% SUNY Buffalo 300627 11.9% 23.8% 23.3% 13.3% 13.3% 42.7% 38.4% 31.1% 27.9% 28.6% 32.6% 21.5% 21.2% 26.5% 44.8% 57.2% - 31.3% 19.9% 36.2% 36.2% 36.2% TALP-UPC 246875 3.7% 26.1% 24.7% 14.1% 14.1% 51.4% 52.1% 28.5% 25.5% 23.5% 28.2% 19.5% 18.1% 32.5% 47.8% 49.8% 38.1% - 39.8% 30.6% 30.6% 30.6% TALP-UPC sec. 375387 53.2% 8.2% 7.4% 2.8% 2.8% 18.7% 18.6% 5.7% 4.7% 3.5% 6.2% 2.5% 2.2% 12.8% 17.0% 21.7% 15.9% 26.2% - 14.8% 14.8% 14.8% Webinterpret 400441 0.0% 23.4% 22.8% 11.7% 11.7% 23.1% 19.5% 26.1% 24.1% 17.3% 20.2% 14.8% 14.3% 26.8% 24.1% 27.2% 27.2% 18.9% 13.9% - 100.0% 100.0% Webinterpret cov 400441 0.0% 23.4% 22.8% 11.7% 11.7% 23.1% 19.5% 26.1% 24.1% 17.3% 20.2% 14.8% 14.3% 26.8% 24.1% 27.2% 27.2% 18.9% 13.9% 100.0% - 100.0% Webinterpret prob 400441 0.0% 23.4% 22.8% 11.7% 11.7% 23.1% 19.5% 26.1% 24.1% 17.3% 20.2% 14.8% 14.3% 26.8% 24.1% 27.2% 27.2% 18.9% 13.9% 100.0% 100.0%
-Table 14: Overlap for Nepali, 5 million word data condition. For each submission, a row in the table lists the
total number of sentence pairs, the ratio of unique sentence pairs that are in included in no other submission, and the ratio of sentence pairs shared with each of the other submissions.
[image:15.595.78.535.445.650.2]Submission Total Unique AFRL 50k AFRL 150k DiDi DiDi lratio DiDi lmdiff F acebook main F acebook contr . Helsinki Helsinki contr . IITP IITP geom NRC ensemble NRC xlm NRC yisi-2-sup NRC yisi-2-unsup
Sciling Stockholm Stockholm
ngram T ALP-UPC T ALP-UPC sec. W ebinter pr et W ebinter pr et co v W ebinter pr et pr ob
AFRL 50k 61605 7.6% - 81.3% 3.2% 6.0% 2.3% 36.2% 31.7% 16.0% 5.1% 51.0% 49.6% 15.6% 10.6% 30.8% 24.5% 45.2% 16.6% 15.5% 4.8% 1.4% 11.1% 4.2% 29.8% AFRL 150k 59593 2.3% 84.0% - 3.7% 7.1% 2.8% 40.7% 34.6% 18.0% 6.1% 50.4% 48.8% 18.1% 12.6% 34.2% 27.1% 44.5% 19.2% 18.1% 5.3% 1.4% 12.7% 4.9% 32.9% DiDi 24324 35.4% 8.2% 9.1% - 36.2% 26.5% 5.1% 4.1% 10.2% 9.5% 1.2% 1.1% 10.4% 10.8% 3.7% 1.4% 2.5% 7.0% 7.2% 3.5% 0.2% 7.9% 11.6% 4.3% DiDi lratio 26191 15.9% 14.1% 16.1% 33.6% - 18.3% 16.9% 14.2% 25.5% 12.6% 6.3% 6.0% 22.8% 21.6% 11.8% 5.5% 6.5% 19.4% 19.7% 4.5% 0.4% 21.5% 23.7% 14.6% DiDi lmdiff 25974 43.5% 5.6% 6.5% 24.8% 18.4% - 4.6% 3.3% 9.7% 8.9% 0.9% 0.8% 10.3% 9.3% 4.1% 2.1% 2.4% 6.9% 7.4% 3.2% 0.2% 8.5% 10.7% 5.2% Facebook main 55829 2.1% 40.0% 43.5% 2.2% 7.9% 2.2% - 59.5% 30.8% 11.9% 40.7% 39.3% 29.0% 18.7% 47.7% 34.3% 40.3% 37.0% 29.9% 7.3% 1.3% 22.1% 7.0% 48.4% Facebook contr. 43895 4.4% 44.5% 47.0% 2.3% 8.5% 2.0% 75.7% - 25.5% 9.0% 45.3% 44.0% 31.7% 22.1% 50.5% 37.9% 38.2% 32.4% 26.5% 6.3% 1.2% 24.2% 9.1% 42.4% Helsinki 87547 22.5% 11.3% 12.3% 2.8% 7.6% 2.9% 19.7% 12.8% - 37.7% 8.6% 8.0% 11.2% 7.0% 12.4% 8.2% 21.3% 21.9% 19.0% 20.7% 2.4% 8.9% 4.8% 16.7% Helsinki contr. 78579 36.9% 4.0% 4.7% 3.0% 4.2% 3.0% 8.5% 5.0% 42.0% - 2.9% 2.7% 5.5% 3.6% 5.3% 3.0% 10.0% 13.6% 12.3% 21.9% 2.2% 4.7% 2.3% 7.7% IITP 70114 1.1% 44.8% 42.8% 0.4% 2.3% 0.3% 32.4% 28.4% 10.7% 3.3% - 94.6% 11.1% 7.2% 29.6% 25.0% 45.6% 13.4% 10.9% 3.3% 0.9% 9.8% 3.1% 34.1% IITP geom 67888 0.6% 45.0% 42.8% 0.4% 2.3% 0.3% 32.3% 28.5% 10.4% 3.2% 97.7% - 11.1% 7.2% 29.1% 24.4% 45.4% 13.1% 10.6% 3.2% 0.9% 9.9% 3.1% 34.5% NRC ensemble 30533 3.4% 31.5% 35.3% 8.3% 19.5% 8.8% 53.1% 45.5% 32.1% 14.0% 25.6% 24.7% - 58.2% 52.5% 30.8% 17.0% 39.1% 35.7% 1.5% 0.1% 38.8% 19.6% 42.0% NRC xlm 24961 10.0% 26.1% 30.2% 10.5% 22.6% 9.7% 41.9% 38.8% 24.4% 11.4% 20.1% 19.6% 71.2% - 39.6% 22.9% 8.4% 32.2% 29.8% 0.5% 0.0% 38.2% 24.9% 32.7% NRC yisi-2-sup 55757 8.1% 34.0% 36.6% 1.6% 5.5% 1.9% 47.7% 39.8% 19.5% 7.5% 37.3% 35.5% 28.7% 17.7% - 61.7% 34.0% 24.3% 21.0% 6.2% 0.7% 19.0% 7.2% 34.2% NRC yisi-2-unsup 60594 21.3% 24.9% 26.6% 0.6% 2.4% 0.9% 31.6% 27.5% 11.9% 3.9% 29.0% 27.4% 15.5% 9.4% 56.7% - 32.1% 13.3% 11.5% 7.1% 1.0% 12.5% 5.4% 24.8% Sciling 120399 37.0% 23.1% 22.0% 0.5% 1.4% 0.5% 18.7% 13.9% 15.5% 6.5% 26.5% 25.6% 4.3% 1.7% 15.7% 16.2% - 12.4% 8.6% 8.1% 1.8% 2.9% 0.5% 16.4% Stockholm 55293 15.6% 18.4% 20.7% 3.1% 9.2% 3.2% 37.4% 25.7% 34.7% 19.3% 16.9% 16.0% 21.6% 14.5% 24.6% 14.6% 26.9% - 43.8% 12.3% 1.2% 17.1% 7.2% 29.8% Stockholm ngram 46529 12.5% 20.5% 23.2% 3.8% 11.1% 4.2% 35.9% 25.0% 35.7% 20.8% 16.5% 15.5% 23.5% 16.0% 25.1% 14.9% 22.3% 52.0% - 12.7% 1.8% 17.3% 8.6% 27.3% TALP-UPC 89785 50.0% 3.3% 3.5% 0.9% 1.3% 0.9% 4.5% 3.1% 20.2% 19.2% 2.6% 2.4% 0.5% 0.1% 3.9% 4.8% 10.8% 7.6% 6.6% - 9.1% 0.4% 0.6% 2.9% TALP-UPC sec. 114990 90.6% 0.8% 0.7% 0.0% 0.1% 0.0% 0.6% 0.5% 1.8% 1.5% 0.5% 0.5% 0.0% 0.0% 0.3% 0.5% 1.9% 0.6% 0.7% 7.1% - 0.0% 0.0% 0.3% Webinterpret 35684 5.1% 19.1% 21.1% 5.4% 15.8% 6.2% 34.6% 29.7% 21.8% 10.4% 19.3% 18.7% 33.2% 26.7% 29.6% 21.3% 9.9% 26.5% 22.6% 1.1% 0.1% - 44.1% 64.1% Webinterpret cov 29678 24.7% 8.8% 9.9% 9.5% 21.0% 9.4% 13.1% 13.5% 14.1% 6.0% 7.4% 7.1% 20.1% 20.9% 13.4% 11.0% 2.1% 13.4% 13.5% 1.8% 0.1% 53.1% - 22.8% Webinterpret prob 64115 11.8% 28.7% 30.6% 1.6% 6.0% 2.1% 42.2% 29.1% 22.8% 9.4% 37.2% 36.6% 20.0% 12.7% 29.7% 23.4% 30.8% 25.7% 19.8% 4.0% 0.6% 35.7% 10.6%
-Table 15:Overlap for Sinhala, 1 million word data condition. For each submission, a row in the table lists the
total number of sentence pairs, the ratio of unique sentence pairs that are in included in no other submission, and the ratio of sentence pairs shared with each of the other submissions.
There is less overlap between submissions, compared to Nepali. The submissions share almost always below half of the sentence pairs.
Submission Total Unique AFRL
50k AFRL 150k DiDi DiDi lratio DiDi lmdiff F acebook main F acebook contr . Helsinki Helsinki contr . IITP IITP geom NRC ensemble NRC xlm NRC yisi-2-sup NRC yisi-2-unsup
Sciling Stockholm Stockholm
ngram T ALP-UPC T ALP-UPC sec. W ebinter pr et W ebinter pr et co v W ebinter pr et pr ob
[image:16.595.72.560.96.306.2]AFRL 50k 292912 0.8% 90.9% 8.4% 12.1% 10.8% 38.0% 41.1% 33.0% 33.0% 58.7% 55.6% 28.1% 26.5% 35.1% 35.1% 58.5% 24.0% 26.5% 20.7% 13.2% 44.3% 37.4% 44.9% AFRL 150k 276633 0.2% 96.2% 10.6% 14.1% 11.7% 39.1% 42.0% 33.2% 33.2% 59.4% 56.5% 29.5% 27.6% 35.6% 34.6% 58.6% 24.0% 25.7% 20.0% 12.6% 43.8% 36.7% 44.5% DiDi 134769 4.1% 18.3% 21.7% 77.5% 47.0% 21.4% 16.3% 38.2% 35.9% 24.1% 22.6% 39.7% 38.4% 30.2% 21.8% 21.5% 38.3% 32.9% 27.0% 8.9% 25.8% 26.6% 25.4% DiDi lratio 143744 0.3% 24.7% 27.2% 72.7% 44.1% 27.7% 22.6% 45.7% 41.0% 32.3% 30.4% 47.1% 46.0% 34.6% 26.6% 31.2% 50.0% 42.0% 31.3% 11.4% 42.7% 44.1% 42.2% DiDi lmdiff 170848 9.4% 18.6% 18.9% 37.1% 37.1% 18.6% 15.3% 34.4% 32.6% 25.4% 23.6% 31.8% 32.1% 29.2% 25.0% 26.1% 34.7% 35.8% 28.3% 10.5% 31.2% 31.9% 31.2% Facebook main 159924 4.8% 69.5% 67.7% 18.0% 24.9% 19.9% 69.5% 45.6% 41.2% 60.0% 57.8% 49.8% 47.0% 51.5% 44.7% 52.0% 35.5% 35.2% 24.0% 10.1% 49.5% 41.4% 50.2% Facebook contrastive 159723 2.4% 75.4% 72.8% 13.8% 20.3% 16.4% 69.6% 39.9% 37.8% 60.7% 58.3% 40.8% 38.3% 46.5% 45.1% 56.0% 30.4% 29.5% 23.9% 11.5% 50.7% 44.5% 50.7% Helsinki 341489 0.1% 28.3% 26.9% 15.1% 19.2% 17.2% 21.4% 18.7% 91.3% 28.3% 26.5% 26.6% 30.7% 23.6% 20.9% 31.7% 36.7% 63.0% 42.7% 26.2% 37.8% 36.2% 40.9% Helsinki contr. 345108 1.1% 28.0% 26.6% 14.0% 17.1% 16.2% 19.1% 17.5% 90.3% 27.5% 25.8% 23.6% 27.5% 21.5% 19.1% 30.2% 33.9% 60.6% 41.8% 25.9% 34.2% 32.7% 37.2% IITP 264271 0.2% 65.0% 62.2% 12.3% 17.6% 16.4% 36.3% 36.7% 36.6% 35.9% 92.6% 35.5% 34.9% 41.3% 40.4% 56.2% 31.5% 31.7% 21.3% 10.0% 57.0% 49.8% 57.9% IITP geom 249275 0.1% 65.3% 62.7% 12.2% 17.5% 16.2% 37.1% 37.4% 36.3% 35.8% 98.2% 35.6% 35.1% 41.4% 40.1% 56.1% 31.1% 31.2% 20.5% 9.7% 57.3% 49.8% 58.2% NRC ensemble 172643 0.2% 47.7% 47.3% 31.0% 39.2% 31.5% 46.2% 37.7% 52.7% 47.2% 54.4% 51.5% 82.5% 65.4% 51.9% 49.5% 47.6% 41.5% 32.3% 10.2% 57.7% 54.5% 58.3% NRC xlm 195332 1.1% 39.8% 39.1% 26.5% 33.9% 28.0% 38.5% 31.3% 53.6% 48.7% 47.2% 44.8% 72.9% 50.0% 43.4% 44.2% 47.1% 47.8% 34.8% 13.1% 53.2% 50.5% 54.4% NRC yisi-2-sup 192017 1.9% 53.6% 51.3% 21.2% 25.9% 26.0% 42.9% 38.7% 41.9% 38.6% 56.8% 53.7% 58.8% 50.8% 65.4% 47.7% 33.4% 32.0% 27.8% 9.8% 50.6% 47.5% 51.1% NRC yisi-2-unsup 215421 5.6% 47.7% 44.5% 13.6% 17.7% 19.8% 33.2% 33.5% 33.2% 30.6% 49.6% 46.4% 41.6% 39.3% 58.3% 44.4% 26.1% 27.2% 30.2% 12.2% 50.0% 47.5% 50.2% Sciling 332120 11.7% 51.6% 48.8% 8.7% 13.5% 13.4% 25.0% 26.9% 32.6% 31.4% 44.7% 42.1% 25.7% 26.0% 27.6% 28.8% 29.2% 29.9% 25.3% 15.0% 50.6% 46.9% 50.7% Stockholm 250767 2.7% 28.1% 26.4% 20.6% 28.6% 23.6% 22.6% 19.3% 49.9% 46.6% 33.2% 30.9% 32.8% 36.7% 25.6% 22.4% 38.7% 73.4% 41.4% 21.0% 46.1% 45.6% 47.4% Stockholm ngram 444106 17.5% 17.5% 16.0% 10.0% 13.6% 13.8% 12.7% 10.6% 48.4% 47.1% 18.9% 17.5% 16.1% 21.0% 13.8% 13.2% 22.4% 41.5% 29.8% 20.2% 28.9% 27.8% 31.7% TALP-UPC 289674 3.5% 20.9% 19.1% 12.5% 15.5% 16.7% 13.2% 13.2% 50.4% 49.8% 19.5% 17.7% 19.2% 23.5% 18.4% 22.5% 29.0% 35.8% 45.7% 49.6% 39.4% 41.9% 40.8% TALP-UPC sec. 437636 56.3% 8.8% 8.0% 2.8% 3.7% 4.1% 3.7% 4.2% 20.4% 20.4% 6.0% 5.5% 4.0% 5.8% 4.3% 6.0% 11.4% 12.0% 20.5% 32.8% 14.3% 16.2% 15.1% Webinterpret 328620 0.0% 39.4% 36.9% 10.6% 18.7% 16.2% 24.1% 24.7% 39.3% 35.9% 45.9% 43.5% 30.3% 31.6% 29.5% 32.8% 51.1% 35.2% 39.1% 34.7% 19.0% 85.7% 96.0% Webinterpret cov 318360 1.9% 34.4% 31.9% 11.3% 19.9% 17.1% 20.8% 22.3% 38.8% 35.5% 41.3% 39.0% 29.5% 31.0% 28.7% 32.1% 48.9% 35.9% 38.8% 38.1% 22.3% 88.4% 86.5% Webinterpret prob 345536 1.3% 38.1% 35.6% 9.9% 17.6% 15.4% 23.2% 23.4% 40.4% 37.2% 44.3% 42.0% 29.1% 30.7% 28.4% 31.3% 48.7% 34.4% 40.7% 34.2% 19.1% 91.3% 79.7%
Table 16:Overlap for Sinhala, 5 million word data condition. For each submission, a row in the table lists the
total number of sentence pairs, the ratio of unique sentence pairs that are in included in no other submission, and the ratio of sentence pairs shared with each of the other submissions.
[image:16.595.74.569.438.662.2]Houda Bouamor and Hassan Sajjad. 2018.
H2@bucc18: Parallel sentence extraction from comparable corpora using multilingual sentence embeddings. InProceedings of the Eleventh Inter-national Conference on Language Resources and Evaluation (LREC 2018), Paris, France. European Language Resources Association (ELRA).
Christian Buck and Philipp Koehn. 2016. Findings of
the wmt 2016 bilingual document alignment shared task. InProceedings of the First Conference on Ma-chine Translation, pages 554–563, Berlin, Germany. Association for Computational Linguistics.
Marine Carpuat, Yogarshi Vyas, and Xing Niu. 2017.
Detecting cross-lingual semantic divergence for neural machine translation. InProceedings of the First Workshop on Neural Machine Translation, pages 69–79, Vancouver. Association for Computa-tional Linguistics.
Vishrav Chaudhary, Yuqing Tang, Francisco Guzm´an, Holger Schwenk, and Philipp Koehn. 2019. Low-resource corpus filtering using multilingual sentence
embeddings. InProceedings of the Fourth
Confer-ence on Machine Translation (WMT).
Lei Cui, Dongdong Zhang, Shujie Liu, Mu Li, and
Ming Zhou. 2013. Bilingual data cleaning for SMT
using graph-based random walk. In Proceedings of the 51st Annual Meeting of the Association for Computational Linguistics (Volume 2: Short Pa-pers), pages 340–345, Sofia, Bulgaria. Association for Computational Linguistics.
Grant Erdmann and Jeremy Gwinnup. 2019. Quality and coverage: The afrl submission to the wmt19 parallel corpus filtering for low-resource conditions
task. In Proceedings of the Fourth Conference on
Machine Translation (WMT).
Jonas Gehring, Michael Auli, David Grangier, and
Yann N Dauphin. 2016. A convolutional encoder
model for neural machine translation.arXiv preprint arXiv:1611.02344.
Jes´us Gonz´alez-Rubio. 2019. Webinterpret submission to the wmt2019 shared task on parallel corpus
fil-tering. InProceedings of the Fourth Conference on
Machine Translation (WMT).
Mand y Guo, Qinlan Shen, Yinfei Yang, Heming Ge, Daniel Cer, Gustavo Hernand ez Abrego, Keith Stevens, Noah Constant, Yun-hsuan Sung, Brian
Strope, and Ray Kurzweil. 2018. Effective parallel
corpus mining using bilingual sentence embeddings. InProceedings of the Third Conference on Machine Translation: Research Papers, pages 165–176, Bel-gium, Brussels. Association for Computational Lin-guistics.
Francisco Guzm´an, Peng-Jen Chen, Myle Ott, Juan Pino, Guillaume Lample, Philipp Koehn, Vishrav
Chaudhary, and Marc’Aurelio Ranzato. 2019. Two
new evaluation datasets for low-resource machine
translation: Nepali-english and sinhala-english. arXiv preprint arXiv:1902.01382.
Viktor Hangya and Alexander Fraser. 2018. An
un-supervised system for parallel corpus filtering. In Proceedings of the Third Conference on Machine Translation, Volume 2: Shared Task Papers, pages 895–900, Belgium, Brussels. Association for Com-putational Linguistics.
Marcin Junczys-Dowmunt. 2018. Dual conditional
cross-entropy filtering of noisy parallel corpora. In Proceedings of the Third Conference on Machine Translation: Shared Task Papers, pages 888–895, Belgium, Brussels. Association for Computational Linguistics.
Huda Khayrallah and Philipp Koehn. 2018. On the
impact of various types of noise on neural machine translation. InProceedings of the 2nd Workshop on Neural Machine Translation and Generation, pages 74–83. Association for Computational Linguistics.
Philipp Koehn. 2005. Europarl: A parallel corpus for
statistical machine translation. InProceedings of the Tenth Machine Translation Summit (MT Summit X), Phuket, Thailand.
Philipp Koehn, Hieu Hoang, Alexandra Birch, Chris Callison-Burch, Marcello Federico, Nicola Bertoldi, Brooke Cowan, Wade Shen, Christine Moran, Richard Zens, Chris Dyer, Ondˇrej Bojar, Alexandra
Constantin, and Evan Herbst. 2007. Moses: Open
source toolkit for statistical machine translation. In Proceedings of the 45th Annual Meeting of the As-sociation for Computational Linguistics Companion Volume Proceedings of the Demo and Poster Ses-sions, pages 177–180, Prague, Czech Republic. As-sociation for Computational Linguistics.
Philipp Koehn, Huda Khayrallah, Kenneth Heafield,
and Mikel L. Forcada. 2018. Findings of the wmt
2018 shared task on parallel corpus filtering. In Pro-ceedings of the Third Conference on Machine Trans-lation: Shared Task Papers, pages 726–739, Bel-gium, Brussels. Association for Computational Lin-guistics.
Philipp Koehn and Rebecca Knowles. 2017. Six
chal-lenges for neural machine translation. In Pro-ceedings of the First Workshop on Neural Machine Translation, pages 28–39, Vancouver. Association for Computational Linguistics.
Gaurav Kumar, George Foster, Colin Cherry, and
Maxim Krikun. 2019. Reinforcement learning
Anoop Kunchukuttan, Pratik Mehta, and Pushpak
Bhattacharyya. 2018. The IIT Bombay
English-Hindi Parallel Corpus.
Murathan Kurfalı and Robert ¨Ostling. 2019. Noisy
par-allel corpus filtering through projected word
embed-dings. InProceedings of the Fourth Conference on
Machine Translation (WMT).
Patrick Littell, Samuel Larkin, Darlene Stewart, Michel
Simard, Cyril Goutte, and Chi-kiu Lo. 2018.
Mea-suring sentence parallelism using mahalanobis dis-tances: The nrc unsupervised submissions to the wmt18 parallel corpus filtering shared task. In Pro-ceedings of the Third Conference on Machine Trans-lation, Volume 2: Shared Task Papers, pages 913– 920, Belgium, Brussels. Association for Computa-tional Linguistics.
Chi-kiu Lo, Michel Simard, Darlene Stewart, Samuel
Larkin, Cyril Goutte, and Patrick Littell. 2018.
Ac-curate semantic textual similarity for cleaning noisy parallel corpora using semantic machine translation evaluation metric: The nrc supervised submissions to the parallel corpus filtering task. InProceedings of the Third Conference on Machine Translation, Volume 2: Shared Task Papers, pages 921–929, Bel-gium, Brussels. Association for Computational Lin-guistics.
Jun Lu, Xiaoyu Lv, Yangbin Shi, and Boxing Chen.
2018. Alibaba submission to the wmt18 parallel
cor-pus filtering task. InProceedings of the Third Con-ference on Machine Translation, Volume 2: Shared Task Papers, pages 930–935, Belgium, Brussels. As-sociation for Computational Linguistics.
Myle Ott, Sergey Edunov, Alexei Baevski, Angela Fan, Sam Gross, Nathan Ng, David Grangier, and
Michael Auli. 2019. fairseq: A fast, extensible
toolkit for sequence modeling. In Proceedings of the 2019 Conference of the North American Chap-ter of the Association for Computational Linguistics (Demonstrations), pages 48–53, Minneapolis, Min-nesota. Association for Computational Linguistics.
Gustavo Paetzold. 2018. Utfpr at wmt 2018:
Minimal-istic supervised corpora filtering for machine trans-lation. In Proceedings of the Third Conference on Machine Translation, Volume 2: Shared Task
Pa-pers, pages 936–940, Belgium, Brussels.
Associa-tion for ComputaAssocia-tional Linguistics.
Zuzanna Parcheta, Germ´an Sanchis-Trilles, and
Fran-cisco Casacuberta. 2019. Filtering of noisy
par-allel corpora based on hypothesis generation. In
Proceedings of the Fourth Conference on Machine Translation (WMT).
Ellie Pavlick, Matt Post, Ann Irvine, Dmitry Kachaev,
and Chris Callison-Burch. 2014. The language
de-mographics of Amazon Mechanical Turk. Transac-tions of the Association for Computational
Linguis-tics, 2(Feb):79–92.
Minh Quang Pham, Josep Crego, and Jean Senellart.
2018. Systran participation to the wmt2018 shared
task on parallel corpus filtering. InProceedings of the Third Conference on Machine Translation, Vol-ume 2: Shared Task Papers, pages 947–951, Bel-gium, Brussels. Association for Computational Lin-guistics.
Marcis Pinnis. 2018. Tilde’s parallel corpus
filter-ing methods for wmt 2018. InProceedings of the Third Conference on Machine Translation, Volume 2: Shared Task Papers, pages 952–958, Belgium, Brussels. Association for Computational Linguis-tics.
Matt Post. 2018. A call for clarity in reporting bleu
scores. InProceedings of the Third Conference on Machine Translation: Research Papers, pages 186– 191, Belgium, Brussels. Association for Computa-tional Linguistics.
Alexandre Rafalovitch and Robert Dale. 2009. United
Nations General Assembly resolutions: A six-language parallel corpus. In Proceedings of the Twelfth Machine Translation Summit (MT Summit
XII). International Association for Machine
Trans-lation.
Spencer Rarrick, Chris Quirk, and Will Lewis. 2011.
MT detection in web-scraped parallel corpora. In Proceedings of the 13th Machine Translation Sum-mit (MT SumSum-mit XIII), pages 422–430. International Association for Machine Translation.
Philip Resnik. 1999. Mining the web for bilingual text.
In Proceedings of the 37th Annual Meeting of the Association of Computational Linguistics (ACL).
Nick Rossenbach, Jan Rosendahl, Yunsu Kim, Miguel
Gra ˜A§a, Aman Gokrani, and Hermann Ney. 2018.
The rwth aachen university filtering system for the wmt 2018 parallel corpus filtering task. In Proceed-ings of the Third Conference on Machine Transla-tion, Volume 2: Shared Task Papers, pages 959–967, Belgium, Brussels. Association for Computational Linguistics.
V´ıctor M. S´anchez-Cartagena, Marta Ba˜n´on, Sergio
Ortiz Rojas, and Gema Ram´ırez. 2018.
Promp-sit’s submission to wmt 2018 parallel corpus filter-ing shared task. InProceedings of the Third Confer-ence on Machine Translation: Shared Task Papers, pages 955–962, Belgium, Brussels. Association for Computational Linguistics.
Sukanta Sen, Asif Ekbal, and Pushpak Bhattacharyya. 2019. Parallel corpus filtering based on fuzzy string
matching. InProceedings of the Fourth Conference
on Machine Translation (WMT).
Felipe Soares and Marta R. Costa-juss`a. 2019.
Unsu-pervised corpus filtering and mining. In