J. Bulava
NIC, DESY, Platanenallee 6, 15738, Zeuthen, Germany E-mail:[email protected]
J. Foley
Carnegie Mellon University, Pittsburgh, PA 15213, U.S.A. E-mail:[email protected]
K. J. Juge∗
University of the Pacific, Stockton, CA 95211, U.S.A. E-mail:[email protected]
C. J. Morningstar
Carnegie Mellon University, Pittsburgh, PA 15213, U.S.A. E-mail:[email protected]
M. J. Peardon
Trinity College, Dublin 2, Ireland E-mail:[email protected]
C. H. Wong
Carnegie Mellon University, Pittsburgh, PA 15213, U.S.A. E-mail:[email protected]
For the Hadron Spectrum Collaboration
The pion-pion scattering phase shift is computed using LapH propagators. The LapH method for
computing quark propagators is used to form two-particle correlation functions with a number of
different operators. Excited state energies of two-particle states on 2+1 dynamical, anisotropic
lattices (mπ ∼390 MeV) are computed to determine the phase shift in theI=2 channel. The
signal for t-to-t diagrams for theI=0 channel are also presented to demonstrate the efficacy of the stochastic LapH method.
The XXVIII International Symposium on Lattice Field Theory - Lattice2010 June 14 - 19, 2010
Villasimius, Italy
∗Speaker.
1. Introduction
The determination of the spectrum of excited states in Lattice QCD with light dynamical quarks is hampered by the need to include explicit multiparticle operators in the variational ba-sis of interpolating operators. The need for finite momenta operators seems to require an all-to-all calculation of the quark propagator for the simulation of even the simplest two-pion state. However, it was pointed out [1] recently that hadron operators that are constructed from smeared propagators have a natural cutoff in momentum space and that this can be exploited to form one timeslice-to-all quark propagators if the quarks could be smeared.
This method of computing the quark propagator below the cutoff defined by the quark field
smearing (“distillation") was used to compute the π π scattering length in theI =2 channel on
dynamical, anisotropic lattices and presented in Williamsburg. We extend this calculation by de-termining the excited states and the phase shift in this channel using the finite volume method in Euclidean space-time ([2]). Furthermore, we modify the distillation algorithm by combining it with a particular stochastic method known as noise partitioning ([3]) or noise dilution. This not only al-lows a more efficient way to compute all-timeslices-to-all propagators, but it reduces the linear volume dependence of the number of eigenmodes required to achieve the same quark smearing in larger volumes. This was a particular difficulty that had to be solved in the distillation method.
We present here preliminary results for theI=2 phase shift (see [11] for recent calculations) and the signal for thet-to-tpieces of the correlation function in theI =0 channel using this new, stochastic smearing algorithm.
2. Construction of Operators/Correlators
2.1 Quark Field Smearing
We begin the construction of two-particle correlation functions with the low-mode filtering of the quark fields via the eigenvectors of the 3-dimensional Laplacian operator, ˜∆. We have computed
the low eigenmodes (up toNev=128) of the three-dimensional, gauge covariant Laplacian operator
on each timeslice,
˜
∆v(i)=−λiv(i)
whereλ0is the eigenvalue with the smallest magnitude of the lattice Laplacian operator,
˜
∆(x,y) =
3
∑
k=1
n ˜
Uk(x)δ(y,x+kˆ) +U˜k†(x−kˆ)δ(y,x−kˆ)−2δ(x,y) o
.
Thetildeon the gauge fields indicate that they have been smeared using the stout-smearing algo-rithm ([4]).
The quark fields are then smeared using the smearing operator,
St0(x,x 0) =
∑
i
Θ(−λi+σ2)v(i)(t0,x)⊗v(i)†(t0,x0)
and the smeared quark field is given by ˜ψ(t0,x) =St0(x,x 0)
We use these quark sources to compute the solution vectors of the Dirac matrix using standard methods. This requires solving for the solutions of each of the eigenvectors used to smear the source field,
φ(i)(t,x) =M–1(t,x;t0,x0)v(i)(t0,x0).
The solution vectors,φ(i)(t,x), are smeared using the same smearing method but on timeslicet,
˜
φ(i)(t,x) =St(x,x0)φ(i)(t,x0).
The smeared quark propagator is then given by,
˜
Q(t,x;t0,x0) =St(x,x0)M–1(t,x0;t0,x00)St0(x
0
0,x0).
3. I=2 Phase Shift
The quark propagator, ˜Q(t,x;t0,x0), is at0-to-all-tpropagator. We can therefore construct pion operators with finite momenta without further inversions (i.e. at no extra cost). We compute the
I=2 pion scattering phase shift by using several, finite momenta pion operators and diagonalize the correlation matrix to determine the energy eigenvalues of the two-particle state.
3.1 Parameters
We use theNf =2+1 anisotropic lattices with anisotropy tuned toas/at =3.5 ([5],[6]). The lattice spacing in units of r0 is given by r0/as=3.221(25) and the lattice size was 203×128. The results are from 90 configurations separated by 40 trajectories. A simple jackknife analysis suggests that the results are independent within the errors. Preliminary results for the two-pion correlation function and scattering length were reported on a smaller lattice, 163×128 with a pion
mass of∼390MeV in Ref. [7]. We use the same pion mass and five of the lowest momenta pion
operators to project out the S-wave scattering state in the center of mass frame.
3.2 I=2Correlation Function
The I=2 correlation function is constructed in the usual way by computing the “direct" and “crossed" diagrams. The direct diagram is simply the square of the single pion correlation function,
Cπ(t,t0) =Q˜(t,x;t0,x0)†Q˜(t,x;t0,x0).
The correlation matrix for the quark exchange diagram is given by
C(i jcross)(t,t0) =
Vz†0,tM˜u–1(z0,t;x000,t0)Vx000t0 V †
y000t 0Vy
000t 0
e−iqjy000
Vx†,tM˜u–1(z
0
,t;z000,t0)Vz000t0 V †
ytVyt
eipiy
Vz†,tM˜u–1(z,t;x
00,
t0)Vx00t
0 V
†
y00t 0Vy
00t 0
eiqjy00
Vx†0,tM˜u–1(x0,t;z00,t0)Vz000t
0 V
†
y0tVy0t
e−ipiy0
whereVx,t is the matrix whose columns are the eigenvectors, v(i)and the sum over the momenta
is carried out to project out the S-wave. TheI =2 channel is obtained by subtracting the quark
exchange diagram (C(cross)) from the square of the single pion correlation function,Cπ,iCπ,j,
Ci,j=Cπ,iCπ,j−C
(cross)
Table 1:Phase shifts from the two-pion energies.
n atE
(i)
π π asp(i) n˜ δ(p(i))
0 0.150(3) 0.04(4) 0.015(33) -1.8(57) 1 0.275(4) 0.326(4) 1.078(26) -15(5) 2 0.368(4) 0.457(6) 2.118(58) -16(7) 3 0.447(9) 0.54(1) 3.01(13) -3(30)
The correlation matrix is diagonalized att∗/at =25 with the metric timeslice atto/at =15 so as to reduce the contribution from excited states as much as possible without losing the signal to the noise. The stability with respect tot∗andtohas been checked for the lowest-lying four states.
3.3 Extracting the Phase Shift
We follow Luscher’s method to compute the phase shift in the infinite volume from the spectra of the two-particle state in a finite volume. First, the physical momenta of the pions is determined from the spectra of the two-particle states and the dispersion relation,
(aspn)2=ξ2(atm)2 "
(atEπ π) 2(atm)
2
−1 #
whereξ=3.5 is the anisotropy andatmis the pion mass (in lattice units) at rest. We then compute the modified Zeta function,Z00(1; ˜n)to obtain the phase shift at momentumasp,
tanδ(pn) = π 3/2√n˜
Z00(1; ˜n) where ˜n= (aspn) 2/
2π
L/as
2
.
The results are tabulated in Table1and plotted in Fig.1.
4. t-to-t Diagrams
One of the major challenges in lattice hadron spectroscopy is the evaluation of contributions from disconnected diagrams and box diagrams that appear in correlation functions. These diagrams
require the quark propagator from a timeslicet, back tot (t-to-t diagrams) on some number of
timeslices. One way to compute these contributions would be to compute wall propagators from every timeslicetwhich would require at leastNttimes more inversions than before (on our lattices, this factor is roughly 128). While this is not impossible to do in practice, we note that it may be unnecessary as the measurements from neighbouring timeslices may be strongly correlated, and also because the signal diminishes exponentially with time. The other more important reason to combine the LapH method with a stochastic algorithm is to control the number of eigenvectors of the Laplacian that needs to be computed as one progresses to larger and larger lattices.
4.1 Stochastic Estimation
We chooseZ4noise for our stochastic sources which fits naturally with having complex fields
0 0.1 0.2 0.3 0.4 0.5 0.6 0.7 0.8 0.9 p2 (GeV2)
-50 0 50
δ
(p)
cont. 2-loop χ p.t. (140 MeV) cont. 2-loop χ p.t. (390 MeV)
[image:5.595.169.413.113.298.2]CERN-Munich experiment 203x128 Lattice Mπ=390 MeV 90 configs
Figure 1:Preliminary results for theI=2 phaseshift atmπ=390MeV (Our points are shown as circles).
The two-loop chiral perturbation theory curve was reproduced using the parametrization from Ref. [10] and the 390 curve was generated by shifting the pion mass.
choices ([8]). Independent Z4 noise sources, ρ[i], need to be chosen for each quark line in the
correlation function of interest. These have the property
hhρii=0 and hhρ[i]ρ[†j]ii=δi j
where the double bracket indicates an average over the noise sources. The quark propagator on a given configuration can then be written as,
Q = DjStM–1hhρ ρ†iiSt0D †
k
= hhDjStM–1ρ(DkSt0ρ)
†ii
whereDjis the covariant displacement operator in direction ˆej.
In order to avoid contaminating the eigenvectors of the Laplacian with our random noise
sources, we place theZ4noise only in the LapH subspace. The noise vectors therefore only have
spin and eigenvector indices on each timeslice. The noise vectors will be fully diluted in the time direction for connected diagrams, but can be interlaced in time for the disconnected diagrams. The full dilution scheme is given by
ρ[A]si(t)ρ[†B]s0i0(t0) =δABδtt0δss0δii0
0 1 2 3 4 5 6 7 8 9 10 11 12 13 14 15 t
0 1
-ln[ C(t+1)/C(t) ]
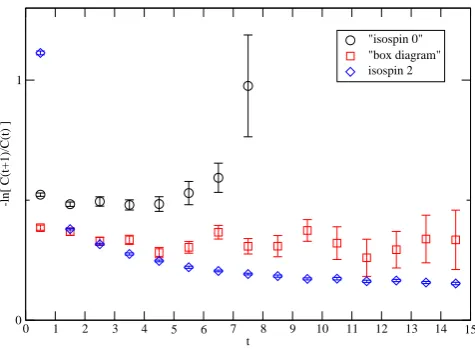
[image:6.595.174.412.122.297.2]"isospin 0" "box diagram" isospin 2
Figure 2:Logarithmic ratios of correlation functions. The data with the label “I=0" has all contributions to
the correlator except for the disconnected diagrams.
other as long as they have a separation that is five (a conservative estimate) or greater. This leads to an interlaced dilution scheme which have noise sources on more than one timeslice, but separated by several timeslices. The same can be done for the eigenvector indices and the spin degrees of freedom.
4.2 A box diagram example
We have computed the box diagram that appear in theI=0 channel to test the efficacy of the “stochastic LapH" method. The box diagram can be written in a compact form by using the noise source vectors, ˜ρ[A]s,i(t0,~x0), and the corresponding solutions, ˜ϕ[A]s,i(t,~x) =M–1ρ˜[A]s,i(t0,~x0)as
˜
ρ[(0a])t†(~x1)γ5ϕ˜[(3d])t(~x1) ρ˜[(3d])t†(~x10)γ5ϕ˜[(2c])t(~x01) ρ˜[(2c])t†
0(~x
0
0)γ5ϕ˜[(1b])t
0(x
0
0) ρ˜
(b)†
[1]t0(~x0)γ5ϕ˜
(a) [0]t0(~x0)
(4.1) where the colour indices are contracted within the round brackets and the dilution indices have been combined into one superscript. (This example is given for the usual Dirac matrix.)
The logarithmic ratios for the I =0 correlation function with the box diagram but without the disconnected diagrams is shown in Fig.2. We obtain a good signal for the box diagram with with a single timeslice source for the propagator fromt0tot(and interlace 6 for the eigenvectors)
and time (interlace 12) and eigenvector (interlace 4) dilutions with full spin dilution. The ratio of correlators of neighbouring timeslices for theI=2 and theI=0 correlator (without the completely
disconnected diagrams) are shown are shown in Fig.2.
5. Summary
two of the simplest two-particle states. For theI =2 channel, the phase shift has been computed with several pion operators with non-zero momenta through Lüscher’s finite volume method. We have obtained a good signal for the first three, lowest lying momenta states in a(∼2.5 fm)3volume formπ'390MeV with 90 configurations. It is clear that we require lighter pions and larger boxes in order to compare with chiral perturbation theory calculations. These simulations are under way. The box diagram in theI =0 channel has been computed using a new stochastic algorithm (stochastic LapH) in order to handle thet-to-tdiagrams. Apart from the fact that this method can extend the LapH algorithm to large lattice volumes, it allows the simulation oft-to-tdiagrams in an efficient way. We are currently working on the fullI =0 calculation with disconnected diagrams and theI=1 channel to study theρdecay.
Acknowledgements
This work has been partially supported by National Science Foundation awards PHY-0970137, PHY-0510020, PHY-0653315, PHY-0704171 and through TeraGrid resources provided by Athena at the National Institute for Computational Sciences (NICS) under grant number TG-PHY100027 and NICS and the Texas Advanced Computing Center under TG-MCA075017. M.P. is supported by Science Foundation Ireland under research grant 07/RFP/PHYF168. We thank our colleagues within the Hadron Spectrum Collaboration. These calculations were performed using the Chroma software suite [12].
References
[1] M. Peardonet al.[Hadron Spectrum Collab.], Phys. Rev. D80, 054506 (2009) arXiv:0905.2160. [2] M. Luscher, Commun. Math. Phys.105, 153 (1986); M. Luscher, Nucl. Phys. B354, 531 (1991);
M. Luscher, Nucl. Phys. B364, 237 (1991).
[3] W. Wilcox, arXiv:hep-lat/9911013. J. Foleyet al., Comput. Phys. Commun.172(2005) 145, arXiv:hep-lat/0505023.
[4] C. Morningstar and M. J. Peardon, Phys. Rev. D69, 054501 (2004) [arXiv:hep-lat/0311018].
[5] R. G. Edwardset al., Phys. Rev. D78, 054501 (2008) [arXiv:0803.3960 [hep-lat]].
[6] H. W. Linet al.[Hadron Spectrum Collab.], Phys. Rev. D79, 034502 (2009) [arXiv:0810.3588]. [7] J. Bulavaet al., PoSLAT2009, 097 (2009) [arXiv:0911.2044 [hep-lat]].
[8] S. J. Dong and K. F. Liu, Phys. Lett. B328, 130 (1994).
[9] J. Foleyet al., these proceedings.
[10] G. Colangeloet al., Nucl. Phys.B 603(2001) 125, hep-ph/0103088.
[11] JLQCD (S. Aokiet al.), Phys. Rev.D 66(2002) 077501, hep-lat/0206011. CP-PACS (S. Aokiet al.), Phys. Rev.D 67(2003) 014502, hep-lat/0209124. M. Fukugitaet al., Phys. Rev.D52(1995) 3003. C. Liuet al., Nucl. Phys.B624(2002) 360. JLQCD, Phys. Rev.D66(2002) 077501. CP-PACS, Phys. Rev.D67(2003) 014502. CP-PACS, Phys. Rev.D70(2004) 074513. S. R. Beaneet al., Phys. Rev. D
77, 014505 (2008) [arXiv:0706.3026 [hep-lat]]. X. Fenget al., Phys. Lett. B684, 268 (2010) [arXiv:0706.3026 [hep-lat]].