Automated Scoring Across Different Modalities
Anastassia Loukina and Aoife Cahill Educational Testing Service
660 Rosedale Rd Princeton, NJ 08541, USA
[email protected], [email protected]
Abstract
In this paper we investigate how well the sys-tems developed for automated evaluation of written responses perform when applied to spoken responses. We compare two state of the art systems for automated writing evalua-tion and a state of the art system for evaluat-ing spoken responses. We find that the sys-tems for writing evaluation achieve very good performance when applied to transcriptions of spoken responses but show degradation when applied to ASR output. The system based on sparsen-gram features appears to be more ro-bust to such degradation. We further explore the role of ASR accuracy and the performance and construct coverage of the combined model which includes all three engines.
1 Introduction
In this paper we evaluate how well the systems developed for automated evaluation of written re-sponses perform when applied tospokenresponses. We use a corpus of spoken responses to an English language proficiency test and compare the perfor-mance of two state-of-the-art systems for evaluating writing and a state of the art system for evaluating spoken responses.
Automated speech scoring, until recently, pri-marily focused on evaluating pronunciation and prosody of highly constrained read speech (Bern-stein et al., 1990; Neumeyer et al., 1996; Witt and Young, 2000). With the improvement in automatic speech recognition technology, automated scoring has lately also been applied to constructed responses where the content of the response may not be known
in advance (Zechner et al., 2009; Cheng et al., 2014). Earlier scoring systems for such responses still pri-marily evaluated delivery aspect of the response, but there has also been a growing amount of work on automatic evaluation of grammar, vocabulary and content of spoken responses (Bernstein et al., 2010; Chen and Zechner, 2011; Xie et al., 2012; Bhat and Yoon, 2015).
While automatic evaluation of these high-level as-pects of language proficiency is a relatively new field in automated speech scoring, there exists a substan-tial body of research on evaluating these constructs in written responses including several systems al-ready used operationally for scoring responses to high-stakes language proficiency tests (see Shermis (2014) for a comprehensive overview).
Automated scoring systems for spoken and writ-ten responses generally share a common structure: they extract a set of features measuring different aspects of language proficiency and use a machine learning algorithm to map those features to a human score. There is also a substantial overlap in the crite-ria used to score grammar and vocabulary of spoken and written responses. Therefore, it is not unreason-able to expect that some of the features developed for evaluating writing will also be applicable to scor-ing spoken responses (cf. Crossley and McNamara (2013)).
On the other hand, the performance of such fea-tures can be affected by a number of factors. First of all, many grammatical features rely on knowl-edge of sentence boundaries in order to parse the response into syntactic constituents. In written re-sponses the sentence boundaries can be established
based on punctuation. In spoken responses, how-ever, these have to be estimated using machine learn-ing algorithms such as the ones described in Chen and Yoon (2011). Furthermore, sentence boundaries in speech are often ambiguous. These factors may lead to a decrease in feature performance.
Second, in automated speech scoring the tran-scription of the spoken responses necessary to eval-uate grammar and vocabulary is obtained using au-tomated speech recognition (ASR) (Higgins et al., 2011). These systems may incorrectly recognize certain words introducing additional noise into the feature input and consequently lowering their per-formance.
Finally, spoken and written discourse differ in what is considered appropriate in terms of language use (Chafe and Tannen, 1987; Biber and Gray, 2013). Thus, for example, sentence fragments typ-ically considered inappropriate for written language are generally very common in unscripted spoken re-sponses. This may also impact how well the features developed for written responses perform on spoken responses.
We first introduce three state-of-the-art opera-tional systems for automated scoring. We then apply the engines for evaluating writing to a corpus of spo-ken responses. Finally, we evaluate whether com-bining different engines leads to further improve-ment in system performance and construct coverage.
2 Automated scoring systems 2.1 e-raterR
e-raterR (E) is an engine that can automatically
pro-vide feedback on students’ writing, as well as au-tomatically assign a score to that writing. Using statistical and rule-based NLP methods,Eidentifies and extracts several feature classes for model build-ing and essay scorbuild-ing (Attali and Burstein, 2006; Burstein et al., 2013)). Individual feature classes typically represent an aggregate of a larger feature set and are designed to capture a specific aspect of the construct being measured. The feature classes used in this paper include the following: (a) gram-matical errors (e.g., subject-verb agreement errors), (b) word usage errors (e.g., their versus there), (c) presence of essay-based discourse elements (e.g., thesis statement, main points, supporting details,
and conclusions), (d) development of essay-based discourse elements, (e) a feature that considers cor-rect usage of prepositions and collocations (Futagi et al., 2008), and (f) sentence variety. To train a new scoring model, features are extracted from a training data set, and a linear model (roughly equivalent to non-negative least squares regression) is learned.
2.2 c-rater-ML
c-rater-ML (C) is an automated scoring engine orig-inally designed to evaluate the content of a student response. It is typically applied to short responses ranging from a few words to a short paragraph. Therefore, in contrast to E andS many of the fea-tures used in theCengine are sparse lexicalized fea-tures similar to the ones described in Heilman and Madnani (2013). In addition to word and character
n-gram features, the models also include syntactic dependency features. As a result of the large num-ber of sparse features, the modeling technique for this kind of feature set needs to be different from a straightforward linear model. C employs a Sup-port Vector Regressor with a radial basis function kernel. We use this alternative approach to scor-ing (with many sparse lexical features and a non-linear learning function) to contrast with the typical scoring models used for evaluating speech or writing quality.
2.3 SpeechRater
SpeechRatersm(S) (Zechner et al., 2009) is an
auto-mated scoring engine that is designed to evaluate the quality of spontaneous spoken responses. Using sig-nal processing as well as NLP techniques,Sextracts features for evaluating both the delivery characteris-tics (e.g. fluency, pronunciation) and the language use characteristics (e.g. grammar, vocabulary) of each response.
model and a 4-gram language model with a vocabu-lary size of 65,000 words.
TheSmodel used in this study contained 18 fea-tures. Of these, 15 features covered various as-pects of delivery such as fluency, pronunciation and rhythm. Three features measured language use. These feature were: (1) average log of the frequency of all content words (Yoon et al., 2012), (2) CVA-based comparison between the lexical content of each response and the reference corpus (based on Xie et al. (2012)) and (3) a CVA-based comparison computed based on part-of-speech tags (Bhat and Yoon, 2015). As in case ofE, the final score is com-puted as a linear combination of these features.
3 Data and methodology 3.1 Corpus of spoken responses
The study is based on a corpus of 5,884 spoken re-sponses to an English language proficiency test ob-tained from 996 speakers. The corpus contains up to six responses from each speaker. Each response was unscripted and around 1 minute long.
The corpus was equally split into training and evaluation sets (2,941 responses each). There was no overlap of speakers or prompts in the two sets. All responses were assigned a holistic proficiency score by expert raters. The scores ranged from 1 (low proficiency) to 4 (high proficiency). The raters evaluated the overall intelligibility of responses, grammar, the use of vocabulary, and topic develop-ment. To obtain human benchmarks, 136 responses from the evaluation set were scored by two raters. The agreement between the two raters was Pearson’s
r= 0.56.
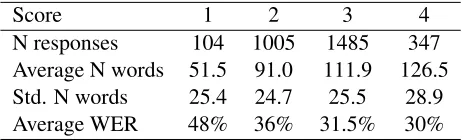
All responses were transcribed by a professional transcription agency. The average length of tran-scribed responses was 104 words (σ= 30) with the length of 50% of the responses falling between 84 and 124 words. The responses from more profi-cient speakers were generally longer: the number of words in the response was moderately correlated with proficiency score with Pearson’sr= 0.51 (p <
0.0001). Table 1 shows the number of responses in the evaluation set assigned to each score category as well as the mean and standard deviation of the num-ber of words in the transcriptions of these responses. Finally, we computed the word error rate (WER)
Score 1 2 3 4
[image:3.612.313.544.54.124.2]N responses 104 1005 1485 347 Average N words 51.5 91.0 111.9 126.5 Std. N words 25.4 24.7 25.5 28.9 Average WER 48% 36% 31.5% 30%
Table 1:The total number of responses in each score category, the average number of words/standard deviation of transcribed responses and the average ASR word error rate for responses in each category.
for the ASR output for each response in our corpus. The average WER for the whole corpus was 34% (σ = 13.7). The ASR was somewhat more accu-rate for more proficient speakers with the correlation between response WER and response score Pear-son’sr = -0.24 (p <0.0001). As can be seen from Table 1, the relationship between WER and profi-ciency scores was non-linear: the WER was sub-stantially greater for speakers with the lowest pro-ficiency level (score 1), the difference between the rest of the speakers was smaller.
3.2 Method
3.2.1 Feature extraction
We used each of the three engines to extract the corresponding features for each response. Fea-tures forSwere extracted following the operational pipeline from the sound recording of the response with all features including those related to language use computed on the ASR output. ForEandCthe features were extracted using three different inputs: (1) the ASR output (the same as used inS), (2) the expert human transcription which included punctua-tion, and (3) the human transcription after removing all punctuation. All transcriptions were processed to remove fillers such as ‘uhm’ and ‘uh’, word frag-ments and repeated words.
3.2.2 Model building
We then used various combinations of features to compare the performance of the engines. ForSand
training set and used these predicted scores as a sin-gle “C” feature. For the evaluation set this feature corresponded to scores predicted for the evaluation set using theCmodel trained on the training set.
We then trained a series of models based on differ-ent combinations of features from the three engines. The coefficients for all models were estimated on the training set using non-negative least squares regres-sion. The models were then used to generate predic-tions on the evaluation set. Finally, in all cases the predictions were re-scaled using a normal transfor-mation to match the distribution of human scores on the training set.
4 Results
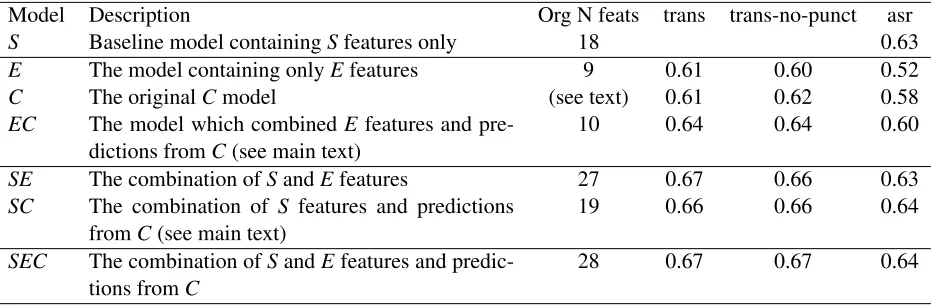
Table 2 shows the performance of all 19 models in terms of correlation (Pearson’sr) between predicted and observed scores for the evaluation set. We used Steiger’s method for comparing dependent correla-tions (Steiger, 1980)1 to evaluate whether the
dif-ferences between models are statistically significant. Unless stated otherwise, all reported differences are significant atα= 0.01 after applying Bonferroni cor-rection for multiple comparisons.
4.1 Performance ofEandCon transcriptions
When used with human transcription, both E and
C performed close to the S baseline (r = 0.61 for
E, 0.61 forCand 0.63 forS, the differences are not significant). There was a small improvement from combining the two automated writing evaluation en-gines (EC) withrincreasing to 0.64.
4.2 Performance ofEandCon ASR output
There was a decrease in performance of both writing engines when the features were computed on ASR output. The degradation was larger forE(from 0.61 to 0.52). Cappeared to be more robust to the noise introduced by ASR with the performance decreas-ing from 0.61 to 0.58. The model based on the com-bination of both engines computed on ASR output achievedr= 0.60.
We further explored the reason for degradation between the features computed on transcription and ASR output. As discussed in the introduction, ASR
1We used the Python implementation from
https://github.com/psinger/CorrelationStats
output does not contain sentence boundaries neces-sary for the computation of some of the features. To evaluate the impact of this factor we computed a new set of features using human transcriptions with punctuation removed. We found that this had no sig-nificant effect on model performance.
We next looked at the effect of response WER on the accuracy of the scoring engine for this response. We first hypothesized that the scoring error may be greater for responses with higher WER. To test this hypothesis we computed the correlation between the scoring error (the absolute difference between pre-dicted and observed score) and the WER for each response. As expected, there was no significant cor-relation when automated scores were computed on transcriptions with or without punctuation. Surpris-ingly, the correlations between WER and scoring er-ror for scores computed on ASR output were very low: r = 0.09 (p < 0.00001) forEandr = 0.07, p
= 0.0001 forC . In other words, there was no lin-ear relationship between the response WER and the scoring error.
We also tested whether the relationship between the scoring error and WER was further obscured by training the models on already “noisy” ASR outputs. We retrained theE,CandECmodels using the fea-tures computed on transcriptions and then evaluated them using features computed on ASR outputs. We found that the performance of these new models was similar (E) or slightly lower (C and EC) than the performance of the models trained on ASR outputs. Furthermore, the correlation between the WER and scoring error for these models were as low as the correlations observed for ASR-trained models.
4.3 Combined performance of all three engines
Finally, we evaluated the performance and construct coverage of the model based on the combination of all three engines.
We found that the performance improved ifS fea-tures were combined with writing feafea-tures computed based on transcriptions. This is not surprising con-sidering that allS features were computed on ASR output and therefore the new features computed on transcriptions most likely contained the information lost due to inaccurate ASR.
Model Description Org N feats trans trans-no-punct asr
S Baseline model containingSfeatures only 18 0.63
E The model containing onlyEfeatures 9 0.61 0.60 0.52
C The originalCmodel (see text) 0.61 0.62 0.58
EC The model which combinedE features and
pre-dictions fromC(see main text) 10 0.64 0.64 0.60
SE The combination ofSandEfeatures 27 0.67 0.66 0.63
SC The combination of S features and predictions
fromC(see main text) 19 0.66 0.66 0.64
SEC The combination ofSandEfeatures and
[image:5.612.74.540.54.207.2]predic-tions fromC 28 0.67 0.67 0.64
Table 2:Summary of performance (Pearson’srbetween the predicted and human score) of all 19 models evaluated in this study. The table shows the original number of features and the model performance for different types of input (see section 3.2.1). The final number of features in the model may be less than the original number of features since all coefficients were set to be positive.
combiningSandE(SE),C(SC) or all three engines (SEC).
We also evaluated which features had the biggest contribution to the final score in different models. In the baselineSmodel, delivery features (fluency, pro-nunciation, and prosody) accounted for 80% of the final score. The language use features accounted for the remaining 20%. In the combined model, the rel-ative contribution of language use features increased to 38% forSE, 37% forSCand 44% forSEC. Thus in the combined model the delivery and language use features are more evenly balanced.
5 Discussion
In this paper we explored how well state-of-the-art engines for evaluating written responses per-form when applied to transcriptions of spoken re-sponses. Surprisingly, we found that the writing en-gines achieve relatively high agreement with human scores even though they do not measure some funda-mental aspects of spoken language proficiency: flu-ency and pronunciation. At the same time, there was no improvement between the baselineSsystem and a system that combines all three engines.
Furthermore, the drop in performance of writing engines when moving from well-formed transcribed text to ASR output is not as high as one might ini-tially expect given the relatively high WER in this data set. We also found that the relationship between the ASR accuracy and scoring error was not straight-forward and deserves further study. Finally, lack of sentence boundaries had no effect on the engine
per-formance.
C engine showed good agreement with human scores even though there was no overlap between prompts in training and evaluation sets and there-fore the model could not learn any specifics relevant to particular prompts and had to rely on general pat-terns of word use.
Our results highlight the complex role of con-struct in automated scoring. The majority of speak-ers who show good performance along one of the dimensions of language proficiency generally also score high along other dimensions. This is ex-emplified by our result that writing engines which measured only one aspect of spoken responses still showed relatively high agreement with holistic scores. Consequently, as shown in this study, the gain in performance from combining different en-gines is small or non-existent. However, a system which heavily relies on features measuring a single aspect of proficiency is sub-optimal both in terms of validity of the final score and the system vulnerabil-ity to various gaming behaviours.
Acknowledgments
We thank Keelan Evanini, Su-Youn Yoon, Brian Ri-ordan, Klaus Zechner and two anonymous BEA re-viewers for their comments and suggestions.
References
Yigal Attali and Jill Burstein. 2006. Automated es-say scoring with e-raterRv.2. Journal of Technology, Learning, and Assessment, 4(3).
Jared Bernstein, Michale Cohen, Hy Murveit, Dimitry Rtischev, and Mitchel Weintraub. 1990. Automatic Evaluation and Training in English Pronunciation. In Proceedings of ICSLP 90, pages 1185–1188.
Jared Bernstein, Jian Cheng, and Masanori Suzuki. 2010. Fluency and Structural Complexity as Predictors of L2 Oral Proficiency. Proceedings of Interspeech 2010, Makuhari, Chiba, Japan, pages 1241–1244.
Suma Bhat and Su-Youn Yoon. 2015. Automatic assess-ment of syntactic complexity for spontaneous speech scoring.Speech Communication, 67:42–57.
Douglas Biber and Bethany Gray. 2013. Discourse Char-acteristics of Writing and Speaking Task Types on the TOEFL iBT Test: A Lexico-Grammatical Analysis. ETS Research Report, RR-13-04.
Jill Burstein, Joel Tetreault, and Nitin Madnani. 2013. The e-rater automated essay scoring system. In Mark D. Shermis and Jill Burstein, editors,Handbook of automated essay evaluation: Current applications and new directions. Routledge, New York, NY. Wallace Chafe and Deborah Tannen. 1987. The relation
between written and spoken language. Annual Review of Anthropology, 16:383–407.
Lei Chen and Su-Youn Yoon. 2011. Detecting struc-tural events for assessing non-native speech. Proceed-ings of the 6th workshop on Innovative Use of NLP for Buidling Educational Applications, pages 38–45. Miao Chen and Klaus Zechner. 2011. Computing and
Evaluating Syntactic Complexity Features for Auto-mated Scoring of Spontaneous Non-Native Speech. Proceedings of the 49th Annual Meeting of the Associ-ation for ComputAssoci-ational Linguistics, pages 722–731. Jian Cheng, Yuan Zhao D’Antilio, Xin Chen, and Jared
Bernstein. 2014. Automatic Assessment of the Speech of Young English Learners. Proceedings of the 9th Workshop on Innovative Use of NLP for Building Educational Applications, pages 12–21.
Scott Crossley and Danielle McNamara. 2013. Applica-tions of Text Analysis Tools for spoken response grad-ing. Language Learning & Technology, 17(2):171– 192.
Yoko Futagi, Paul Deane, Martin Chodorow, and Joel Tetreault. 2008. A computational approach to de-tecting collocation errors in the writing of non-native speakers of english. Computer Assisted Language Learning, 21:353–367.
Michael Heilman and Nitin Madnani. 2013. ETS: Do-main adaptation and stacking for short answer scoring. InSecond Joint Conference on Lexical and Computa-tional Semantics (*SEM), Volume 2: Proceedings of the Seventh International Workshop on Semantic Eval-uation (SemEval 2013), pages 275–279.
Derrick Higgins, Xiaoming Xi, Klaus Zechner, and David Williamson. 2011. A three-stage approach to the automated scoring of spontaneous spoken re-sponses. Computer Speech & Language, 25(2):282– 306.
Leonardo Neumeyer, Horacio Franco, Mitchell Wein-traub, and Patti Price. 1996. Automatic text-independent pronunciation scoring of foreign language student speech. Proceeding of Fourth International Conference on Spoken Language Processing. ICSLP ’96, 3:1457–1460.
Mark D. Shermis. 2014. State-of-the-art automated es-say scoring: Competition, results, and future direc-tions from a United States demonstration. Assessing Writing, 20:53–76.
James H Steiger. 1980. Tests for comparing ele-ments of a correlation matrix. Psychological Bulletin, 87(2):245.
Silke M. Witt and Steve J. Young. 2000. Phone-level pronunciation scoring and assessment for interactive language learning. 30(2):95–108.
David H. Wolpert. 1992. Stacked generalization. Neural Networks, 5:241–259.
Shasha Xie, Keelan Evanini, and Klaus Zechner. 2012. Exploring content features for automated speech scor-ing. InNAACL HLT ’12 Proceedings of the 2012 Con-ference of the North American Chapter of the Associa-tion for ComputaAssocia-tional Linguistics: Human Language Technologies, pages 103–111.
Su-Youn Yoon, Suma Bhat, and Klaus Zechner. 2012. Vocabulary profile as a measure of vocabulary sophis-tication. Proceedings of the Seventh Workshop on the innovative use of NLP for Building Educational Appli-cations, pages 180–189.