Nonlinear absorption properties of some
1,4,8,11,15,18,22,25-octaalkylphthalocyanines and their metallated derivatives
Aure´lien Auger,
aWerner J. Blau,*
bPaul M. Burnham,
aIsabelle Chambrier,
aMichael J. Cook,*
aBenjamin Isare,
aFabien Nekelson
aand Sean M. O’Flaherty
ba
Wolfson Materials and Catalysis Centre, School of Chemical Sciences and Pharmacy, University of East Anglia, Norwich, UK NR4 7TJ
b
Materials Ireland Polymer Research Centre, Department of Physics, Trinity College Dublin, Dublin 2, Republic of Ireland
Received 7th January 2003, Accepted 6th March 2003
First published as an Advance Article on the web 26th March 2003
The third-order nonlinear optical properties of a series of 15 unmetallated and metallated 1,4,8,11,15,18,22,25-octaalkylphthalocyanines have been investigated. The palladium-metallated compound is the strongest nonlinear absorber of the series, but, due to its comparatively high linear absorption coefficient, it exhibits a relatively low ratio of excited- to ground-state absorption cross-sections (k) when compared to the other compounds. The highest values forkwere found for derivatives metallated with indium and lead. The nickel-metallated compounds are the weakest nonlinear absorbers, indicating that they are unsuitable as potential materials for practical passive optical limiters. Phenomenologically, the data forkand the saturation energy density (Fsat) were found to follow trends dependent upon the linear absorption coefficient. This may have
some implications for the design of phthalocyanines for nonlinear optical applications.
1 Introduction
Optical limiters are materials that exhibit decreased transmis-sion of light as incident light intensity is increased. Such a property, when applied to the attenuation of incident light intensity from laser pulses,1for example, is recognised to have potential applications for the protection of human eyes and optically sensitive equipment. The phenomenon is a conse-quence of one or more nonlinear absorption processes, among which reverse saturable absorption (RSA) is recognised to be particularly important.2 During RSA, nonlinear absorption
arises through further electronic excitation within a molecule already in an electronically excited state. Compounds exhibit-ing RSA as a result of T1AT2excitation are most efficient as
optical limiters when (i) there is efficient intersystem crossing from the S1excited state to T1, (ii) the T1state is long lived and
(iii) the T1AT2transition has a large absorption cross-section.
Phthalocyanines and their derivatives are attractive candidates for optical limiting3,4because the ring system exhibits a number
of the appropriate photophysical properties. Furthermore, there is potential to tune the desirable properties through the incorporation of different elements into the central cavity and/or substitution of the ring system.5–8Metallated
phthalo-cyanines shown to possess useful optical limiting behaviour include those containing aluminium,9indium,10silicon,11 vana-dium,12lead,13titanium,14nickel,15gallium,16tin17and various lanthanides.18In previous studies, compounds have generally been substituted to promote solubility. Ideally, substituents should also minimise cofacial aggregation, because this intro-duces further relaxation pathways which serve to shorten excited-state lifetimes. Thus derivatives bearing one or two axial ligands at the metal (or metalloid) centre, as in the majority of metallated phthalocyanines listed above, have received considerable attention.
Previous work from one of our laboratories19has
demon-strated that eight straight alkyl chains located at the 1, 4, 8, 11, 15, 18, 22 and 25 sites of the phthalocyanine nucleus pro-mote solubility in most aprotic organic solvents, particularly when the chains contain an even number of carbon atoms;20
they also have a beneficial effect in reducing aggregation.20iso -Pentyl groups in these sites cause distortion of the ring from planarity in the metal-free phthalocyanine and also show advantageous solubilising effects.21The present paper reports
a systematic study and comparison of the nonlinear absorption properties of a series of 15 octaalkyl-substituted compounds, covering a range of 7 metal centres, as well as the metal-free analogues. Measurements have been undertaken using the Z-scan method to investigate the nonlinear excited-state behaviour of the compounds and provide an insight into the effects of structural modification on the nonlinear optical response of phthalocyanine moieties.
2 Experimental
2.1 Characterisation
1H NMR spectra were recorded at 270 MHz using a JEOL
EX 270 spectrometer, at 300 MHz on a Varian Gemini 2000 spectrometer or at 400 MHz on a Varian Unityplus
spectro-meter.13C NMR spectra were measured on the same equip-ment at 67.5, 75 and 100 MHz, respectively. Tetramethylsilane was used as the internal standard and the positions of the peaks are reported in ppm. The splittings of the signals are described as singlets (s), doublets (d), triplets (t), quartets (q), quintets (qn), broad (br) or multiplets (m). The UV-Vis spectra were recorded using a Hitachi U-3000-X spectrophotometer. Low resolution matrix-assisted laser desorption ionisation (MALDI) mass spectra were obtained using a dithranol matrix at the University of Manchester, UK. Elemental analysis was carried out by the microanalytical service provided at the University of East Anglia by Mr A. W. Saunders.
Solvents were HPLC grade or better. They were not speci-fically dried unless otherwise stated. Petrol refers to light petroleum (b.p. 40–60uC).
Silica gel (Merck grade 7734) was used in chromatographic separations. TLC was performed using Merck 5554 silica gel on aluminium sheets.
1042 J. Mater. Chem., 2003,13, 1042–1047 DOI: 10.1039/b300199g
Downloaded by Trinity College Dublin on 14/05/2013 12:35:17.
2.2 NLO measurements
The open-aperture Z-scan technique22 measures the total
optical transmittance through a sample as a function of incident laser intensity while the sample is gradually moved through the focus of a lens (along the zaxis). The set-up is shown schematically in Fig. 1. Absorption coefficients were calculated by the fitting theory previously reported.22 The normalised transmittance as a function of position z (see Fig. 3),Tnorm(z), is given by
Tnorm(z)~
ln½1zq0(z)
q0(z)
(1)
whereq0(z) is given by
q0(z)~
q00
1z z
z0 2
(2)
z0is the diffraction length of the beam and q00~ beffI0Leff,
whereLeff~[12exp(2a0L)]/a0,beffis the effective
intensity-dependent nonlinear absorption coefficient and I0 is the
intensity of the light at focus.Leff is known as the effective
length of the sample and is defined in terms of the linear absorption coefficient, a0, and the true optical path length
through the sample,L.
The imaginary third-order optical susceptibility, Im{x(3)}, is directly related to the intensity-dependent absorption coeffi-cient,bI, and is expressed as
Imx(3) ~n20e0clbI
2p (3)
wheren0is the linear refractive index,e0is the permittivity of
free space, cis the speed of light and lis the wavelength of the incident light. This expression is strictly only true for con-stantbIover incident intensities, corresponding to the
physi-cal situation where third-order effects are the only contribution to the nonlinear response. The relationship between Im{x(3)}
and the imaginary second-order molecular hyperpolarisability, Im{c}, is defined as
Imfcg~Im x
(3)
f4c
molNA
(4)
wheref~(n0212)/3 is the Lorentz local field enhancement
factor,n0 is the linear refractive index of the sample,cmolis
the molar concentration andNAis Avogadro’s number.
All experiments described in this study were performed using 6 ns pulses from a Q-switched Nd : YAG laser. The beam was spatially filtered to remove the higher order modes and tightly focused with a 9 cm focal length lens. The laser was operated at its second harmonic, 532 nm, with a pulse repetition rate of 10 Hz. All samples were prepared by dissolving the compound in a suitable common organic solvent (toluene or THF) at 1.0 g L21, followed by gentle agitation for #20 min in a low power (60 W) sonic bath to ensure complete and uniform dispersal. All measurements were performed in quartz cells with a 1 mm through path length.
2.3 Materials
The synthesis and characterisation of1,2,233,214,5,246and
720have been described elsewhere.
Preparation of 1,4,8,11,15,18,22,25-octakis(3-methylbutyl)-phthalocyaninatozinc(II), 8. In a typical procedure, 1,4,8,11, 15,18,22,25-octakis(3-methylbutyl)phthalocyanine23 (3; 320 mg, 0.28 mmol) was dissolved in pentan-1-ol (10 ml) and heated to reflux. Excess metal salt, zinc(II) acetate (0.2 mg, 0.91 mmol),
was added and reflux was continued for 4 h. After the reac-tion mixture had cooled, methanol (10 ml) was added and the precipitate collected and chromatographed over silica gel (eluent: petrol–THF 2 : 1), collecting the green fraction, which was recrystallised from THF–methanol to give8(270 mg, 80%) as blue needles. M.p.w300uC. Found: C, 74.91; H, 8.4; N, 9.4; C72H96N8Zn?CH3OH requires: C, 74.94; H, 8.53; N, 9.58%.dH
(400 MHz, CDCl3) 7.88 (8H, s), 4.59 (16H, t), 2.02 (16H, m),
1.86 (8H, m), 1.03 (48H, d).lmax (abs.) 703 nm (THF),e ~
2.26105M21cm21.
Preparation of 1,4,8,11,15,18,22,25-octakis(3-methylbutyl)-phthalocyaninatocopper(II), 9. 3,6-Bis(3-methylbutyl)phthalo-nitrile23(1.5 g, 5.6 mmol) in pentan-1-ol (16 ml) was brought to reflux and copper(II) acetate (0.30 g, 1.68 mmol) was added.
After addition of DBU (0.60 g, 3.92 mmol), the reaction mixture turned green and reflux was continued for 12 h. The mixture was allowed to cool and the solvents were removed under reduced pressure. The resulting precipitate was washed onto a filter with methanol. The crude product was purified by column chromatography over silica (eluent: petrol–DCM 4 : 1). Recrystallisation from THF–acetone afforded9(320 mg, 22%) as a blue solid. M.p.w300uC. Found: C, 75.7; H, 8.6; N, 9.6; C72H96N8Cu requires: C, 76.05; H, 8.2; N, 9.9%.lmax (abs.)
705 nm (THF),e~0.66105M21cm21.
Preparation of 1,4,8,11,15,18,22,25-octakis(hexyl)phthalo-cyaninatopalladium(II), 10. Compound 10 was prepared as described above for compound8, using 1,4,8,11,15,18,22,25-octakis(hexyl)phthalocyanine (1; 166 mg, 0.14 mmol) and palladium(II) acetate (0.20 g, 0.89 mmol) as the metal salt. The
title compound was obtained as a blue powder (140 mg, 77%). Found: C, 74.47; H, 8.85; N, 8.27; C80H112N8Pd requires: C,
74.35; H, 8.74; N, 8.67%.dH(300 MHz, C6D6) 7.28 (8H, s),
4.01 (16H, t), 1.83 (16H, m), 1.33 (16H, m), 0.98 (32H, m), 0.52 (24H, t).lmax(abs.) 690 nm (cyclohexane),e~1.0610
5
M21 cm21. MALDI-MS: isotopic cluster at 1291 (M1, 100%).
Preparation of 1,4,8,11,15,18,22,25-octakis(hexyl)phthalo-cyaninatolead(II), 11. Compound11was prepared as described above for compound8, using1(120 mg, 0.1 mmol) and lead(II)
acetate in excess (75 mg) as the metal salt. The title compound was purified by column chromatography over silica gel (eluent: petrol–triethylamine 99 : 1) and obtained as green needles (67 mg, 48%). M.p. 144–146uC. Found: C, 69.19; H, 8.17; N, 7.98; C80H112N8Pb requires: C, 69.02; H, 8.05; N, 8.05%.dH
(270 MHz, C6D6) 7.88 (8H, s), 4.98–4.88 (8H, m), 4.67–4.57
(8H, m), 2.35 (16H, qn), 1.74 (16H, qn), 1.45–1.22 (32H, m), 0.83 (24H, t). MALDI-MS: isotopic cluster at 1393 (M1,
100%).lmax(abs.) 746 nm (toluene),e~1.46105M21cm21.
Preparation of 1,4,8,11,15,18,22,25-octakis(3-methylbutyl)-phthalocyaninatolead(II), 12. Compound 12 was prepared as described above for compound8, using3(320 mg, 0.29 mmol) and lead(II) acetate (0.10g, 0.26 mmol) as the metal salt. The
title compound was obtained as green needles (250 mg, 65%). M.p. 256uC. Found: C, 66.95; H, 7.59; N, 8.24; C72H96N8Pb
Fig. 1 Schematic diagram of the open-aperture Z-scan apparatus.
(2)
J. Mater. Chem., 2003, , 1042–1047
Downloaded by Trinity College Dublin on 14/05/2013 12:35:17.
[image:2.595.66.278.56.153.2]requires: C, 67.52; H, 7.55; N, 8.75%.dH (400 MHz, CDCl3)
7.83 (8H, s), 4.92 (8H, m), 4.63 (8H, m), 2.14 (16H, m), 2.0 (8H, m), 1.06 (48H, d).lmax(abs.) 744 nm (THF),e~1.66
105M21cm21.
Preparation of chloro[1,4,8,11,15,18,22,25-octakis(hexyl)-phthalocyaninato]indium(III), 13. 1 (120 mg, 0.1 mmol) was dissolved in pentan-1-ol (7 ml) and heated to reflux. Excess indium(III) chloride (80 mg) was added and reflux was
con-tinued for 2 h. The solvent was removed under reduced pressure and the resultant green residue chromatographed over silica gel, first eluting with petrol to remove a residual amount of the starting material and then with petrol–THF (19 : 1), collecting the first green fraction, which was recrystallised from THF–acetone to give 13 (58 mg, 43%) as fine green needles. M.p. 110–112uC. Found: C, 72.27; H, 8.32; N, 8.17; C80H112N8InCl requires: C, 71.92; H, 8.45; N, 8.39%. dH
(270 MHz, C6D6, 50uC) 7.92 (8H, s), 4.84–4.62 (16H, m), 2.35–
2.24 (16H, m), 1.84–1.70 (16H, m), 1.48–1.22 (32H, m), 0.82 (24H, t).dC(75 MHz, CDCl3) 153.3, 139.5, 134.9, 131.2, 32.6,
32.1, 30.5, 28.9, 22.6, 14.0. MALDI-MS: isotopic cluster at 1336 (M1, 100%).l
max(abs.) 729 nm (toluene),e~2.26
105M21cm21.
Preparation of 4-fluorophenyl[1,4,8,11,15,18,22,25-octakis-(hexyl)phthalocyaninato]indium(III), 14. 1-Bromo-4-fluoroben-zene (1.14 g, 6.5 mmol) in dry THF (10 ml) was added dropwise to a stirred mixture of magnesium turnings (200 mg, 8.2 mmol), 1,2-dibromoethane (4 drops) and iodine (1 crystal) in dry THF (15 ml) under an atmosphere of argon. Once the addition was complete, the reaction mixture was kept at reflux for 90 min before being allowed to cool to room temperature. A portion of the solution (3 ml) containing the Grignard reagent 4-fluorophenylmagnesium bromide was added to a solution of
13(100 mg, 0.07 mmol) in dry THF (2 ml) and stirred at room temperature under an atmosphere of argon. After 10 min, the reaction mixture was concentrated under reduced pressure, triturated with methanol (2 6 10 ml), filtered and the solid purified by column chromatography over silica gel, eluting with petrol–DCM (1/1). The first green fraction was collected and recrystallised from THF–methanol to give14(73 mg, 75%) as blue–green needles. M.p. 127–129uC. Found: C, 73.00; H, 8.42; N, 7.70; C86H116N8InF requires: C, 74.01; H, 8.38; N, 8.03%. dH(400 MHz, CDCl3) 7.87 (8H, s), 5.60 (2H, t), 4.61–4.54 (8H,
m), 4.41–4.34 (8H, m), 3.88 (2H, t), 2.23–2.03 (16H, m), 1.56– 1.45 (16H, m), 1.30–1.14 (32H, m), 0.74 (24H, t).dC(100 MHz,
CDCl3) 154.0, 139.4, 135.6 (d,J6.1), 135.2, 131.1, 113.6 (d,
J 19.0 Hz), 33.0, 32.4, 30.9, 29.1, 22.9, 14.3. MALDI-MS: isotopic cluster at 1395 (M1, 100%).lmax(abs.) 728 nm (THF), e~2.26105M21cm21.
Preparation of dihydroxy[1,4,8,11,15,18,22,25-octakis(hexyl)-phthalocyaninato]silicon, 15. 1(200 mg, 0.17 mmol) and tri-n -butylamine (20 ml) were stirred in freshly distilled dry DCM (18 ml) under argon. When all the starting materials had dissolved, trichlorosilane (1.2 ml, 12 mmol) was addedvia a plastic syringe directly into the solution. The dark green
solution was stirred for 4 h. TLC analysis (eluent: cyclohexane) showed the completion of the reaction after 4 h. The mix-ture was then poured cautiously into water (120 ml) and triethylamine (70 ml) was added slowly. The green precipitate was filtered out and washed with DCM until the washings were almost clear. The organic phase was separated, washed with 20% aq. HCl (56100 ml), water (36100 ml), brine (26 100 ml) and dried over MgSO4.The drying agent was removed
by filtration and the solvent was evaporated under vacuum. The dark blue residue was chromatographed over silica (eluent: cyclohexane–toluene 2 : 1 then 1 : 2). After removing the solvent under reduced pressure, 15 was obtained (180 mg, 87%) as a thick dark blue oil. Found: C, 76.94; H, 9.33; N, 8.43; C80H114N8O2Si requires: C, 76.99; H, 9.21; N, 8.98%. dH
(400 MHz, C6D6) 7.91 (8H, s), 4.70 (16H, t), 2.30 (16H, qn),
1.75 (16H, qn), 1.38 (32H, m) 0.88 (24H, t),25.74 (2H, br s).dC
(75 MHz, C6D6) 147.96, 138.41, 133.44, 130.14, 31.88, 31.27,
29.80, 28.31, 21.78, 12.96. MALDI-MS isotopic clusters at 1248 (20%, M1) and 1231 (100%, M 2 H
2O). lmax (abs.)
703.5 nm (THF),e~2.46105M21cm21.
3 Results and discussion
3.1 Preparation of materials
The synthesis and characterisation of1–7have been described elsewhere20,21,23,24and the synthetic protocols devised earlier
were applied within the syntheses of the novel compounds
8–15. Thus, octaalkylphthalocyanine derivatives were synthe-sised using the corresponding 3,6-dialkylphthalonitriles23 as
precursors. The latter were cyclotetramerised under basic conditions to afford the metal-free phthalocyanines.23 Metal-lated derivatives were prepared either by direct cyclotetramer-isation of the phthalonitriles in the presence of the appropriate metal salt, as in the case of9, or by metal ion insertion into the metal-free analogue, which provided access to8and10–12. The novel chloroindium derivative13 was obtained by react-ing the metal-free phthalocyanine with indium trichloride in pentanol. This was then converted into the 4-fluorophenylin-dium derivative14 using Grignard chemistry via procedures applied to related compounds by Hanack and Heckmann.25 The dihydroxysilicon phthalocyanine 15 was prepared from the corresponding metal-free phthalocyanine using the general procedure developed by Kenneyet al.26
3.2 Optical limiting measurements
The linear absorption spectra of phthalocyanine compounds have two main features: a Q band in the region of 700 nm and a B band in the region of 350 nm. These materials have a window between these two absorption bands with high linear transmittance, making them attractive as limiters of visible light (l#420–650 nm). The location (wavelength) of the peak of the Q band (lowest energy transition) is quoted for each of compounds1–15in Table 1.
All open-aperture Z-scans performed in this study exhibited a reduction in the transmission about the focus of the lens. This is typical of an induced positive nonlinear absorption of the incident light; in this case, attributed to reverse saturable excited-state absorption. All open-aperture Z-scan datasets were fitted using the method of least squares regression with eqn. 1 and eqn. 2. The beam waist radiusw0and the nonlinear
absorption coefficientbIwere treated as free parameters in the
fit, and all fits typically converged withR2values in excess of
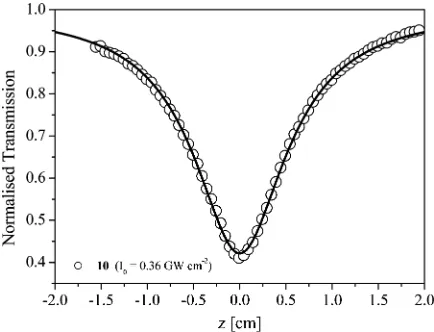
0.99. A sample of a typical open-aperture Z-scan spectrum with normalised transmission plotted as a function of sample positionzis depicted in Fig. 2 for compound10under incident focal intensity of 0.36 GW cm22. It was noticed that the nonlinear absorption coefficient bI, in all cases, was not
stationary with respect to the on-focus intensity. In Fig. 3, plots
J. Mater. Chem., 2003, , 1042–1047
Downloaded by Trinity College Dublin on 14/05/2013 12:35:17.
of the effective nonlinear absorption coefficient,bI, against the
on-focus beam intensity,I0, are presented for compounds1,5, 6,9,10and15as a sample subset of the entire dataset. Each data point on the plot represents an independent open-aperture Z-scan of the compound in question and the solid lines are sketched merely as guides to the eye. It can clearly be seen that bI reduces in magnitude with increasing focal
intensityI0 in the plot. The reason for this is probably that
the absorption effects are a combination of third and higher odd-order nonlinear absorptions. Despite this, effective third-order nonlinear absorption coefficients,bI, were estimated by
suitably interpolating data similar to those in Fig. 3 for all compounds at on-focus intensities of 0.5 GW cm22(arbitrarily chosen). Subsequently, using eqn. 3 and 4, effective third-order susceptibilities, Im{x(3)eff}, and molecular second
hyperpolar-isabilities Im{ceff} were calculated for this sample I0 value.
All calculated coefficients are presented in Table 1. The metal-free compounds1,2 and3 have hexyl, decyl and iso-pentyl chains respectively substituted to the macrocycle. The non-linear absorption coefficient is at its maximum for1[(1.8 ¡ 0.3)61028cm W21] and minimum for2[(1.5¡0.3)61028 cm W21], while2(decyl substituted) exhibits the largest mole-cular imaginary hyperpolarisability, with Im{ceff} # (4.3 ¡
0.8)6 10233 esu. Among the zinc compounds 6, 7 and 8, which have hexyl, decyl and iso-pentyl chains, respectively,
Table 1 Linear optical prop erties, calculat ed nonlin ear op tical coeffi cients and op tical limiting par ameters for co mpoun ds 1 – 15 ; m easured in tolu ene, excep t whe re oth erwise indicated C entral atom Alkyl chain c /g L 2 1 a0 /cm 2 1 lmax /nm I0 /GW cm 2 2 bI /cm W 2 1 Im{ x (3) eff }/esu Im{ ceff }/esu Fsat /J cm 2 2 k ( sex / s0 ) 1 H2 Hexyl 1.0 0.94 733 0.5 (1.8 ¡ 0.3) 6 10 2 8 (6.6 ¡ 1.3) 6 10 2 12 (3.6 ¡ 0.7) 6 10 2 32 16.8 ¡ 0.6 14.5 ¡ 0.3 2 H2 Decyl 1.0 0.83 730 0.5 (1.5 ¡ 0.3) 6 10 2 8 (5.8 ¡ 1.1) 6 10 2 12 (4.3 ¡ 0.8) 6 10 2 33 20.2 ¡ 1.0 14.4 ¡ 0.5 3 H2 Isope ntyl 1.0 0.94 731 0.5 (1.6 ¡ 0.3) 6 10 2 8 (5.9 ¡ 1.1) 6 10 2 12 (3.0 ¡ 0.6) 6 10 2 33 14.4 ¡ 0.5 11.3 ¡ 0.3 4 Ni Hexyl 1.0 1.05 702 0.5 (1.6 ¡ 0.3) 6 10 2 9 (5.9 ¡ 1.1) 6 10 2 13 (3.4 ¡ 0.6) 6 10 2 34 18 ¡ 3 2.4 ¡ 0.2 5 Ni Decyl 1.0 0.94 702 0.5 (1.5 ¡ 0.3) 6 10 2 9 (5.5 ¡ 1.1) 6 10 2 13 (4.2 ¡ 0.8) 6 10 2 34 13.3 ¡ 2.0 2.1 ¡ 0.1 6 Zn Hexyl 1.0 1.17 705 0.5 (4.0 ¡ 0.8) 6 10 2 8 (1.5 ¡ 0.3) 6 10 2 11 (8.6 ¡ 1.7) 6 10 2 33 7.1 ¡ 0.3 11.4 ¡ 0.3 7 Zn Decyl 1.0 1.17 705 0.5 (2.4 ¡ 0.4) 6 10 2 8 (9.1 ¡ 1.8) 6 10 2 12 (6.9 ¡ 1.3) 6 10 2 33 13.6 ¡ 0.5 11.7 ¡ 0.3 8 Zn Isope ntyl 1.0 1.05 703 0.5 (4.0 ¡ 0.8) 6 10 2 8 (1.5 ¡ 0.3) 6 10 2 11 (7.9 ¡ 1.5) 6 10 2 33 6.6 ¡ 0.2 12.2 ¡ 0.3 9 C u Isope ntyl 1.0 1.63 705 0.5 (6.4 ¡ 1.0) 6 10 2 8 (2.4 ¡ 0.4) 6 10 2 11 (1.3 ¡ 0.2) 6 10 2 32 4.6 ¡ 0.1 8.8 ¡ 0.1 10 Pd Hexyl 1.0 2.60 687 0.5 (9.6 ¡ 1.9) 6 10 2 8 (3.6 ¡ 0.7) 6 10 2 11 (2.1 ¡ 0.4) 6 10 2 32 2.1 ¡ 0.1 5.9 ¡ 0.1 11 Pb Hexyl 1.0 0.83 741 0.5 (2.9 ¡ 0.6) 6 10 2 8 (1.1 ¡ 0.2) 6 10 2 11 (7.0 ¡ 1.4) 6 10 2 33 9.8 ¡ 0.3 16.1 ¡ 0.3 12 Pb Isope ntyl 1.0 1.06 744 0.5 (4.6 ¡ 0.8) 6 10 2 8 (1.7 ¡ 0.3) 6 10 2 11 (9.2 ¡ 1.6) 6 10 2 33 7.1 ¡ 0.2 14.2 ¡ 0.2 13 InCl Hexyl 1.0 0.93 730 0.5 (3.2 ¡ 0.6) 6 10 2 8 (1.2 ¡ 0.2) 6 10 2 11 (7.3 ¡ 1.4) 6 10 2 33 10.1 ¡ 0.5 16.1 ¡ 0.3 14 InA rF Hexyl 1.0 0.93 728 0.5 (3.5 ¡ 0.6) 6 10 2 8 (1.3 ¡ 0.2) 6 10 2 11 (8.1 ¡ 1.6) 6 10 2 33 9.5 ¡ 0.2 16.2 ¡ 0.3 15 Si(OH )2 Hexyl 1.0 (TH F) 1.05 704 0.5 (2.7 ¡ 0.5) 6 10 2 8 (1.0 ¡ 0.2) 6 10 2 11 (7.3 ¡ 1.4) 6 10 2 33 9.2 ¡ 0.3 12.4 ¡ 0.3
Fig. 2Typical open-aperture Z-scan spectrum with normalised
trans-mission plotted as a function of sample position,z. Sample curve depicted is for compound10under incident focal intensity 0.36 GW cm22
.
Fig. 3Plots of effective nonlinear absorption coefficient,bI, against the
on-focus beam intensity,I0, for compounds1,5,6,9,10and15. Each
data point represents an independent open-aperture Z-scan and the solid lines are intended merely as guides to the eye.
J. Mater. Chem., 2003, , 1042–1047
Downloaded by Trinity College Dublin on 14/05/2013 12:35:17.
[image:4.595.317.534.45.211.2] [image:4.595.311.540.556.732.2]substituted to the macrocycle, the decyl-substituted compound
7exhibits the lowest molecular imaginary hyperpolarisability, with Im{ceff}#(6.9¡1.3)610233esu. For the nickel
com-pounds 4 and 5, the hexyl-substituted compound (4) also exhibits a lower Im{ceff} than its decyl-substituted counterpart
(5). The Pd-centred compound10exhibits the largest nonlinear absorption coefficient in this study, withbI#(9.6¡1.9)6
1028 cm W21, while the lowest bI was found for 5, a Ni
complex, withbI#(1.5¡0.3)61029cm W21. It is worth
noting that the magnitude of bI for the nickel compounds
(4and5) is an order of magnitude or more lower than thebI
values exhibited by any other compound in the study. The open-aperture spectra were manipulated and plotted as normalised transmission (Tnorm) against the incident energy
density per pulse [F ~ pw(z)2] to further investigate the nonlinear absorption. The nonlinear absorption coefficient,
a(F, Fsat, k),27 where a(F, Fsat, k) # a0(1 1 F/Fsat)21(1 1 kF/Fsat), derived from laser rate equations in a static
approximation, was used to fit the normalised transmission as a function of this energy density to a superposition of all open-aperture datasets for each compound. In this expression,
F represents the energy density, Fsat the saturation energy
density and k the ratio of the effective excited- to ground-state absorption cross-sections sex/s0. The parameters k
(realistically sex, asa0 was measured) and Fsat were treated
as free constants in the fitting. Thea0,kandFsat values for
each compound are also presented in Table 1.
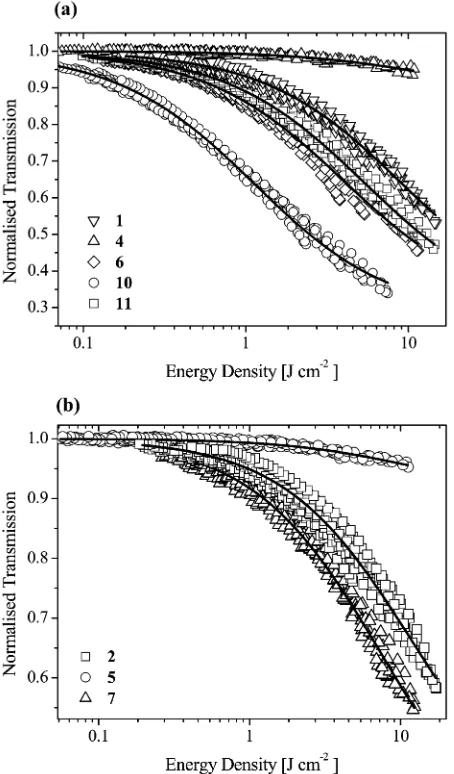
Representative optical limiting plots are presented in Fig. 4. A subset of the hexyl-substituted compounds (1,4,6,10 and
11) are case studied in Fig. 4(a) and a series of decyl-substituted compounds (2,5and 7) in Fig. 4(b). The optical limiting of the Pd phthalocyanine 10, which exhibits the largest bI at
(9.6¡1.9)61028cm W21, can be seen in Fig. 4(a). The other four compounds for which data are shown are the metal-free phthalocyanine (1) and the Ni (4), Zn (6) and Pb (11) com-plexes. In terms of the magnitude of the reduction in normalised transmission relative to incident energy density, the palladium compound 10 clearly outperforms the others. It also has a much lower saturation energy density,Fsat, than
the other phthalocyanines on the plot. Interestingly, the ratio of the absorption cross-sections, k, is smallest for the Ni phthalocyanine 4 and largest for the Pb phthalocyanine 11; thek coefficient for the Pd phthalocyanine is approximately 2.7 times smaller than that for the lead complex and approximately 2.5 times larger than that for the nickel compound. Thus, the k coefficient of the Pd compound is relatively low, despite it having a larger nonlinear absorption coefficient than compounds1,4and6. This arises because of its relatively large linear absorption coefficient,a0# 2.6 cm21.
It is clear then that substituting Ni into the central cavity has nothing but undesirable effects in terms of optical limiting, as the metal-free phthalocyanine1clearly has a much larger nonlinear response than the nickel compound. They have comparableFsatvalues, (18¡3) J cm
22
for Ni and (16.8¡ 0.6) J cm22for the metal-free case, but thekcoefficient for the Ni compound is approximately 6 times smaller than that for the metal-free phthalocyanine. The decyl chain-substituted subset presented in Fig. 4(b) includes the metal-free (2), Ni (5) and Zn (7) compounds. Again, it can clearly be seen that the nickel compound (5) is far outperformed by its counterparts. Its k
coefficient is approximately 5.5 times smaller than that for the zinc complex (7) and 7 times smaller than that for the metal-free compound (2). The two indium phthalocyanines,13 and
14, both exhibit large values for theirkcoefficient (comparable to that for the lead compound 11) and provide further data which point to the potential of indium compounds in optical limiting.10
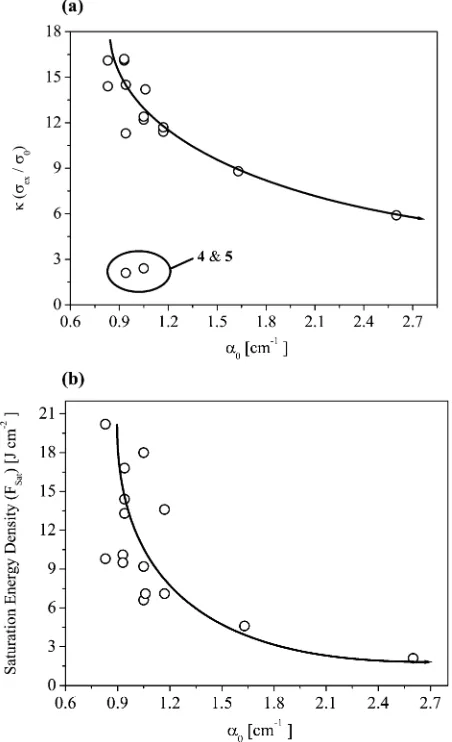
General trends in the optical limiting data are investigated in Fig. 5. The ratio of excited- to ground-state absorption coefficients, k, is plotted against the linear absorption coef-ficient,a0, in Fig. 5(a), with data from all compounds included.
The relationship betweenkanda0appears to exhibit a clear
trend, with the exception of data from the nickel complexes. The solid line, merely intended as a guide for viewing the data, appears to span the data points in an approximate way, with the exception of data from4and5. The Ni-centred phthalocyanines are poor optical limiters as they do not exhibit large nonlinear absorption coefficients relative to the other compounds. Thus, excluding the Ni compounds, this seems to suggest that the ratio of the effective excited- to ground-state absorption coefficients has a far closer link to the linear absorption coefficient than to the type of substituents in the central cavity or on the periphery of the phthalocyanine macrocycle. A similar plot of the saturation energy density,
Fsat, against the linear absorption coefficient,a0, is presented
in Fig. 5(b). In this case, the approximate trend mapped out by the sketched solid line again appears to exhibit a general dependence ona0. It is most interesting that the Ni compounds
appear to be in approximate agreement with the trend line in this case. These data appear to suggest that phthalocyanine design for nonlinear optical applications may be inextricably linked to tuning the linear absorption coefficient due to ground to excited singlet-state transitions.
Fig. 4 Plots of normalised transmission against energy density for (a)
compounds1,4,6,10and11, and (b) compounds2,5and7. In the plots, the solid lines are theoretical curve fits used to determineFsat
andk.
J. Mater. Chem., 2003, , 1042–1047
Downloaded by Trinity College Dublin on 14/05/2013 12:35:17.
[image:5.595.57.284.50.437.2]4 Conclusion
In summary, a series of 15 unmetallated and metallated octaalkylphthalocyanines have been synthesised and their third-order nonlinear optical properties characterised. The palladium-metallated compound is the strongest nonlinear absorber of the series, but, due to its comparatively high linear absorption coefficient, it exhibits a relatively low ratio of excited- to ground-state absorption cross-sections,k, when compared to the other compounds. The highest values fork
are exhibited by derivatives metallated with indium and lead. The nickel-metallated compounds are the weakest nonlinear absorbers, indicating their unsuitability as potential materials for practical passive optical limiters. This was interesting in that they were the only compounds to break the apparent trend observed in Fig. 5(a) between k and the linear absorption coefficient,a0. Phenomenologically, the data (kandFsat) were
found to follow trends dependent upon a0. This may have
some implications for phthalocyanine design for nonlinear optical applications.
Acknowledgements
This work was supported by CEC contract HPRN-CT2000-00020. We also thank the EPSRC’s mass spectrometry service, Swansea, UK, for data for compound characterisation.
References
1 J. W. Perry, K. Mansour, S. R. Marder, K. J. Perry, D. Alvarez and I. Choong,Opt. Lett., 1994,19, 625.
2 G. De La Torre, P. Vazquez, F. Agullo-Lopez and T. Torres, J. Mater. Chem., 1998,8, 1671.
3 H. S. Nalwa and J. S. Shirk, inPhthalocyanines: Properties and Applications, ed. C. C. Leznoff and A. B. P. Lever, VCH Publishers, Inc., New York, 1996, vol. 4, p. 83.
4 C. G. Claessens, W. J. Blau, M. J. Cook, M. Hanack, R. J. M. Nolte and T. Torres,Monatsh. Chem., 2001,132, 3.
5 J. Zyss, Nonlinear Optics: Materials, Physics and Devices, Academic Press, Boston, 1993.
6 D. S. Chemla and J. Zyss,Nonlinear Optical Properties of Organic Molecules and Crystals, Academic Press, Orlando, FL, 1987, vol. 1 and 2.
7 H. S. Nalwa and S. Miyata,Nonlinear Optics of Organic Molecules and Polymers, CRC Press, Boca Raton, FL, 1997.
8 J. L. Bre´das, C. Adant, P. Tackx, A. Persoons and B. M. Pierce, Chem. Rev., 1994,94, 243.
9 D. R. Coulter, V. M. Miskowski, J. W. Perry, T. H. Wei, E. W. van Stryland and D. J. Hagan,PIE Proc., 1989,1105, 42.
10 J. S. Shirk, R. G. S. Pong, S. R. Flom, H. Heckmann and M. Hanack, J. Phys. Chem., 2000, 104, 1438; J. W. Perry, K. Mansour, I. Y. S. Lee, X. L. Wu, P. V. Bedworth, C. T. Chen, D. Ng, S. R. Marder, P. Miles, T. Wada, M. Tian and H. Sasabe, Science, 1996,273, 1533; M. Hanack and M. Lang,Adv. Mater., 1994,6, 819.
11 K. Mansour, D. Alvarez, K. J. Perry, I. Choong, S. R. Marder and J. W. Perry, Org. Biol. Optoelectron., 1993, 1853, 132; M. K. Casstevens, M. Samoc, J. Pfleger and P. N. Prasad,J. Chem. Phys., 1990,923, 2019.
12 M. Hosoda, T. Wada, T. Yamamoto, A. Kaneko, A. F. Garito and H. Sasabe,Jpn. J. Appl. Phys., 1992,31, 1071.
13 J. S. Shirk, R. G. S. Pong, F. J. Bartoli and A. W. Snow,Appl. Phys. Lett., 1993,63, 1880.
14 F. Z. Henari, A. Davey, W. Blau, P. Haisch and M. Hanack, J. Porphyrins Phthalocyanines, 1999,3, 331.
15 Y. Chen, Y. L. Song, S. L. Qu and D. Y. Wang,Opt. Mater., 2001, 18, 219.
16 Y. Chen, L. R. Subramanian, M. Barthel and M. Hanack,Eur. J. Inorg. Chem., 2002, 1032; Y. Chen, M. Barthel, M. Seiler, L. R. Subramanian and M. Hanack, Angew. Chem., 2002,114, 3372; Y. Chen, M. Barthel, M. Seiler, L. R. Subramanian and M. Hanack,Angew. Chem., Int. Ed., 2002,41, 3239.
17 M. Yamashita, F. Inui, K. Irokawa, A. Morinaga, T. Tako and H. Morawaki,Appl. Surf. Sci., 1998,883, 130.
18 T. C. Wen and I. D. Lian,Synth. Met., 1996,83, 111. 19 M. J. Cook,Chem. Record, 2002,2, 225.
20 M. J. Cook, I. Chambrier, S. J. Cracknell, D. A. Mayes and D. A. Russell,Photochem. Photobiol., 1995,62, 542.
21 I. Chambrier, M. J. Cook and P. T. Wood,Chem. Commun., 2000, 2133.
22 M. Sheik-Bahae, A. A. Said, T.-H. Wei, D. J. Hagan and E. W. Van Stryland,IEEE J. Quantum Electron., 1990,26, 760.
23 N. B. McKeown, I. Chambrier and M. J. Cook,J. Chem. Soc., Perkin Trans., 1990,1, 1169.
24 M. J. Cook, S. J. Cracknell and K. J. Harrison,J. Mater. Chem., 1991,1, 703.
25 M. Hanack and H. Heckmann,Eur. J. Chem., 1998, 367. 26 M. Aoudia, G. Cheng, V. O. Kennedy, M. E. Kenney and
M. A. J. Rodgers,J. Am. Chem. Soc., 1998,117, 6029.
27 S. M. O’Flaherty, S. V. Hold, M. J. Cook, T. Torres, Y. Chen, M. Hanack and W. J. Blau,Adv. Mater., 2003,15, 19.
Fig. 5 Investigation of general trends in the optical limiting data: (a)
ratio of excited- to ground-state absorption coefficients, k, plotted against the linear absorption coefficient, a0, for all compounds; (b) saturation energy density,Fsat, plotted againsta0for all compounds.
J. Mater. Chem., 2003, , 1042–1047
Downloaded by Trinity College Dublin on 14/05/2013 12:35:17.
[image:6.595.57.283.50.421.2]